https://judithcurry.com/2024/03/24/the-extraordinary-climate-events-of-2022-24/
https://wattsupwiththat.com/2024/03/25/the-extraordinary-climate-events-of-2022-24/

Figure 1. The Hunga Tonga eruption from space.

Figure 2. Stratospheric water vapor in ppm by latitude over time at 31.6 hPa altitude. The evolution of the Hunga Tonga water vapor is clearly seen from its tropical injection toward the poles.
+++++++++++++++
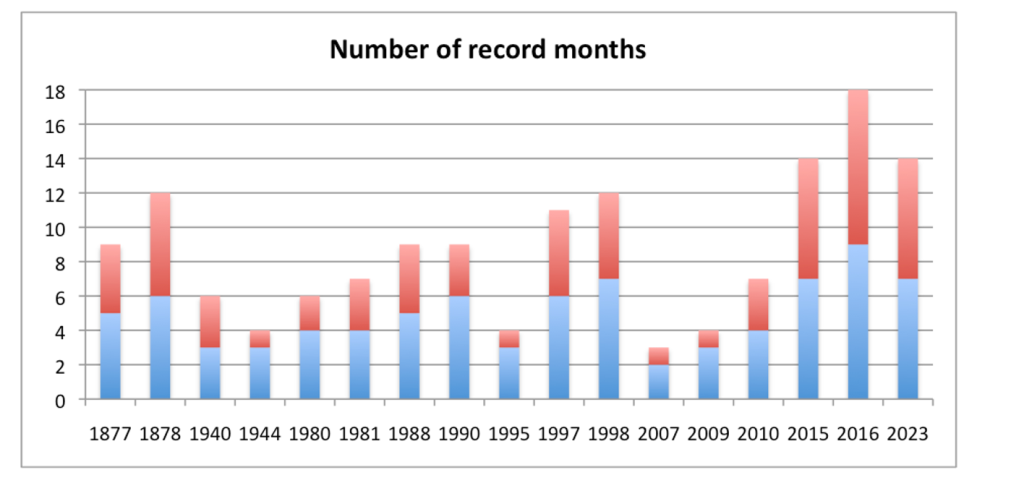
Figure 4. The number of record months in the record years is shown in blue. In red is the number of those record months that were consecutive.
++++++++++++++++=

Figure 6. Westerly (positive) stratospheric zonal winds at 60°N (red line) reached the zero-speed line three times this year, indicating a sudden stratospheric warming event and polar vortex break down each time.
++++++++++++=
Figure 7 illustrates this trend, with an orange line representing Arctic temperatures in 2023 according to the Danish Meteorological Institute, and a green line representing temperatures this year. Since the greenhouse effect is relatively weak during the Arctic winter due to limited water vapor in the atmosphere, the result is that more energy escapes from the planet due to the weakened vortex. This serves to mitigate and reduce the unusual warming observed in the second half of 2023, which contributed to it being the warmest year on record.

Figure 7. Arctic surface temperature for the year 2023 (orange) and 2024 (green), compared to the 1958-2002 average (blue).
Despite the additional heat being transported to the Arctic, leading to increased temperatures, there hasn’t been a corresponding decrease in Arctic sea ice extent. In fact, this winter’s sea ice extent exceeds the 2010-2020 average. It appears that, contrary to widespread fears of its disappearance, Arctic ice remains resilient and stable.

Figure 8. Arctic sea ice extent in 2024 compared to the 2001-10 and 2011-20 decadal averages from the National Snow and Ice Data Center.