
Time flies, it's already August 16th. We're all exactly 1 day older than yesterday. Do something special to remember this next day!
Scroll down and enjoy the latest comprehensive weather to the max!!
This weeks rain event is winding down with less rain than predicted in some central Cornbelt locations(IL)..........so far but still some rains the next day.
The next, huge rain event starts on Saturday in the Plains. Widespread, belt wide rains on the way. Not quite as much today in MO/IL/IN/OH as yesterday but by August standards this should be a blockbuster rain event.
The latest rain forecasts are below...........broken down into each period coming up. Then the 1 week totals.
Day 1 below:
http://www.wpc.ncep.noaa.gov/qpf/fill_94qwbg.gif?1526306199054

Day 2 below:
http://www.wpc.ncep.noaa.gov/qpf/fill_98qwbg.gif?1528293750112

Day 3 below:
http://www.wpc.ncep.noaa.gov/qpf/fill_99qwbg.gif?1528293842764

Days 4-5 below:
http://www.wpc.ncep.noaa.gov/qpf/95ep48iwbg_fill.gif?1526306162

Days 6-7 below:
http://www.wpc.ncep.noaa.gov/qpf/97ep48iwbg_fill.gif?1526306162

7 Day Total precipitation below:
http://www.wpc.ncep.noaa.govcdx /qpf/p168i.gif?1530796126

Excessive Rainfall threat. System today and Friday, southern and eastern belt and points just southeast. Then new system emerges in Plains on Saturday.
Current Day 1 Forecast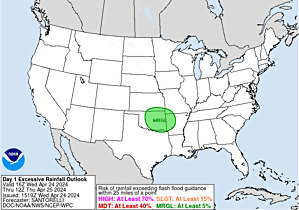 |
Day 1 Threat Area in Text Format
Current Day 2 Forecast |
Day 3 forecast below
Severe Storm Risk. Hit the map for full screen. Slight risk Central Plains.
https://www.spc.noaa.gov/products/outlook/
Current Day 1 Outlook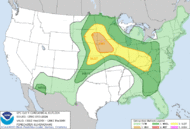 | |
Current Day 2 Outlook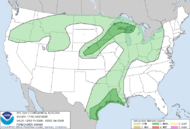 | |
Current Day 3 Outlook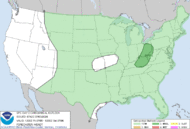 | |
Current Day 4-8 Outlook |
High Temperatures today and Friday. Hot in several places....especially the West(spills into the N.Plains tomorrow), South and East Coast too.


Dew points. 70+ on this scale makes it feel uncomfortable(sticky air)! Faily Humid over the eastern half of the country............pooling moisture providing high precipitable water to use for heavy rains.

Heat and high humidity COMBINED. Feels like temperature. Feeling sultry in much of the country.

Highs days 3-7.
Heat in the West again, just not as intense.
Becoming very Pleasant from the Plains to Midwest to East.

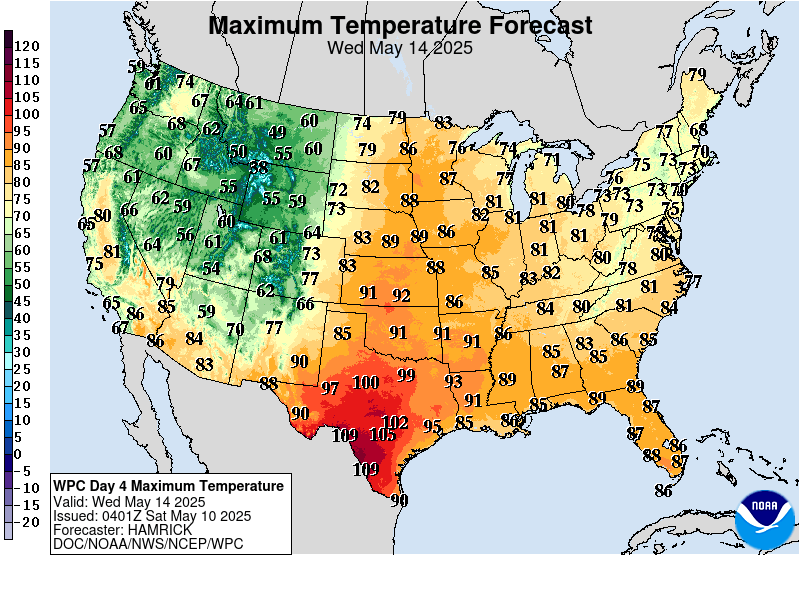


How do these days 3-7 temperatures compare to average at this time of year? We are now 4 weeks past the climatological time of year when temperatures are the hottest.
Hot West. Cool Central Plains and points east/southeast.
High temperature departures:
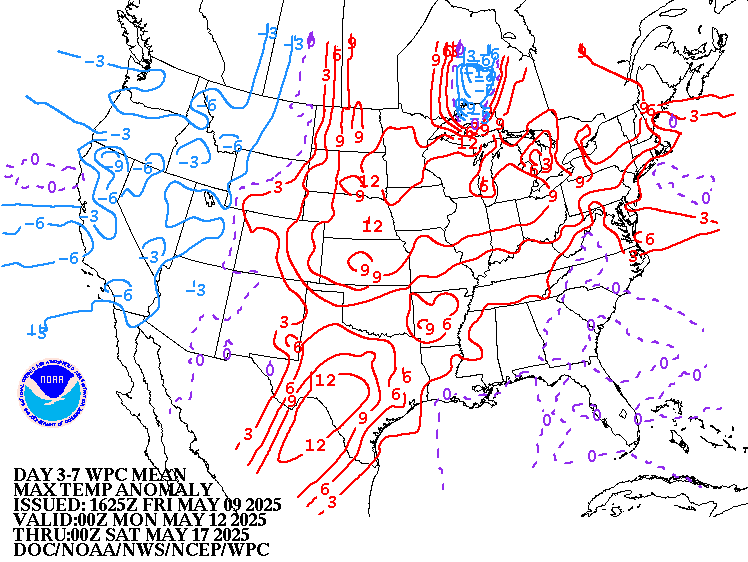
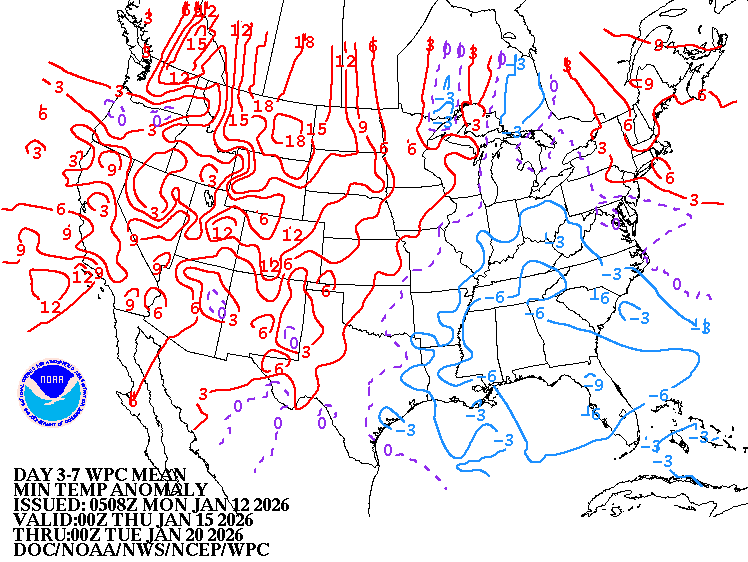
Low Temperature Departures:
Weather system in the Midsection moving veeeery slowly, several pieces.
https://weather.com/maps/currentusweather

Satellite picture.

Rains the past 24 hours. NE/w.IA and Ohio Valley.
![]()
You can go to this link to see rain totals from recent time periods:
https://water.weather.gov/precip/
Go to precipitation, then scroll down to pick a time frame. Hit states to get the borders to see locations better. Under products, you can hit "observed" or "Percent of normal"
Missouri to S.Plains was in horrible shape......the map below shows massive improvement in the S.Plains as the drought gets busted!
MO still very dry. 

Below are rains compared to average of the last 7, 14, 30 and 60 days. Usually not updated for previous day until late the next day. Midwest info not updated.
https://www.atmos.illinois.edu/~snodgrss/Ag_Wx.html


Drought Monitor. This product is updated every Thursday. Drought will be shrinking.
http://droughtmonitor.unl.edu/Maps/CompareTwoWeeks.aspx

Temperature Anomalies from GFS ensembles(fairly reliable product) going out 2 weeks. These maps show the Northern Hemisphere. The map of the US is front center. Look for the state borders in white.
Today: Hot in the West but not AS hot as recent days. Most places near average. 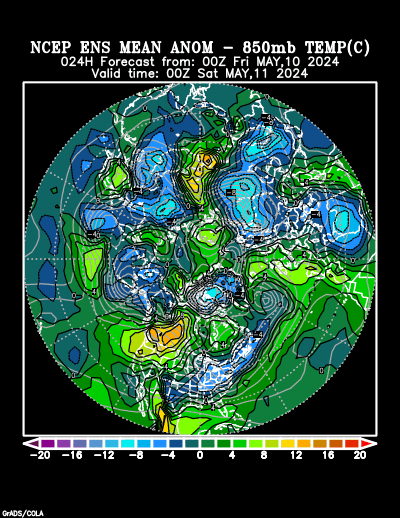
In 5+ days:
Hot along the West Coast. Strong cool surge Plains/Midwest....diving southeast! 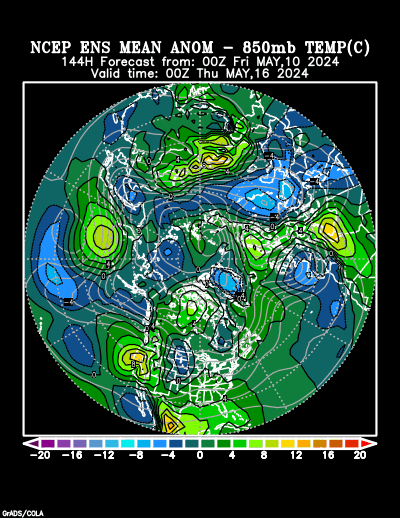
In 10+ days Warmest West again!!!! Heat moving around...... ..most places close to average.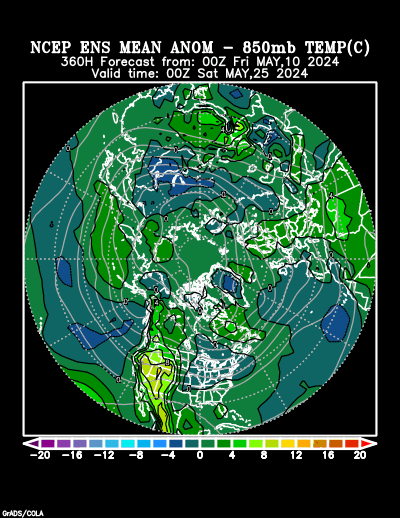
Day 15 Warmest West. Massive uncertainty elsewhere.
Latest 0z run of the Canadian model ensembles..........for late week 2. Some battling forces and huge disparity in solutions. Big heat ridge somewhere! Also, strong jet stream!
Heat ridge potential looking LESS impressive today for East...........but lots if disagreement.
The top map is the ensemble average, the maps below are the individual members that make up the average.
++++++++++++++++++++++++++++++++++++++++++++++++++++++++++++++++
Each member is like the parent, Canadian model operational model.......with a slight tweek/variation in parameters. Since we know the equations to represent the physics of the atmosphere in the models are not perfect, its useful to vary some of the equations that are uncertain(can make a difference) to see if it effects the outcome and how.
The average of all these variations(ensembles) often yields a better tool for forecasting. It's always more consistent. The individual operational model, like each individual ensemble member can vary greatly from run to run.........and represent an extreme end of the spectrum at times. The ensemble average of all the members, because it averages the extremes.............from opposite ends of the spectrum............changes much less from run to run.
372h GZ 500 forecast valid on Aug 31, 2018 12 UTC
Forecasts for the control (GEM 0) and the 20 ensemble members (global model not available)
Below are some of the 0z GFS individual ensembles at the end of 2 weeks. Alot of disagreement with some still placing the Upper level heat ridge farther east....... like yesterday.
At the moment, I am still leaning slightly towards the heat ridge in the East.

The low skill, longer range CFS model for weeks 3 and 4.
Anomolies today have less magnitude vs recent days.

Precip below:

By cfdr - Aug. 15, 2018, 10:54 p.m.
Once again, thanks, mike. We're still up here in Terrace - plan to be here for another four weeks or so. Not that I like the forecasts for this area - fires are really bad, and the only road in here goes through some areas that are burning up. The models do not look like they show any change in this persistent pattern.
At least it hasn't affected the fish - the river fresh sockeye on the grill are just outstanding.
I appreciate the reports - even if they don't show what I would like them to show.
++++++++++++++++++++++++++++++++++++++++++++++++++++++++
By metmike - Aug. 15, 2018, 10:59 p.m.
You're very welcome cfdr!
Always great to hear from you and glad the fish are biting.
+++++++++++++++++++++++++++++++++++++++++++++++++++
By mcfarm - Aug. 16, 2018, 7:12 a.m.
Mike, we got nearly an inch of rain yesterday. Although too late {as the crops are ahead of schedule} to do much good I'm sure they helped some. The grass looks better already this morning. Combine that with a 20
China rumor rally and this day is starting fine.
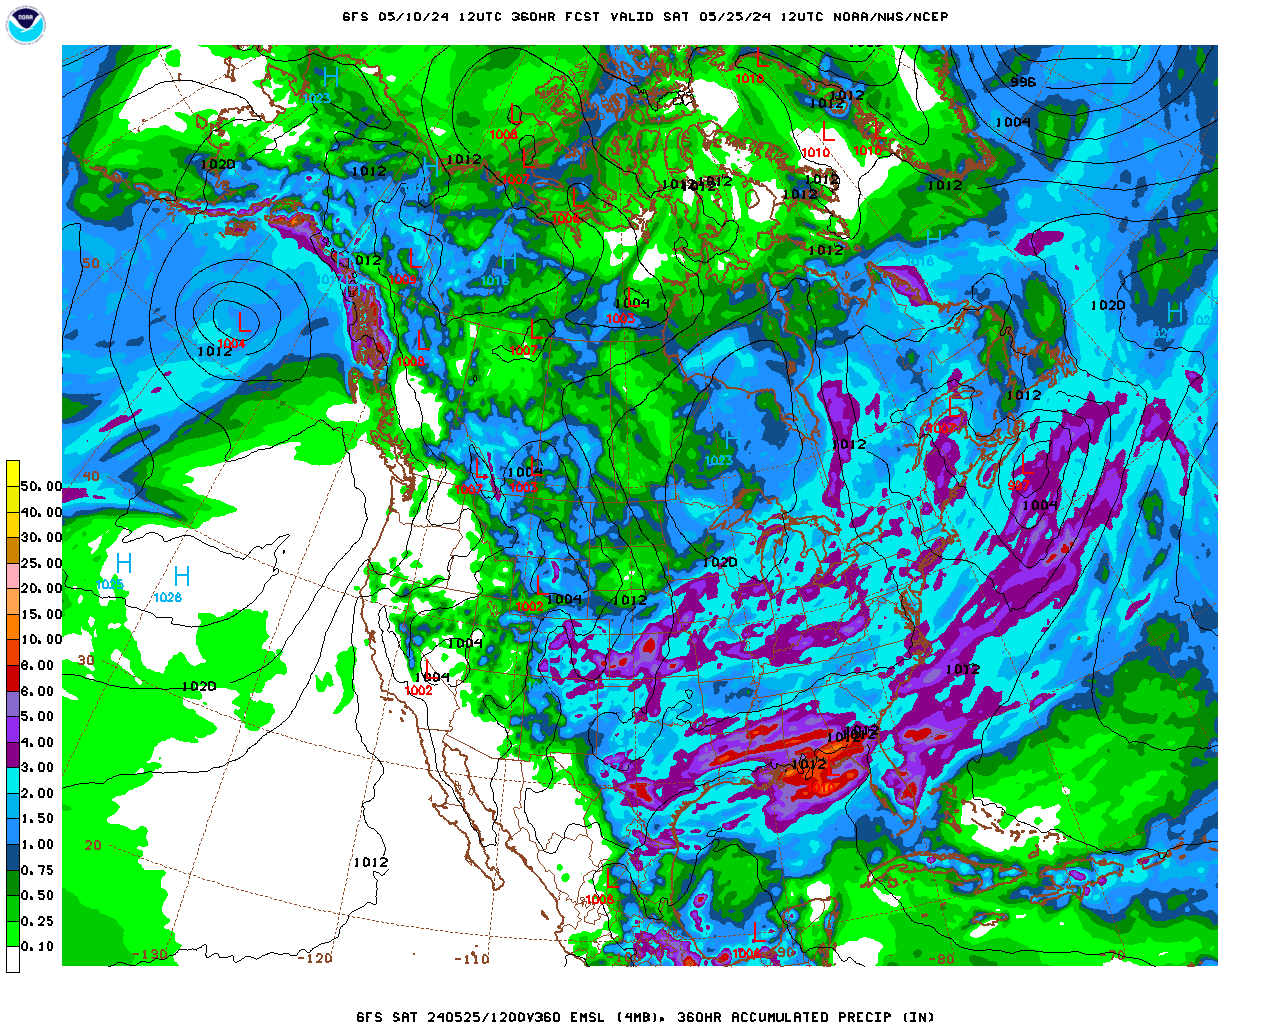
Week 2 solutions are going to be all over the place. This particular one, the last 12z GFS operational model at the end of week 2 is below. It has some upper level ridging in the Cornbelt and less rain than previous solutions:
This "might" happen.
gfs_namer_372_200_wnd_ht | gfs_namer_372_500_vort_ht |
gfs_namer_372_1000_500_thick | gfs_namer_372_850_temp_ht |
Total 2 week precip below:
Forecast Hour: 360
Image URL: http://mag.ncep.noaa.gov/data/gfs/12/namer/precip_ptot/gfs_namer_360_precip_ptot.gif
More members of the last 12z Canadian model ensembles with the heat ridge farther east than the previous run.........somewhere between the S.Plains and East Coast/Southeast.
Upper level trough along the West Cost teleconnects well with this pattern downstream.........which is certainly..........uncertain!
372h GZ 500 forecast valid on Sep 1, 2018 00UTC
Forecasts for global GEM, control (GEM 0) and the 20 ensemble members
NWS extended maps turning in the directions as speculated yesterday:
"Could turn out much different with regards to temperatures as we get deeper into week 2(potential to be much warmer in the midsection)"
6-10 day Temperature Probability | |
Precipitation Probability | |
8-14 day Temperature Probability | |
Precipitation Probability | |
Extreme weather days 3-7:
Heavy rain event, starting in the Plains over the weekend and moving northeast, into the Great Lakes by early next week. Also in Mid Atlantic area,
