For the weather that effects growing crops, go here:
Export inspections just released:
https://www.ams.usda.gov/mnreports/wa_gr101.txt
Excellent for Corn, not too bad for beans/wheat
Was thinking the lows are in for corn before the USDA report earlier this month +favorable weather for filling in August but am not sure.
Too much rain continues to lend some strength today.
CZ around 367.......17c off the lows right now and 61c off the late May highs. Charts below are for the front month Sept.
Corn historical perspective:
Who remembers $8 corn not so long(5 years) ago
3 month below September(front month)
1 year below
5 year below
|
The low for SX back in mid July was to just above 826 not 835. So this current move down just below 829 on Thursday night did not make new lows.
I thought the lows were in for beans but that was before the USDA fed the market one of the most bearish crop reports ever. 2019 to have the highest stocks in history!
Also, outstanding August weather has increased the crop size.
SX dropped just below 8.30 but DID NOT make new lows. Too much rain coming up is providing some support.
These are 10 year lows and over $2 below the $10.60 below late May highs but 20c above the lows last week and 23c above the lows of July.
When these heavy rains go away we will probably go much lower.
Soybeans: Wider perspective: Currently below 10 year lows !!!!!
Charts below not updated this morning and is still Sept contract.
Soybeans 3 months below......bottom in.
| |
Soybeans 1 year chart below
| |
Soybeans 5 years below
Soybeans10years-Wow, look at that high from the drought of 2012...and demand, Currently, we are below the 10 year lows!
| |
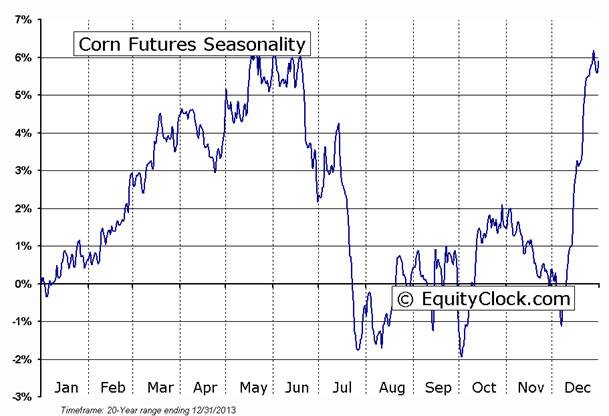
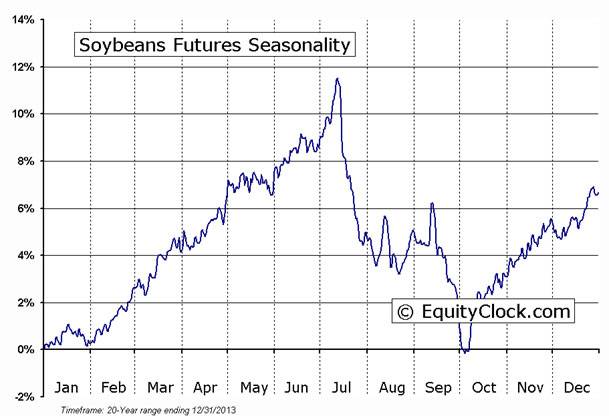
As noted below in the seasonals(averaging prices over a 20 year period and graphing them with time), most of the price weakness in corn and beans takes place in June and July.
In many years, the month of August into early September features some price strength.......as much of the weather premium has come out and much of the crop size is known. Even great weather, sometimes has a hard time inspiring additional aggressive selling that pushes prices to new lows.
However, this August has featured great weather and a record crop and has pushed us back near the lows.
At the moment, heavy rains in the forecast are lending support.
This was often described as "frost risk premium" ahead of a potential early freeze.......not much need for that this year with the crop so advanced and weather pattern so warm. However, we have never had a bounce at this time of year from excessive rains.............because they are so rare in early September.
Beans have a pretty strong, brief spike down in late Sept, headed into early harvest that can often features new lows. Corn sometimes too but it often does not take out the Summer lows.
By metmike - Aug. 29, 2018, 10:38 p.m.
Hi Cliff,
Of course the tariff situation made things worse but the last time that ending stocks as a % of usage were projected to be higher than this was the mid 1980's! Do you remember prices then?
Like you said, with harvest pressure, prices are likely to get even lower than where they are now.........which is 10 year lows. We could drop well below $8 based on the graphs below.
If you look at prices at the bottom, it's a reminder that soybeans were under $5 from early 1999 thru half of 2002 with fundamentals far more bullish than they are now.
So as long as we don't have unprecedented damage from flooding in September, as soon as the market trades on harvest pressure, the bottom really can fall out. The actual bottom will be lower because of the China situation but here on planet earth, the empirical data below means prices would still very likely have dropped below 10 year lows at harvest.
The last 3 years, in Sept. soybean prices were 9.05-2015, 9.43-2016 and 9.35-2017 with MUCH less bearish projections of ending stocks as a % of total use. Then they dropped even lower than that from harvest pressure.
People forget but the only reason that we got above $10 earlier this year was a drought in parts of South America for 2 months, then funds loading up with a huge speculative long position ahead of our growing season.
At the end of May 2018, when the weather turned from hot/dry forecasts to wet and crop estimates kept increasing......they covered their longs and built up a huge short position.
https://www.agmanager.info/grain-marketing/grain-supply-and-demand-wasde
US Monthly Average Soybeans Price Received |
| Year | Jan | Feb | Mar | Apr | May | Jun | Jul | Aug | Sep | Oct | Nov | Dec | Avg* |
|---|---|---|---|---|---|---|---|---|---|---|---|---|---|
| $/bu. | |||||||||||||
| 1960 | 2.01 | 1.99 | 1.99 | 2.02 | 2.00 | 1.97 | 1.97 | 1.99 | 1.97 | 1.94 | 1.96 | 1.99 | 1.98 |
| 1961 | 2.23 | 2.48 | 2.68 | 3.02 | 2.96 | 2.60 | 2.48 | 2.49 | 2.34 | 2.20 | 2.27 | 2.30 | 2.50 |
| 1962 | 2.32 | 2.32 | 2.34 | 2.38 | 2.36 | 2.34 | 2.35 | 2.33 | 2.25 | 2.23 | 2.30 | 2.35 | 2.32 |
| 1963 | 2.41 | 2.50 | 2.51 | 2.45 | 2.47 | 2.48 | 2.44 | 2.45 | 2.44 | 2.56 | 2.66 | 2.58 | 2.50 |
| 1964 | 2.65 | 2.57 | 2.55 | 2.45 | 2.36 | 2.35 | 2.34 | 2.35 | 2.51 | 2.55 | 2.57 | 2.71 | 2.50 |
| 1965 | 2.73 | 2.81 | 2.85 | 2.85 | 2.72 | 2.74 | 2.69 | 2.53 | 2.35 | 2.31 | 2.36 | 2.48 | 2.62 |
| 1966 | 2.67 | 2.77 | 2.71 | 2.78 | 2.90 | 3.04 | 3.37 | 3.49 | 2.97 | 2.78 | 2.80 | 2.82 | 2.93 |
| 1967 | 2.77 | 2.71 | 2.74 | 2.71 | 2.69 | 2.71 | 2.66 | 2.56 | 2.53 | 2.44 | 2.43 | 2.48 | 2.62 |
| 1968 | 2.53 | 2.57 | 2.57 | 2.56 | 2.58 | 2.54 | 2.52 | 2.51 | 2.40 | 2.32 | 2.40 | 2.42 | 2.49 |
| 1969 | 2.46 | 2.48 | 2.48 | 2.51 | 2.56 | 2.52 | 2.52 | 2.51 | 2.28 | 2.23 | 2.30 | 2.30 | 2.43 |
| 1970 | 2.36 | 2.40 | 2.42 | 2.48 | 2.52 | 2.60 | 2.72 | 2.65 | 2.66 | 2.77 | 2.86 | 2.77 | 2.60 |
| 1971 | 2.86 | 2.92 | 2.91 | 2.80 | 2.85 | 2.98 | 3.18 | 3.09 | 2.95 | 2.96 | 2.84 | 2.93 | 2.94 |
| 1972 | 2.92 | 3.00 | 3.20 | 3.37 | 3.35 | 3.32 | 3.34 | 3.36 | 3.26 | 3.13 | 3.38 | 3.95 | 3.30 |
| 1973 | 4.11 | 5.49 | 6.04 | 6.14 | 8.27 | 10.00 | 6.69 | 8.99 | 5.81 | 5.63 | 5.14 | 5.65 | 6.50 |
| 1974 | 5.87 | 6.07 | 5.96 | 5.15 | 5.21 | 5.13 | 6.11 | 7.55 | 7.32 | 8.17 | 7.44 | 7.03 | 6.42 |
| 1975 | 6.30 | 5.72 | 5.31 | 5.60 | 5.00 | 4.90 | 5.28 | 5.80 | 5.32 | 4.92 | 4.45 | 4.28 | 5.24 |
| 1976 | 4.46 | 4.50 | 4.46 | 4.52 | 4.87 | 6.16 | 6.73 | 6.07 | 6.65 | 5.90 | 6.11 | 6.56 | 5.58 |
| 1977 | 6.81 | 7.06 | 7.83 | 9.05 | 9.24 | 8.13 | 6.52 | 5.48 | 5.17 | 5.28 | 5.61 | 5.68 | 6.82 |
| 1978 | 5.75 | 5.53 | 6.20 | 6.49 | 6.77 | 6.69 | 6.40 | 6.21 | 6.20 | 6.26 | 6.41 | 6.49 | 6.28 |
| 1979 | 6.58 | 6.99 | 7.16 | 7.06 | 7.06 | 7.36 | 7.36 | 7.07 | 6.81 | 6.35 | 6.30 | 6.27 | 6.86 |
| 1980 | 6.39 | 6.20 | 5.94 | 5.63 | 5.76 | 5.91 | 6.75 | 7.18 | 7.59 | 7.68 | 8.18 | 7.80 | 6.75 |
| 1981 | 7.80 | 7.50 | 7.59 | 7.60 | 7.40 | 7.05 | 7.13 | 6.71 | 6.21 | 6.06 | 6.04 | 6.00 | 6.92 |
| 1982 | 6.13 | 6.04 | 5.99 | 6.17 | 6.27 | 6.12 | 5.99 | 5.59 | 5.22 | 5.06 | 5.34 | 5.46 | 5.78 |
| 1983 | 5.56 | 5.66 | 5.82 | 6.09 | 6.06 | 5.90 | 6.27 | 7.57 | 8.28 | 7.96 | 7.81 | 7.75 | 6.73 |
| 1984 | 7.85 | 7.28 | 7.68 | 7.83 | 8.12 | 7.99 | 6.95 | 6.50 | 6.09 | 6.07 | 6.01 | 5.82 | 7.02 |
| 1985 | 5.91 | 5.77 | 5.88 | 5.88 | 5.70 | 5.62 | 5.42 | 5.10 | 4.99 | 4.85 | 4.92 | 5.01 | 5.42 |
| 1986 | 5.16 | 5.18 | 5.23 | 5.23 | 5.25 | 5.19 | 5.11 | 4.99 | 4.85 | 4.55 | 4.64 | 4.67 | 5.00 |
| 1987 | 4.70 | 4.69 | 4.73 | 4.90 | 5.20 | 5.36 | 5.25 | 5.02 | 5.02 | 5.04 | 5.36 | 5.63 | 5.08 |
| 1988 | 5.73 | 5.96 | 6.05 | 6.39 | 6.98 | 8.18 | 8.50 | 8.33 | 7.93 | 7.53 | 7.43 | 7.53 | 7.21 |
| 1989 | 7.69 | 7.41 | 7.51 | 7.29 | 7.20 | 7.05 | 6.83 | 6.07 | 5.70 | 5.55 | 5.66 | 5.64 | 6.63 |
| 1990 | 5.65 | 5.56 | 5.65 | 5.82 | 5.97 | 5.88 | 5.97 | 6.00 | 5.99 | 5.88 | 5.78 | 5.72 | 5.82 |
| 1991 | 5.71 | 5.65 | 5.76 | 5.77 | 5.67 | 5.56 | 5.36 | 5.66 | 5.64 | 5.48 | 5.48 | 5.45 | 5.60 |
| 1992 | 5.54 | 5.59 | 5.67 | 5.66 | 5.87 | 5.94 | 5.59 | 5.40 | 5.36 | 5.26 | 5.36 | 5.61 | 5.57 |
| 1993 | 5.58 | 5.56 | 5.65 | 5.73 | 5.81 | 5.90 | 6.56 | 6.56 | 6.21 | 6.01 | 6.32 | 6.64 | 6.04 |
| 1994 | 6.72 | 6.71 | 6.73 | 6.57 | 6.77 | 6.72 | 5.92 | 5.58 | 5.47 | 5.30 | 5.36 | 5.41 | 6.11 |
| 1995 | 5.47 | 5.40 | 5.51 | 5.55 | 5.56 | 5.68 | 5.90 | 5.83 | 5.98 | 6.16 | 6.40 | 6.76 | 5.85 |
| 1996 | 6.78 | 7.00 | 7.00 | 7.43 | 7.69 | 7.41 | 7.62 | 7.82 | 7.79 | 6.94 | 6.90 | 6.91 | 7.27 |
| 1997 | 7.13 | 7.38 | 7.97 | 8.23 | 8.40 | 8.16 | 7.52 | 7.25 | 6.72 | 6.49 | 6.86 | 6.72 | 7.40 |
| 1998 | 6.69 | 6.57 | 6.40 | 6.26 | 6.26 | 6.16 | 6.14 | 5.43 | 5.25 | 5.18 | 5.39 | 5.37 | 5.93 |
| 1999 | 5.32 | 4.80 | 4.61 | 4.63 | 4.50 | 4.44 | 4.19 | 4.39 | 4.57 | 4.48 | 4.45 | 4.43 | 4.57 |
| 2000 | 4.62 | 4.79 | 4.91 | 5.00 | 5.19 | 4.93 | 4.53 | 4.45 | 4.59 | 4.45 | 4.55 | 4.78 | 4.73 |
| 2001 | 4.68 | 4.46 | 4.39 | 4.22 | 4.33 | 4.46 | 4.79 | 4.85 | 4.53 | 4.09 | 4.16 | 4.20 | 4.43 |
| 2002 | 4.22 | 4.22 | 4.38 | 4.47 | 4.64 | 4.88 | 5.35 | 5.53 | 5.39 | 5.20 | 5.46 | 5.46 | 4.93 |
| 2003 | 5.51 | 5.55 | 5.59 | 5.82 | 6.07 | 6.09 | 5.82 | 5.68 | 6.06 | 6.60 | 7.05 | 7.17 | 6.08 |
| 2004 | 7.35 | 8.28 | 9.28 | 9.62 | 9.56 | 9.08 | 8.46 | 6.83 | 5.84 | 5.56 | 5.36 | 5.45 | 7.56 |
| 2005 | 5.57 | 5.42 | 5.95 | 6.03 | 6.20 | 6.58 | 6.84 | 6.15 | 5.77 | 5.67 | 5.62 | 5.77 | 5.96 |
| 2006 | 5.88 | 5.67 | 5.57 | 5.52 | 5.68 | 5.61 | 5.61 | 5.23 | 5.24 | 5.52 | 6.07 | 6.18 | 5.65 |
| 2007 | 6.38 | 6.87 | 6.95 | 6.88 | 7.13 | 7.51 | 7.56 | 7.72 | 8.18 | 8.36 | 9.41 | 10.00 | 7.75 |
| 2008 | 9.96 | 11.70 | 11.50 | 12.00 | 12.10 | 13.20 | 13.30 | 12.80 | 10.70 | 9.94 | 9.38 | 9.24 | 11.32 |
| 2009 | 9.97 | 9.55 | 9.12 | 9.79 | 10.70 | 11.40 | 10.80 | 10.80 | 9.75 | 9.44 | 9.53 | 9.80 | 10.05 |
| 2010 | 9.79 | 9.41 | 9.39 | 9.47 | 9.41 | 9.45 | 9.79 | 10.10 | 9.98 | 10.20 | 11.10 | 11.60 | 9.97 |
| 2011 | 11.60 | 12.70 | 12.70 | 13.10 | 13.20 | 13.20 | 13.20 | 13.40 | 12.20 | 11.80 | 11.70 | 11.50 | 12.53 |
| 2012 | 11.90 | 12.20 | 13.00 | 13.80 | 14.00 | 13.90 | 15.40 | 16.20 | 14.30 | 14.20 | 14.30 | 14.30 | 13.96 |
| 2013 | 14.30 | 14.60 | 14.60 | 14.40 | 14.90 | 15.10 | 15.30 | 14.10 | 13.30 | 12.50 | 12.70 | 13.00 | 14.07 |
| 2014 | 12.90 | 13.20 | 13.70 | 14.30 | 14.40 | 14.30 | 13.10 | 12.40 | 10.90 | 9.97 | 10.20 | 10.30 | 12.47 |
| 2015 | 10.30 | 9.91 | 9.85 | 9.69 | 9.58 | 9.58 | 9.95 | 9.71 | 9.05 | 8.81 | 8.68 | 8.76 | 9.49 |
| 2016 | 8.71 | 8.51 | 8.56 | 9.04 | 9.76 | 10.20 | 10.20 | 9.93 | 9.43 | 9.30 | 9.46 | 9.64 | 9.40 |
| 2017 | 9.71 | 9.86 | 9.69 | 9.32 | 9.26 | 9.10 | 9.42 | 9.24 | 9.35 | 9.18 | 9.22 | 9.30 | 9.39 |
| 2018 | 9.30 | 9.49 | 9.81 |
Crop ratings stayed the same for beans, dropped 1% from gd to fair in corn.
Too late in the year to hurt the crop yields unless we would have extreme rains that lasted.
https://www.marketforum.com/forum/topic/11818/
Winter wheat planting is starting in some places this month, especially SD/NE. It will be listed on the USDA reports pretty soon.