For the weather that effects natural gas prices(residential heating demand) go here:
https://www.marketforum.com/forum/topic/15392/
From Natural Gas Intelligence early Wednesday:
Small Changes in Forecast Cold as November Natural Gas Called Slightly Higher
8:46 AM
November natural gas futures were trading slightly higher early Wednesday, up about 2.3 cents to $3.262 at around 8:30 a.m. ET, as forecasters noted small adjustments to the latest weather outlook overnight
Storage is Very Low for this time of year!!
Storage is below the bottom of the previous 5 year range and over 600 bcf below last year at this time!
This is why the temperature forecast matters....in the Summer/cooling season and Winter/heating season. We have a spike up of early season residential heating demand this week into next week.

EIA report from last Thursday +90 bcf
Reported as neutral to the market(I thought is was a tad bearish)
| Working gas in underground storage, Lower 48 states Summary textCSVJSN | |||||||||||||||||||||||||
|---|---|---|---|---|---|---|---|---|---|---|---|---|---|---|---|---|---|---|---|---|---|---|---|---|---|
| Historical Comparisons | |||||||||||||||||||||||||
| Stocks billion cubic feet (Bcf) | Year ago (10/05/17) | 5-year average (2013-17) | |||||||||||||||||||||||
| Region | 10/05/18 | 09/28/18 | net change | implied flow | Bcf | % change | Bcf | % change | |||||||||||||||||
| East | 790 | 763 | 27 | 27 | 881 | -10.3 | 869 | -9.1 | |||||||||||||||||
| Midwest | 871 | 836 | 35 | 35 | 1,019 | -14.5 | 1,004 | -13.2 | |||||||||||||||||
| Mountain | 180 | 177 | 3 | 3 | 223 | -19.3 | 210 | -14.3 | |||||||||||||||||
| Pacific | 262 | 262 | 0 | 0 | 314 | -16.6 | 340 | -22.9 | |||||||||||||||||
| South Central | 854 | 829 | 25 | 25 | 1,146 | -25.5 | 1,139 | -25.0 | |||||||||||||||||
| Salt | 191 | 181 | 10 | 10 | 309 | -38.2 | 300 | -36.3 | |||||||||||||||||
| Nonsalt | 663 | 648 | 15 | 15 | 836 | -20.7 | 840 | -21.1 | |||||||||||||||||
| Total | 2,956 | 2,866 | 90 | 90 | 3,583 | -17.5 | 3,563 | -17 | |||||||||||||||||
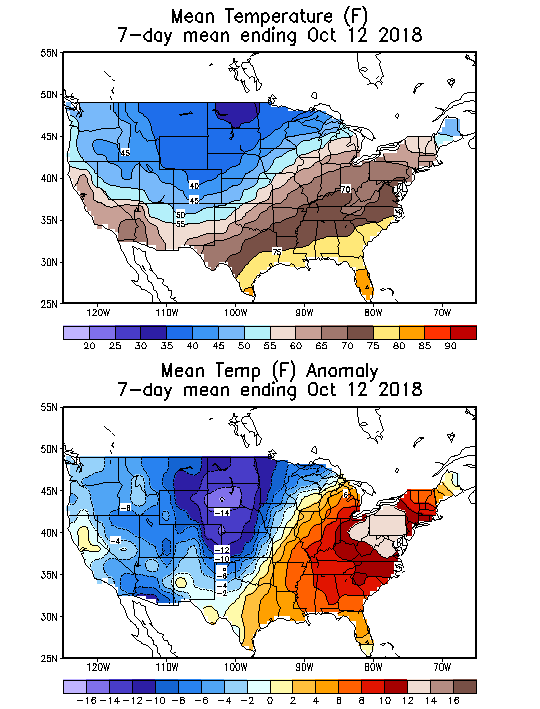
These are the temperatures that were used for last weeks report.
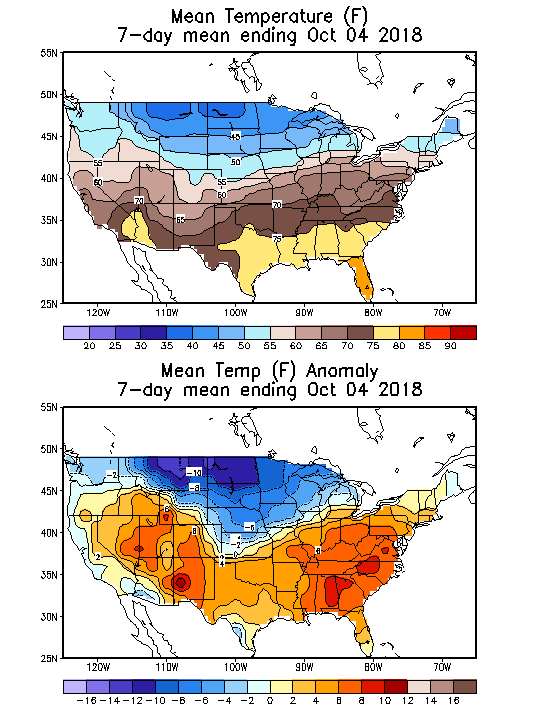
These were the temperatures that will be used for this Thursday's EIA report. Take a good look at that map. You don't see anomaly maps with such extremes in magnitude too often.
Natural Gas price charts
We finally broke out above $3!
A lot of volatility with the low storage. Prices have been gyrating up and down with the latest weather forecast............Monday was up as cold was added to the extended forecast.........lasting into early November.
Wednesday's forecast added more cold.....another spike higher resulted. Expectations for tHe EIA report out Thursday will get some weight in traders minds between now and then.
| Natural gas 3 months |
Naturalgas 1 year below
Naturalgas 5 years below
| Naturalgas10years below
|
12Z GFS came out even colder than the previous cold GFS operational models.
gfs_namer_300_200_wnd_ht | gfs_namer_300_500_vort_ht |
gfs_namer_300_1000_500_thick | gfs_namer_300_850_temp_ht |
Closing comment from Natural Gas Intelligence:
Colder Start to November Leads to Late-Session Rally for Natural Gas Futures; Spot Gas Up as Front Stalls