November Natural Gas expires today. Wild price spikes have been known to happen!
For the weather that affects residential heating demand and natural gas prices, go here:
https://www.marketforum.com/forum/topic/16145/
For the previous discussions on natural gas, including 3 recent articles that have extensive fundamental information which will be key to pricing this upcoming Winter, go here:
From Natural Gas Intelligence earlier this morning:
Warmer Forecast, Surging Production as Natural Gas Futures Called Lower
8:56 AM
November natural gas futures, set to expire Monday, were down 6.5 cents to $3.120/MMBtu shortly before 9 a.m. ET Monday, with forecasts producing warmer near- and medium-term trends over the weekend as the latest production numbers continue to climb. The December contract was trading 6.6 cents lower at $3.159
Storage is Very Low for this time of year!!
Storage is below the bottom of the previous 5 year range and still around 600 bcf below last year at this time!
This is why the temperature forecast matters....in the Summer/cooling season and now in the early part of the key Winter/heating season............which is looking milder early on Monday.

EIA injection on Thursday was +58 bcf but with 5 bcf reclassified, it was actually 63 bcf. This was extremely bearish!
| Working gas in underground storage, Lower 48 states Summary textCSVJSN | |||||||||||||||||||||||||
|---|---|---|---|---|---|---|---|---|---|---|---|---|---|---|---|---|---|---|---|---|---|---|---|---|---|
| Historical Comparisons | |||||||||||||||||||||||||
| Stocks billion cubic feet (Bcf) | Year ago (10/19/17) | 5-year average (2013-17) | |||||||||||||||||||||||
| Region | 10/19/18 | 10/12/18 | net change | implied flow | Bcf | % change | Bcf | % change | |||||||||||||||||
| East | 825 | 812 | 13 | 13 | 913 | -9.6 | 903 | -8.6 | |||||||||||||||||
| Midwest | 934 | 908 | 26 | 26 | 1,078 | -13.4 | 1,058 | -11.7 | |||||||||||||||||
| Mountain | 177 | 177 | 0 | 0 | 224 | -21.0 | 215 | -17.7 | |||||||||||||||||
| Pacific | 262 | 264 | -2 | -2 | 315 | -16.8 | 346 | -24.3 | |||||||||||||||||
| South Central | 896 | C | 877 | 19 | 24 | C | 1,171 | -23.5 | 1,196 | -25.1 | |||||||||||||||
| Salt | 218 | 203 | 15 | 15 | 311 | -29.9 | 324 | -32.7 | |||||||||||||||||
| Nonsalt | 678 | C | 673 | 5 | 10 | C | 859 | -21.1 | 872 | -22.2 | |||||||||||||||
| Total | 3,095 | C | 3,037 | 58 | 63 | C | 3,701 | -16.4 | 3,719 | -16.8 | |||||||||||||||
C=Reclassification | |||||||||||||||||||||||||
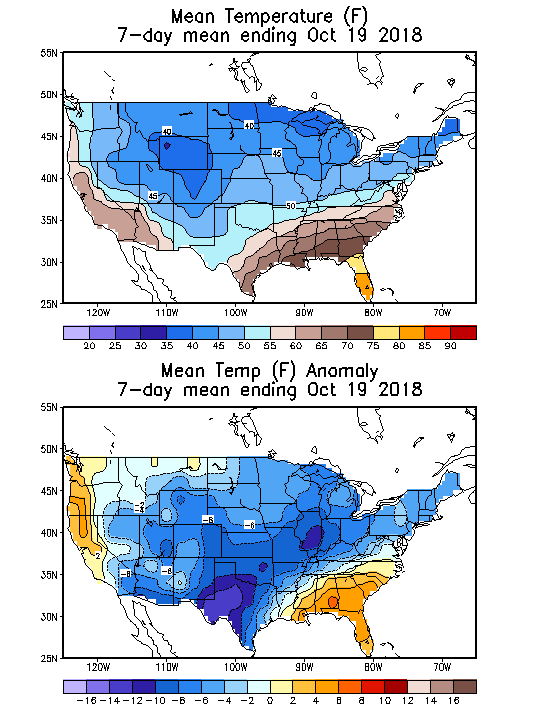
Here's the temperature map for this last EIA reporting period.
Huge cold anomalies and residential heating demand.............which should have reduced the injection by more.........except that massive supply is hitting the market finally.
http://www.cpc.ncep.noaa.gov/products/tanal/temp_analyses.php
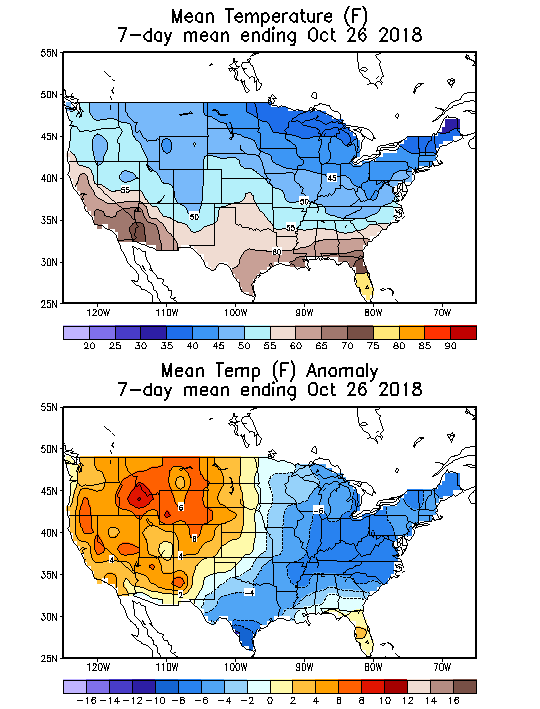
Here's the temperature map for the next EIA report.
Released on Thursday at 9:30am. A huge -6 deg. C anomaly in a very high population area has me guessing that the next injection will be smaller than the last one.
Maybe +48 bcf?? This is still bearish for the amount of cold.
Any other guesses?
Natural Gas price charts
We finally broke out above $3! The weather will need to be cold in November to stay above $3.
A lot of volatility with the low storage. Prices have been gyrating up and down with the latest weather forecast.
Todays forecast is milder than the one we had on Friday but November expires........so watch out. We took out last weeks lows this morning but came right back above that.
Seasonals turn strongly negative here.......if the extended forecasts turn mild, look out below.........but low storage +very cold = higher price potential.
| Natural gas 3 months |
Previous great stuff:

Commodities, medium-term horizon, trader
MarketplaceNatural Gas Fundamentals
Total demand for American natural gas is up 13.0% y-o-y to 77.6 bcf per day.
Total natural gas supply is up 13.0% y-o-y to 94.0 bcf per day.
Dry gas production has reached a new all-time high and so do the exports into Mexico.
We currently expect EIA to report an injection of 53 bcf next week.
This report covers the week ending October 26, 2018. Daily data for October 20 to October 25 is estimated. Daily data for October 26 is forecast.
United States has produced some 7,872 bcf of natural gas in Q3 2018 (+13.95 y-o-y) and imported a total of 718 bcf (-1.40% y-o-y).
Drilling activity is at three-year high and the inventory of DUCs continues to decline, meaning that production is likely to grow further.
According to our calculations, total supply in Q4 will amount to 8,749 bcf or 95.1 bcf/d (+9.6% y-o-y).
Natural gas producers love current prices. Thank you, weather!

Research analyst, commodities, oil & gas
https://seekingalpha.com/article/4213377-perfect-storm-can-save-natural-gas
Temporary factors are masking a grossly oversupplied natural gas market.
Production growth continues to exceed expectations.
Weather and temporary factors are the reasons inventories are low.
Gas prices will not hold up without an extremely cold winter.
But all sources of demand don't come close to absorbing the current (and projected) supply.
Given time, we would gradually refill the storage imbalance and face the opposite problem. But could current low inventories and the possibility of a cold winter result in a genuine shortage, with price spikes and panic?
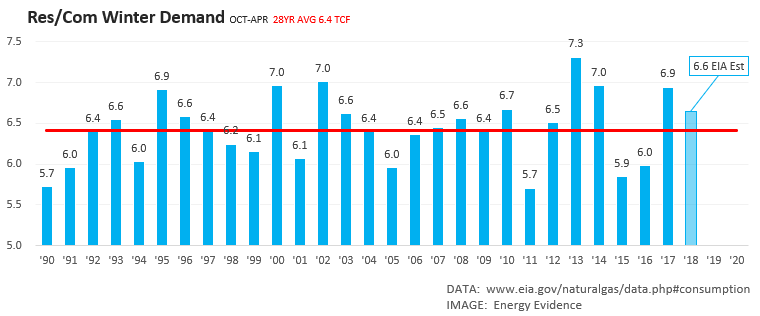
Right now EIA projects winter heating demand at about 6.6 TCF, and end of season inventories at 1.37 TCF on March 31st. Heating demand over the last 28 winters ranged from 5.7 TCF to 7.3 TCF, averaging 6.4. Here's the history from EIA:
A rough estimate (since cold weather affects other demand and supply variables) would suggest there's about a 10% chance that the heating demand anomaly would exceed +500 BCF over the 7-month period. That could put end-of-winter inventories near 800 BCF. That's comparable to 2014 lows, when Henry Hub Spot averaged $6.20 in February and $5.06 in March, and $4.54 for the calendar year.
With current inventories so far below normal, the market may price in a risk of a gas shortage until the statistical probability falls a bit further. In my estimation, this risk is eliminated if/when we experience near-normal weather through December (under 40 BCFD of heating demand). Warm weather in the interim would accelerate that timeline.
Re: Re: Re: Re: Re: Weather Monday
By metmike - Oct. 29, 2018, 4:11 p.m.
12z operational European model day 10
A brief cold shot in early week 2 caused the ngz, now the front month to just touch new highs just prior to 2pm when it came out.
Closing comments from Natural Gas Intelligence:
More in Daily GPI
Nymex November Expires Flat After Buying Spree Off Technical Support; Spot Gas Mostly Lower
5:53 PM
For the second trading day in a row, natural gas futures bounced off key technical support, limiting losses despite a new production record established over the past weekend and warmer weather through the medium range. The Nymex November gas futures contract ultimately expired Monday at $3.185, flat on the day, despite shedding as much as 8.5 cents during the session. December, which will take over the prompt-month position on Tuesday, fell 2.7 cents to $3.198
What do you have Larry?