48bcf and neither the bulls or the bears seem impressed.
Thanks for starting things off today Jim!
For weather affecting the natural gas, residential heating demand, go here:
https://www.marketforum.com/forum/topic/16420/
I have less cold risk in my forecast today.
From Natural Gas Intelligence earlier:
Forecasts Maintaining November Cold as December Natural Gas Called Higher
8:59 AM
December natural gas futures were trading 4.1 cents higher at $3.302 shortly before 9 a.m. ET Thursday as forecasters pointed to overnight guidance that continued to show a stretch of above-average heating demand for the second week of November.
For the previous discussions on natural gas, including 3 recent articles that have extensive fundamental information which will be key to pricing this upcoming Winter, go here:
https://www.marketforum.com/forum/topic/15990/
and here:
Storage is Very Low for this time of year!!
Storage is below the bottom of the previous 5 year range and still around 600 bcf below last year at this time!
This is why the temperature forecast matters....in the Summer/cooling season and now in the early part of the key Winter/heating season............which is looking milder early on Monday.

Looks like the market agrees with you Mike. The bears are pressing the downside.
EIA + 48 bcf.........nuetral?
| Working gas in underground storage, Lower 48 states Summary text CSV JSN | |||||||||||||||||||||||||
|---|---|---|---|---|---|---|---|---|---|---|---|---|---|---|---|---|---|---|---|---|---|---|---|---|---|
| Historical Comparisons | |||||||||||||||||||||||||
| Stocks billion cubic feet (Bcf) | Year ago (10/26/17) | 5-year average (2013-17) | |||||||||||||||||||||||
| Region | 10/26/18 | 10/19/18 | net change | implied flow | Bcf | % change | Bcf | % change | |||||||||||||||||
| East | 826 | 825 | 1 | 1 | 924 | -10.6 | 913 | -9.5 | |||||||||||||||||
| Midwest | 956 | 934 | 22 | 22 | 1,103 | -13.3 | 1,078 | -11.3 | |||||||||||||||||
| Mountain | 180 | 177 | 3 | 3 | 226 | -20.4 | 218 | -17.4 | |||||||||||||||||
| Pacific | 262 | 262 | 0 | 0 | 317 | -17.4 | 349 | -24.9 | |||||||||||||||||
| South Central | 919 | 896 | 23 | 23 | 1,195 | -23.1 | 1,223 | -24.9 | |||||||||||||||||
| Salt | 234 | 218 | 16 | 16 | 322 | -27.3 | 336 | -30.4 | |||||||||||||||||
| Nonsalt | 686 | 678 | 8 | 8 | 872 | -21.3 | 887 | -22.7 | |||||||||||||||||
| Total | 3,143 | 3,095 | 48 | 48 | 3,766 | -16.5 | 3,781 | -16.9 | |||||||||||||||||
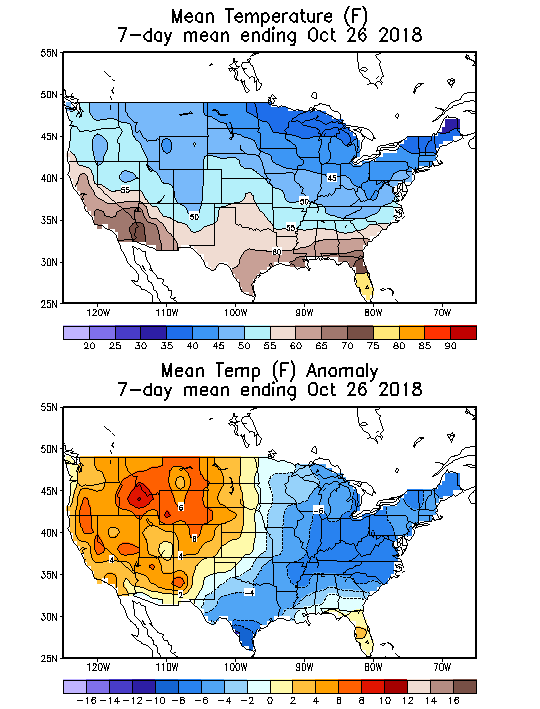
Here's the temperature map for todays EIA report.
From earlier this week:
A huge -6 deg. C anomaly in a very high population area has me guessing that the next injection will be smaller than the last one.
Maybe +48 bcf?? This is still bearish for the amount of cold.
Any other guesses?
Larry guessed +45 bcf.
From Natural Gas Intelligence:
Natural Gas Futures Fall as Market Mulls November Temps; FERC Unleashes Rover Laterals
5:49 PM
Natural gas futures slid a few cents Thursday as weather data provided little certainty on temperature trends past the second week of November, while government storage data that missed to the bullish side of most estimates failed to impress.