For the weather affecting Natural Gas prices from increased or decreased residential heating demand go here:
From Natural Gas Intelligence earlier this morning:
December Natural Gas Called Lower as Forecasts Seen Mixed Overnight
Storage is Very Low for this time of year!!
Storage is below the bottom of the previous 5 year range and still around 600 bcf below last year at this time!
This is why the temperature forecast matters....in the Summer/cooling season and now in the early part of the key Winter/heating season............which is looking milder early on Monday.

EIA + 48 bcf last Thursday.........neutral?
| Working gas in underground storage, Lower 48 states Summary textCSVJSN | |||||||||||||||||||||||||
|---|---|---|---|---|---|---|---|---|---|---|---|---|---|---|---|---|---|---|---|---|---|---|---|---|---|
| Historical Comparisons | |||||||||||||||||||||||||
| Stocks billion cubic feet (Bcf) | Year ago (10/26/17) | 5-year average (2013-17) | |||||||||||||||||||||||
| Region | 10/26/18 | 10/19/18 | net change | implied flow | Bcf | % change | Bcf | % change | |||||||||||||||||
| East | 826 | 825 | 1 | 1 | 924 | -10.6 | 913 | -9.5 | |||||||||||||||||
| Midwest | 956 | 934 | 22 | 22 | 1,103 | -13.3 | 1,078 | -11.3 | |||||||||||||||||
| Mountain | 180 | 177 | 3 | 3 | 226 | -20.4 | 218 | -17.4 | |||||||||||||||||
| Pacific | 262 | 262 | 0 | 0 | 317 | -17.4 | 349 | -24.9 | |||||||||||||||||
| South Central | 919 | 896 | 23 | 23 | 1,195 | -23.1 | 1,223 | -24.9 | |||||||||||||||||
| Salt | 234 | 218 | 16 | 16 | 322 | -27.3 | 336 | -30.4 | |||||||||||||||||
| Nonsalt | 686 | 678 | 8 | 8 | 872 | -21.3 | 887 | -22.7 | |||||||||||||||||
| Total | 3,143 | 3,095 | 48 | 48 | 3,766 | -16.5 | 3,781 | -16.9 | |||||||||||||||||
Here's the temperature map reporting period for last Thursdays EIA report.
A huge -6 deg. C anomaly in a very high population area has me guessing that the next injection will be smaller than the last one.
Maybe +48 bcf?? This is still bearish for the amount of cold.
Any other guesses?
Larry guessed +45 bcf.
Here's the temperature map for the 7 days going into this week's EIA report.
It's warmer than the previous week, so the injection WILL be larger. Any guesses?
Repeating the frigid Winter of 5 years ago, gets storage to precariously low levels and the price spikes to the highest in over a decade.
Repeating the mild Winters of 2 and 3 years ago and storage catches all the way up with last year and prices get buried into the 2's.
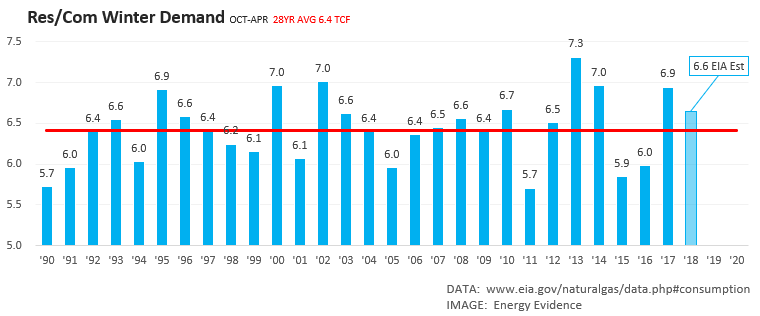
Right now EIA projects winter heating demand at about 6.6 TCF, and end of season inventories at 1.37 TCF on March 31st. Heating demand over the last 28 winters ranged from 5.7 TCF to 7.3 TCF, averaging 6.4. Here's the history from EIA: