
Hello January 29th! Share your blessings with somebody today. Seriously, don't just think about it for a moment......do it now.
Bitter cold blast for several days...................Hello polar vortex! Then quick moderation!
This is what the Polar Vortex looks like right now, displaced many thousands of miles farther south than its usual position in the high latitudes:
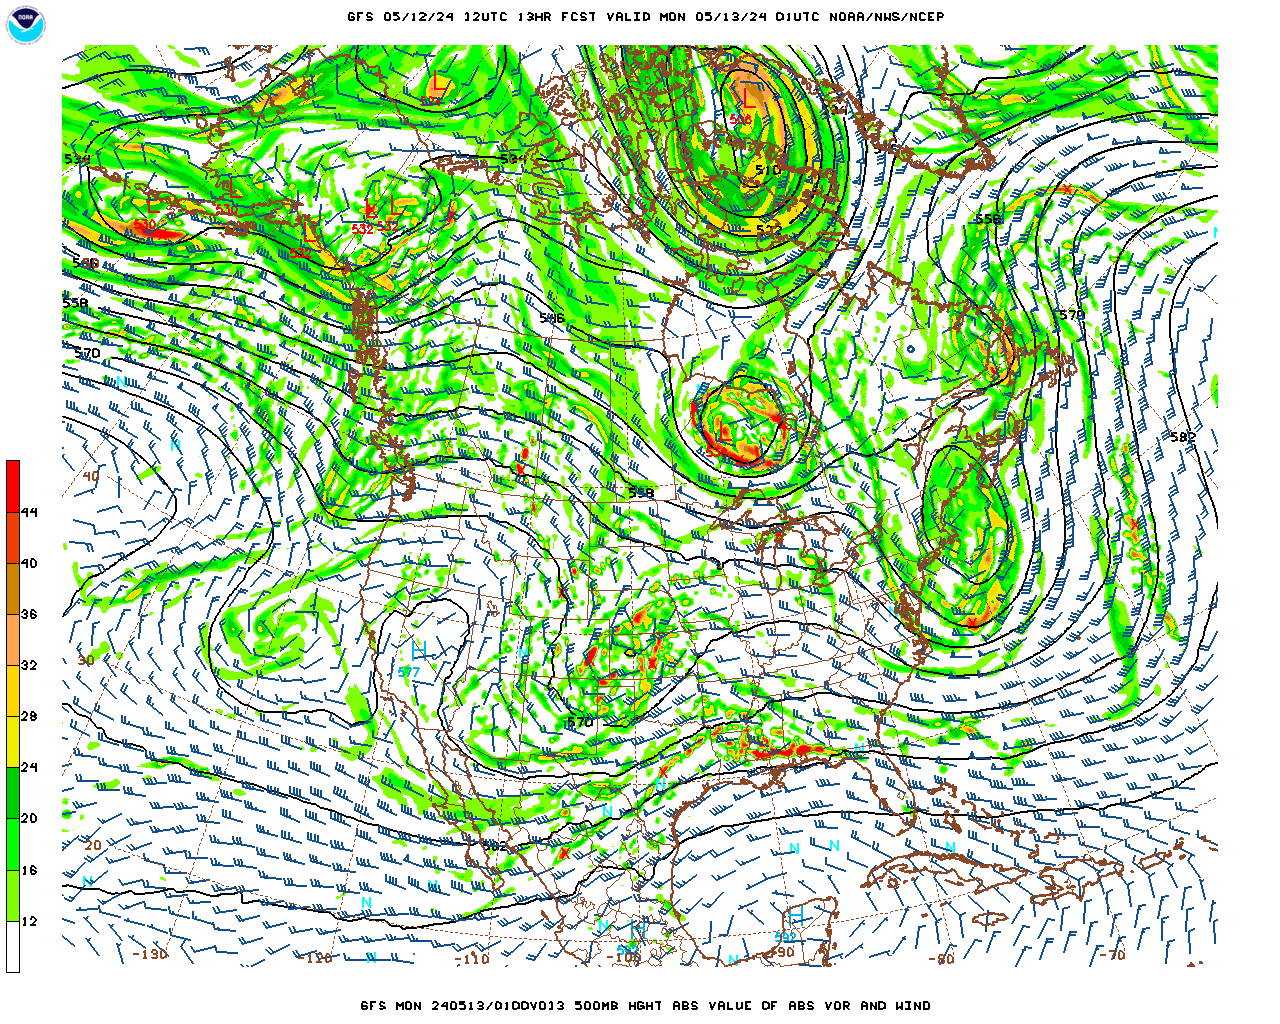
Scroll down and enjoy the latest comprehensive weather to the max.
Here are the latest hazards across the country. More cold and snow-Who will get the most snow?
Purple/Pink/blue on land is cold/Winter weather. Brown is wind, Green is flooding. Gray is fog. Reddish is a red flag advisory.
Go to the link below, then hit the location/county on the map for details.
https://www.spc.noaa.gov/ Go to "hazards"


Current Jet Stream

Winter Weather
https://www.wpc.ncep.noaa.gov/wwd/winter_wx.shtml
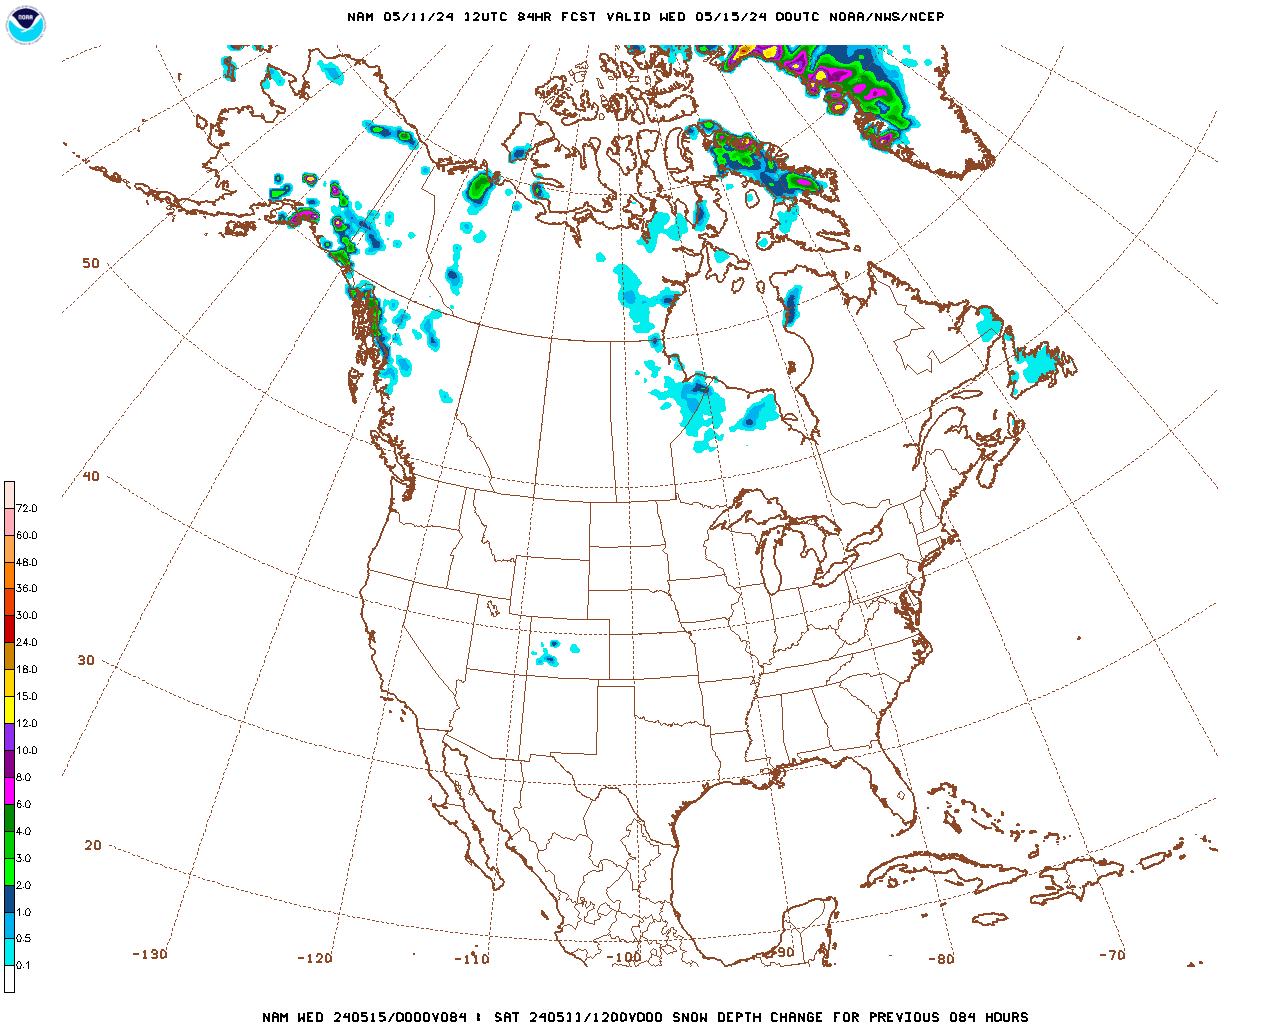
Snowfall the next 3 days:
Forecast Hour: 084
Image URL: http://mag.ncep.noaa.gov/data/nam/12/nam_namer_084_snodpth_chng.gif
WOOOOOOW!!!!!!!!
| Low Temperatures Tomorrow Morning |

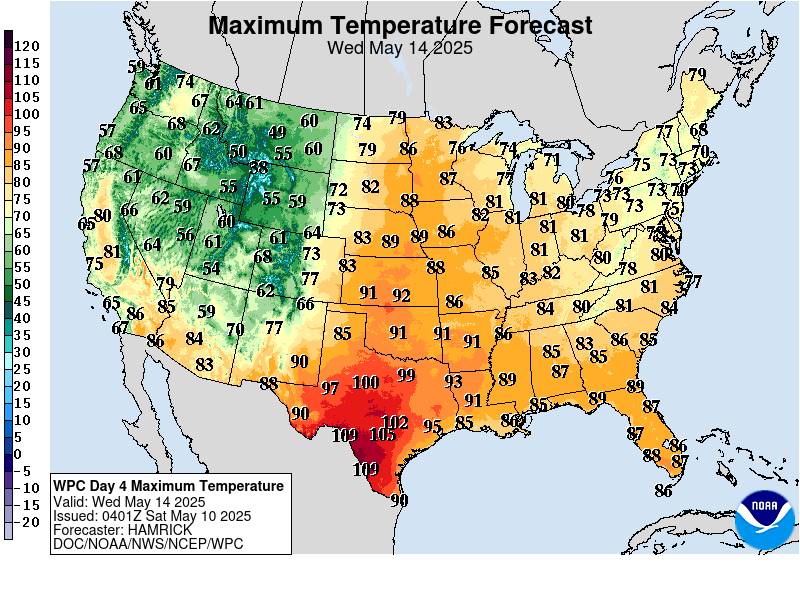
High Temperatures
Intense cold NorthCentral on Tuesday/Wednesday!


Highs for days 3-7:
RAPID RETREAT of the cold blast late this week! Above normal by the weekend!



How do these days 3-7 temperatures compare to average at this time of year?
Amazing recovery from the bitter cold to milder temperatures.
https://www.wpc.ncep.noaa.gov/medr/medr_mean.shtml
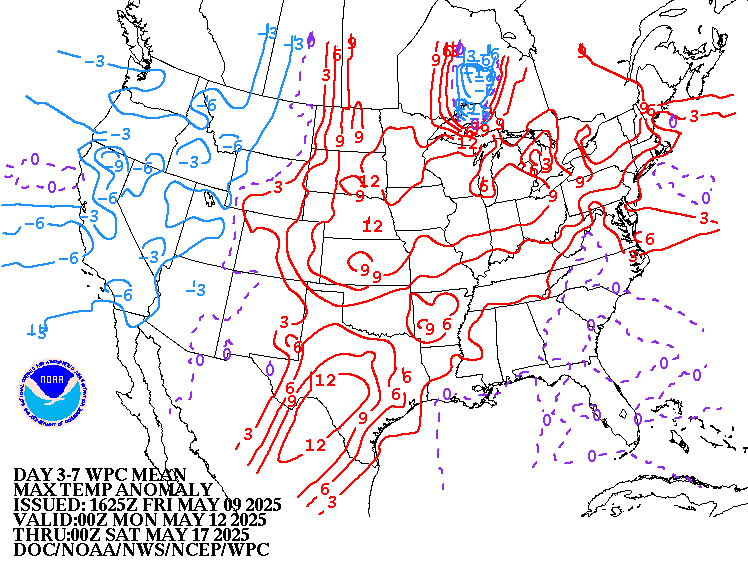
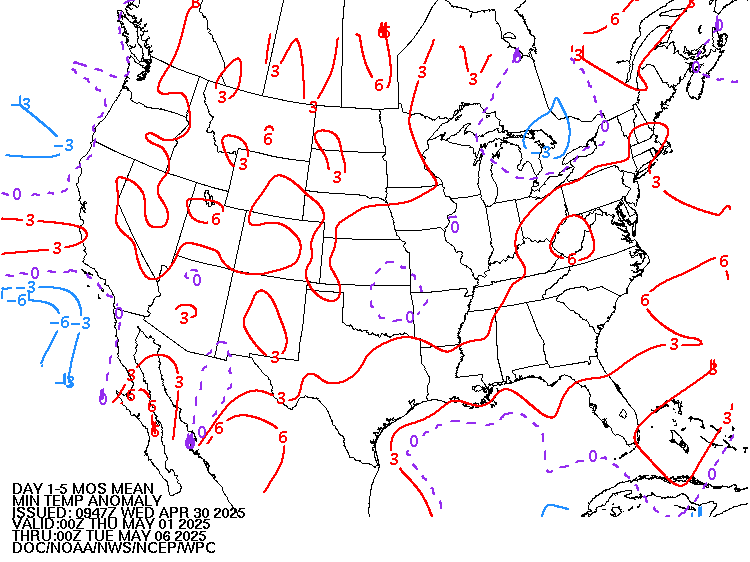
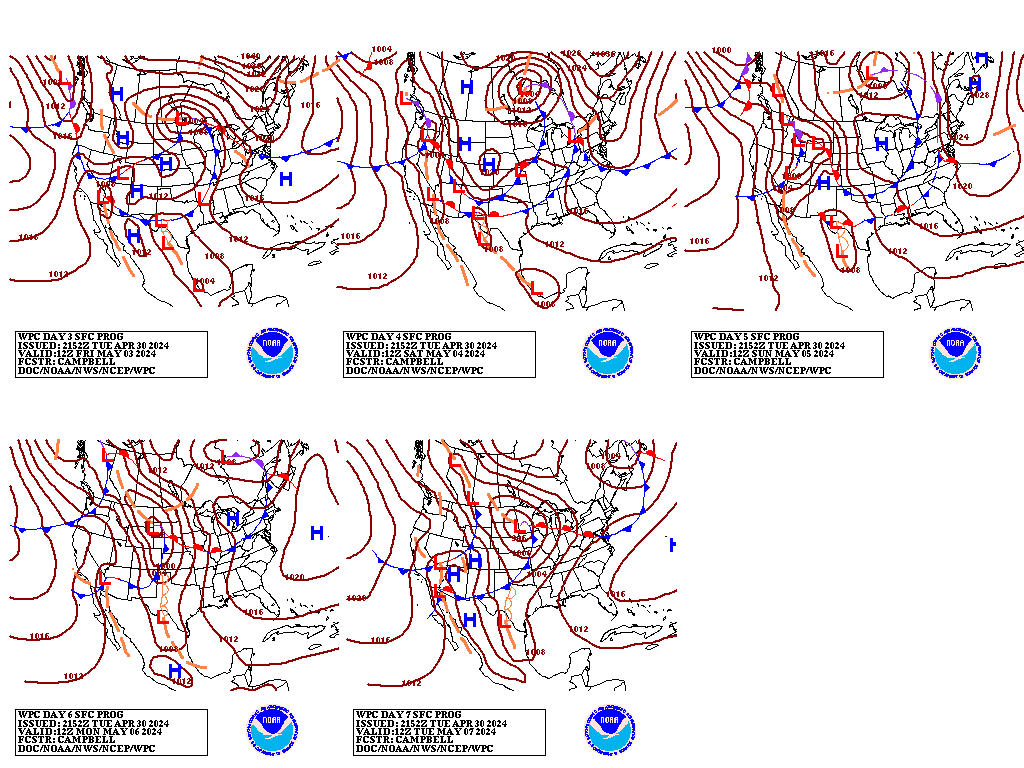
Weather maps for days 3-7 below:
Southern stream takes over with much milder air dominating(turning wet next week)..............northern stream still has some less intense cold(compared to this current one) to deliver with a couple of cold fronts.
Liquid equivalent precip forecasts for the next 7 days are below.
Fairly dry this week.............turning much wetter next week.
.
Day 1 below:
http://www.wpc.ncep.noaa.gov/qpf/fill_94qwbg.gif?1526306199054

Day 2 below:
http://www.wpc.ncep.noaa.gov/qpf/fill_98qwbg.gif?1528293750112

Day 3 below
http://www.wpc.ncep.noaa.gov/qpf/fill_99qwbg.gif?1528293842764

Days 4-5 below:
http://www.wpc.ncep.noaa.gov/qpf/95ep48iwbg_fill.gif?1526306162

Days 6-7 below:
http://www.wpc.ncep.noaa.gov/qpf/97ep48iwbg_fill.gif?1526306162

7 Day Total precipitation below:
http://www.wpc.ncep.noaa.govcdx /qpf/p168i.gif?1530796126

Current Dew Points
Super Duper Incredibly dry Upper Midwest........in the record cold air.

Latest radar loop
http://www.nws.noaa.gov/radar_tab.php

| Full resolution version loop (3400x1700 pixels - 2.2mb) |

Go to: Most Recent Image
Precipitation the past 24 hours
![]()
You can go to this link to see precipitation totals from recent time periods:
https://water.weather.gov/precip/
Go to precipitation, then scroll down to pick a time frame. Hit states to get the borders to see locations better. Under products, you can hit "observed" or "Percent of normal"
+++++++++++++++++++++++++++++++++++++++++++++++
Soil moisture anomaly:
Still wet on this particular metric in an enormous area.

+++++++++++++++++++++++++++++++++++++
Precipitation compared to average for the last 7, 14, 30 and 60 days.
Usually not updated for previous day until late the next day.
https://www.atmos.illinois.edu/~snodgrss/Ag_Wx.html


The top map is the Canadian ensemble average, the maps below are the individual members that make up the average
+++++++++++++++++++++++++++++++++++++++++
Each member is like the parent, Canadian model operational model.......with a slight tweek/variation in parameters. Since we know the equations to represent the physics of the atmosphere in the models are not perfect, its useful to vary some of the equations that are uncertain(can make a difference) to see if it effects the outcome and how.
The average of all these variations(ensembles) often yields a better tool for forecasting. It's always more consistent. The individual operational model, like each individual ensemble member can vary greatly from run to run.........and represent an extreme end of the spectrum at times. The ensemble average of all the members, because it averages the extremes.............from opposite ends of the spectrum.........changes much less from run to run.
End of week 2....................0z ensembles from Tuesday
Analysis starting from a week ago, ending with today:
Last Monday: 12z run: Milder solutions are gaining favor, colder ones losing out but still possible. Entry point of the cold looks farther west than it did on last weeks solutions. Yesterdays colder 12z model has been the exception to this trend the last 2 days.
Tuesday: 12z run: Though most of the recent solutions have been milder, more undercutting/Pacific flow and less northern stream, this last one is slightly colder again.
Wednesday: Same milder theme as previous solutions late in week 2, with the exception of yesterdays 12z run.
Thursday: For the first time in awhile, the 0Z forecast is colder. The ridge west/trough east couplet has magnified again, though shifted to the west, so the entry point of the cold would be a bit farther to the west.
Friday: This particular model is colder yet. Stronger ridge west/trough east solution on the average/mean. Some solutions have a piece of the polar vortex dropping pretty far south again.
Saturday: The subtle shift west in the large scale features noted earlier in the week is becoming more apparent with time. This, as upper level ridging tries to build in the southeast. This would warm things up in the east and cool things down in the west vs the recent pattern......and crank up the moisture flow.
Sunday: Same as previous theme. More ridge building in the Southeast today.
Monday: Ridge building continues in the southeast. Very pronouced/obvious on the mean today. However, the northern stream is still exerting significant influence out of Canada and will be battling this southern stream feature late in week 2.
Tuesday: The showdown continues between the building southern stream upper level ridge in the Southeast and the Northern stream. Today, on this model, at 2 weeks, on some solutions, the northern stream has a renewed surge into the northern tier of states. Enormous uncertainty.............not on the main players but on the strength of them and especially on the weather in the battle zone and timing of weather features that they cause/location of their dominance at distant times frames like this.
360h GZ 500 forecast valid on Feb 13, 2019 00 UTC
0Z GFS Ensembles at 2 weeks:
Analysis, starting with a week ago:
Last Sunday: At the end of week 2 we have a battle between the pattern displayed over the past 10 days............large scale, full latitude ridge west/trough east couplet in North America with the polar vortex displaced unusually far south and an attempt for Pacific flow to undercut that northern stream dominate flow. The northern stream is still winning here.
Monday: The northern stream dominated solutions are steadily losing ground, although the cold on this model is still aimed towards the Northeast on several solutions.
Tuesday: The northern stream continues to be deflected out of the US picture by many members.................but still several that disagree.
Wednesday: More widespread agreement on milder as week 2 progresses.
Thursday: Much colder! Ridge west/trough east and northern stream trying to flex its muscles again.
Friday: Still pretty cold and northern stream dominance from Canada to northern tier but some solutions battle this with a southern stream. Possible upper level ridge in the far south/Gulf of Mexico? The 06z run that came 6 hours after this, very early this morning didn't look nearly as cold to me.
Saturday: Now the solutions with a southern stream and upper level ridge in the southeast are growing. This would warm it up and pump moisture northward. But the northern stream is battling to remain strong on several but getting smaller solutions and it effects mostly the northern tier.
Sunday: Ridge building in the Southeast........battling still, potentially active northern stream cold waves farther north/northwest.
Monday: Southern stream upper level ridge in the Southeast......warm and moist air on its back side. Northern stream almost out of the picture on this model vs the Canadian model thats more bullish the northern stream. However, the 06z run of the GFS ensembles was colder with that stream aimed into the Upper Midwest/Northeast.
Tuesday: Welcome back Northern Stream! Huge, renewed surge of the northern stream. On some solutions, another fairly far south incursion of the Polar Vortex(or at least an extension of it south) but nothing like this current event......except for the extremes.

Latest, updated graph/forecast for AO and NAO here, including an explanation of how to interpret them.
Previous analysis, with the latest day at the bottom for late week 2 period.
Last Monday: AO continues solidly negative, good for cold air movement south. NAO around zero is neutral. PNA has continued to drop and is more negative again today. More negative than its been in a long time in fact. This suggests a potential pattern change with less ridging west to more troughing there. This would change the jet stream in the US and could deflect the northern stream back towards Canada in the East.
Tuesday: Similar to yesterday. AO solidly negative, good for cold air moving south but the NAO is slighly positive and PNA is a bit negative which will make it tougher for cold to get into the US.
Wednesday: AO less negative. NAO more positive, PNA more negative. All make a case for the February forecast to be morphing milder.
Thursday: AO strongly negative, favorable for cold air delivery. PNA shifts more positive, more favorable for cold to continue south, especially compared to the last few days but NAO is positive, which is less favorable for cold in the East. So the entry point of cold late in week 2 is in question?
Friday: AO is at the bottom of the graph, extremely negative for some solutions, others almost at zero...........tremendous spread. Very favorable for cold to be flushed south from high to mid latitudes. NAO a tad positive so not especially favorable for cold air delivery southward in the East. PNA is positive and favorable for cold going south but not decisive and there is alot of spread and uncertainty.
Saturday: The AO is light years higher vs yesterday........bounces back up in week 2 instead of crashing lower.....towards zero near the end of week 2. This greatly reduces the risk of extreme cold in February. The NAO is a bit positive still, not especially favorable for cold to push south and the PNA is close to neutral.
PM comment: The sharp changes like this often happen when there is a pattern change coming. It may feature the southern stream building an upper level ridge in the Southeast. The strength of this feature battling with the northern stream are some key elements to monitor on model solutions. At this point, it looks like it will cause warming in the east(where there is much more residential heating demand potential and cooling in the west).
Sunday: AO negative but not extreme as a few days ago, more like yesterday(so cold can travel south thru Canada). NAO a bit positive,. PNA a bit negative, not especially great to push cold very far south into the US...........but it can still get to the Northern Tier.
Monday: AO moderately negative and about the same as Sunday. This is favorable for cold to travel south thru Canada. NAO around zero. PNA is negative which will act to sort of repel cold from penetrating deeply into the US(limiting it to northern states.
Tuesday: AO.........the spread doesn't get wider than this. From extremely low to extremely high. This tells us how much uncertainty there will be, especially with regards to the influence of the northern stream in week 2. NAO is a bit positive and PNA slightly negative which will provide some resistance to cold trying to penetrate deeply south into the US after tracking south of the Canadian border.
The link below, now has the PNA index added at the bottom:
National Weather Service 6-10 day, 8-14 day outlooks.
Updated early this afternoon:
Tuesday: Guidance continues milder than last Friday for the 4th day in a row...for the southeast half of the country. You can see the battle between warmth there from the southern stream upper level ridge and the cold in the Northwest half from the northern stream and the retrograded upper level pattern in Canada.
Big battle between these features and a lot of precip!
Temperature Probability | |
Precipitation Probability | |
| the 8-14 day outlooks ArchivesAnalogsLines-Only FormatGIS Data | |
Temperature Probability | |
 | |
Previous comments:
Re: Re: Re: Re: Weather Friday
By tjc - Jan. 25, 2019, 1:36 p.m.
Any 'scheduled' weather updates between now and 4pm?
Or any 'routine' time for private forecasters to so inform their clients?
+++++++++++++++++++++++++++++++++++++++++++++++++++++++++
Re: Re: Re: Re: Re: Weather Friday
By metmike - Jan. 25, 2019, 3:10 p.m.
Hi TJC,
12z models are all over the place.
GFS operational had the upper trough way west and ridging warmth in the East with much less HDD's
GFS ensembles had more of the ridge west trough east but not aplified and not that cold.
Euro and its ensembles were much colder and why we bounced since then
Canadian ensembles are deeping the upper trough and northern stream in the Midwest, maybe some ridging along the East Coast.
To me, it looks like the models are may be morphing into a pattern with the upper trough backing up west a bit and possible ridging in the far south and east.
This near term very extreme cold in the Midwest is probably helping to support ng here.
I have no idea where we might open on Sunday Night. The market is acting like its setting up for a gap higher again but it may be traders are trading fear of a gap higher more than anything.
WIth the extreme -AO I wouldn't want to be short here over the weekend.
+++++++++++++++++++++++++++++++++
By tjc - Jan. 25, 2019, 3:21 p.m.
Much appreciated for the detailed up to minute report.
Had order in and once again missed by two ticks.
Going to give it another hour
+++++++++++++++++++++++++++++++++++++
By metmike - Jan. 25, 2019, 7:59 p.m.
The milder 18z operational GFS and ensembles would have me a bit nervous IF I was long(and probably considering getting short if we were trading) but the maps will look completely different on Sunday.
So, at the moment it looks smart to have covered your long for a small profit!
++++++++++++++++++++++++++++++++++++++++++++++++++++++++++++
Re: Re: Re: Re: Re: Re: Re: Re: Weather Friday
By metmike - Jan. 25, 2019, 8:01 p.m.
Weeks 3 and 4 guess-cast (-:
| Please provide comments using the online survey. | ||
Temperature Probability | Precipitation Probability (Experimental)  | |
++++++++++++++++++++++++++++++
Re: Re: Re: Re: Re: Weather Saturday
By bcb - Jan. 26, 2019, 10 a.m.
The short version / freakn cold until further notice
++++++++++++++++++++++++++++++++
Re: Re: Re: Re: Re: Re: Weather Saturday
metmike-jan 26, 2019.
Saturday afternoon maps continue with the trend since Friday afternoon.....MILDER!!
++++++++++++++++++++++++++++++++++++++++++
By WxFollower - Jan. 26, 2019, 6:32 p.m.
12Z Sat vs 12Z Fri in HDDs:
GEFS: no change 1/27-2/9
EPS: -30 for 1/27-2/7!
12Z Fri vs 0Z Fri
GEFS: -4
EPS: +10
0Z Fri vs 12Z Thu
GEFS: -11
EPS: -14
So, this gives us the following for 12Z Sat vs 12Z Thu:
GEFS: -15
EPS: -34
So, this is consistent with a significant warming trend the last 48 hours for the 2 week forecasting period.
+++++++++++++++++++++++++++++++++++++++++++++++
By metmike - Jan. 26, 2019, 7:03 p.m.
Thanks Larry!
Good summary of the salient points here for natural gas.
One item that really jumped out this morning was the huge change in the ENSM forecasts for the AO index vs the last 2 days in week 2.
I'll copy the last 4 days of comments/my discussion(I added some just now):
Wednesday: AO less negative. NAO more positive, PNA more negative. All make a case for the February forecast to be morphing milder.
Thursday: AO strongly negative, favorable for cold air delivery. PNA shifts more positive, more favorable for cold to continue south, especially compared to the last few days but NAO is positive, which is less favorable for cold in the East. So the entry point of cold late in week 2 is in question?
Friday: AO is at the bottom of the graph, extremely negative for some solutions, others almost at zero...........tremendous spread. Very favorable for cold to be flushed south from high to mid latitudes. NAO a tad positive so not especially favorable for cold air delivery southward in the East. PNA is positive and favorable for cold going south but not decisive and there is alot of spread and uncertainty.
Saturday: The AO is light years higher vs yesterday........bounces back up in week 2 instead of crashing lower.....towards zero near the end of week 2. This greatly reduces the risk of extreme cold in February. The NAO is a bit positive still, not especially favorable for cold to push south and the PNA is close to neutral.
PM comment: The sharp changes like this often happen when there is a pattern change coming. It may feature the southern stream building an upper level ridge in the Southeast. The strength of this feature battling with the northern stream are some key elements to monitor on model solutions. At this point, it looks like it will cause warming in the east(where there is much more residential heating demand potential and cooling in the west).
++++++++++++++++++++++++++++++++++++
By WxFollower - Jan. 26, 2019, 7:33 p.m.
Thanks, Mike. But will the models go the other way now. They've been awfully jumpy. A 48 hour warming trend can certainly reverse to colder on a dime, especially in Feb in a weak El Nino.
++++++++++++++++++++++++++++++++++++++++++++++++++++
Email: meteormike@msn.com | IP Address: None | Cookie ID: None
0 likes
By metmike - Jan. 27, 2019, 5:07 p.m.
More weather related previous posts:
Re: Re: Natural Gas Tuesday/Wednesday/Thursday
By metmike - Jan. 26, 2019, 10:03 p.m.
Thanks Larry.
We can probably agree that natural gas would be trading lower here if it was basing the trading on changes in HDD's since the close.
The extraordinary nature of the cold coming up is so intense, that it makes one wonder how much lower we can go ahead of it, even if its been there for over a week.
My guess is that its mostly dialed in and since its really only around 5 days worth of very big HDD's, followed by a pretty quick warm up, where week 2 temps are NOW around normal(vs previous forecasts that were below normal). the market can look beyond that.
The 8-14 day today is computer guidance and very uncertain but the southern half of the country has above normal temperatures today, with a small area of blue in the Northcentral US.
This is a massive shift from just yesterday, which also featured widespread BELOW in the eastern half of the country for weeks 3-4 and the European weekly and monthly showing a great deal of cold coming from the Thursday forecast.
If the market is fed all this NEW warmer/bearish weather against the "possibly" dialed in 5 day period of brutally cold temps my opinion is that it will go lower, probably MUCH lower.
Wait a sec, I just realized that NGG expires on Tuesday. There is a chance for a big, brief spike higher just ahead of expiration of the front month, to coincide with very strong cash prices related to this weeks frigid weather.
We also had the rock bottom/bullish -AO on Friday, at the end of week 2 that today, recovers fast during week 2 to almost 0.
Of course the AO and the solutions on the models will go hand in hand. With the milder changes since yesterday on the weather features, of course the AO is not going to be as negative.
I agree that it can change on a dime, especially in this case because we have several key battles going on:
1. How much northern stream vs southern stream? The northern stream has been incredibly dominant and featured the polar vortex plunging unusually far south. (SSW event a month ago) . Models do especially poorly in locking in on northern stream dynamics but are better able to see southern stream dynamics based on whats going on in the Pacific(Madden Julian Oscillation and it downstream impact for instance), if a tropical connection is made with the southern stream, seems to increase forecast skill tremendously.
2. The location of the long lived ridge west/trough east couplet. If it retrogrades for instance, then we can turn a bullish pattern into a bearish one by changing the entry point of the coldest air to farther west and if the trough is far enough west, intervals with very mild air will increase ahead of any cold waves (that have the opportunity to moderate a great deal as they track away from their bitter cold source region)
3. Pattern change potential. This is related to #2 as the pattern change chances seem to be increasing and the change, may only be a shift westward of the large scale, features.
On a planetary scale, maybe its not huge to shift everything 500 miles farther west vs a complete metamorphose to something that reconfigures and looks entirely different.
However, in this case, it looks like several things happening at one.
a. The potential for the shift westward
b. The polar vortex retreating back north
c. The southern stream becoming much more dominant, especially in the Southeast and maybe East Coast but again, the retrograding nature of the pattern and the invigoration of the southern stream may be working in tandem with each other..........which could also be a factor in sending the polar vortex back home to Mommy Arctic.
++++++++++++++++++++++++++++++
By WxFollower - Jan. 27, 2019, 8:19 a.m.
Wow, the model consensus for weeks 1 and 2, combined, looks quite a bit warmer than the already significantly warmer models of 12Z yesterday. Expect a big gap down this evening absent a last minute reversal in the models this afternoon.
++++++++++++++++++++++++++++++++++++++++++++
By WxFollower - Jan. 27, 2019, 3:47 p.m.
I said earlier: "Wow, the model consensus for weeks 1 and 2, combined, looks quite a bit warmer than the already significantly warmer models of 12Z yesterday. Expect a big gap down this evening absent a last minute reversal in the models this afternoon."
-----------------------------------------------------------------------------------------------------------
Update: There was no reversal. Actually, there was a further warming at 12Z.
12Z Sun vs 12Z Fri: GEFS lost 32 HDD 1/28-2/9
12Z Sun vs 12Z Fri: EPS lost 47 HDD 1/28-2/7
These were some of the largest changes you'd typically see for ensemble runs over just a 48 hour period. GFS operational runs could easily have changes like this in just 12 hours, especially due to the very unreliable/volatile 11-15 day period. But, the changes I'm noting here are from ensemble runs, which are much less volatile.
Keep in mind that these changes are based on apples to apples. I'm looking at the days noted in these comparisons. I'm not looking at new days added onto the end as that wouldn't be apples to apples.
+++++++++++++++++++++++++++++++++
By tjc - Jan. 27, 2019, 5 p.m.
My Jan. 13 post appears will come to fruition IF the warm forecast results in a down Monday.
I do not know how to re-incorporate the Jan 13 post.
I bought calls correctly, did not wait until Tuesday to reverse and then (correctly)re-reversed, but did not re-re-verse Friday at close (but did close out the call)
BOTTOM line---caught counter trend move, correctly (one day too soon) reversed, but never held short to this Monday expiration.
+++++++++++++++++++++++++++++++++++++++++++++
By silverspiker - Jan. 28, 2019, 7:25 p.m.
A polar vortex “is a large area of low pressure and cold air surrounding both of the Earth’s poles,” the NWS explains. In the northern hemisphere, the vortex tends to expand in the winter, pushing the colder air south.
The boundary between the colder air coming down from the Arctic and the warmer air from the south is called the polar front jet stream, which usually moves quickly from west to east, according to Mark Serreze of the National Snow and Ice Data Center. That boundary line is continually moving – generally shifting further south in the winter.
"Aside from temperature, the very important thing about where the jet stream lies is that storms (like nor'easters) form along the jet stream and their path is guided by the jet stream," Serreze told Fox News, adding the temperature contrast of the warm and cold air "is what feeds the storms."
The vortex is continuously present – whether we feel the effects or not.
+++++++++++++++++++++++++++++++++++++++++++++++++++++++++++++++
By silverspiker - Jan. 28, 2019, 7:41 p.m.
... ya know Mike..... one of those above weather maps looks like a tye-died Jimi Hendrix T-shirt I used to have...
.... weather can be groovy fun....
... I want an Iowa State "Bomb Cyclone" for March Madness 2019 !
Iowa State

Bomb Cyclone.... continuous vortex
![[âIMG]](https://media1.tenor.com/images/07254cad3408128db8a9b3ce7a6aa5f0/tenor.gif?itemid=8290557)
GAMEDAY !
![[âIMG]](https://media.giphy.com/media/1YuL02Vk4SRuxkvpZ4/giphy.gif)
"Aside from temperature, the very important thing about where the jet stream lies is that storms (like nor'easters) form along the jet stream and their path is guided by the jet stream," Serreze told Fox News, adding the temperature contrast of the warm and cold air "is what feeds the storms."
The vortex is continuously present – whether we feel the effects or not.

Silverspiker,
Thanks for always giving us the flamboyant, entertaining take!