Great chart tallpine, corn is getting interesting here with the long lived cold and wet pattern catching the markets attention!
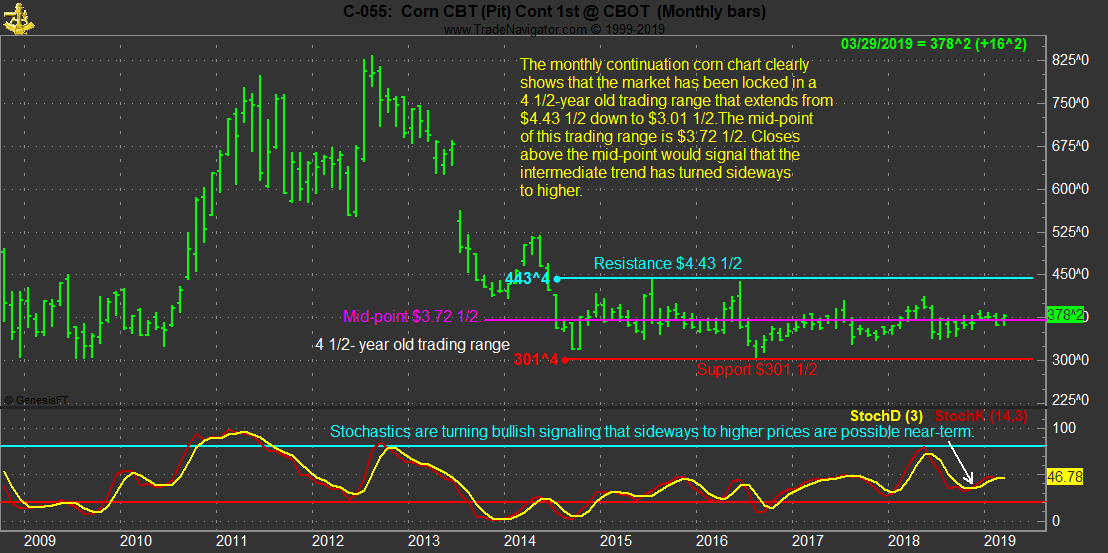
To surpass the 443 level we need NOT only E15 this summer but China needs to buy that 5-7 mmt of corn from US.
I did already do my price projections for Dec. Corn here Feb 23
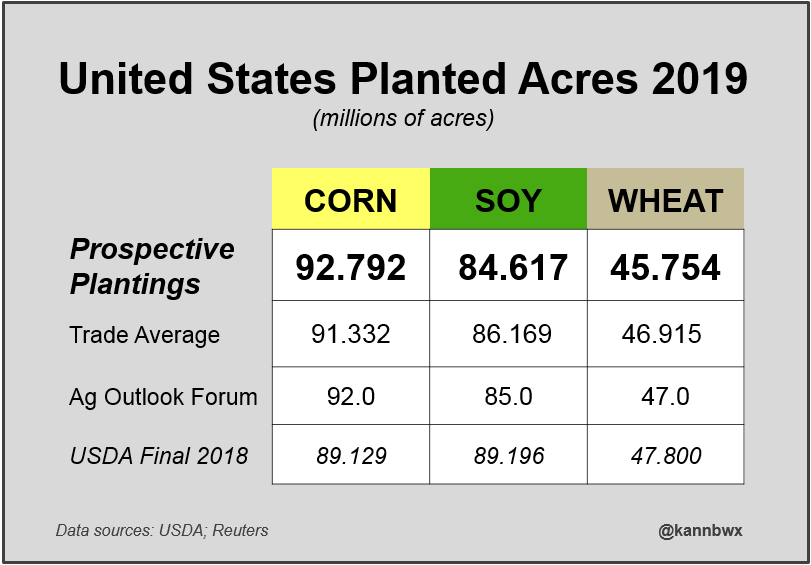
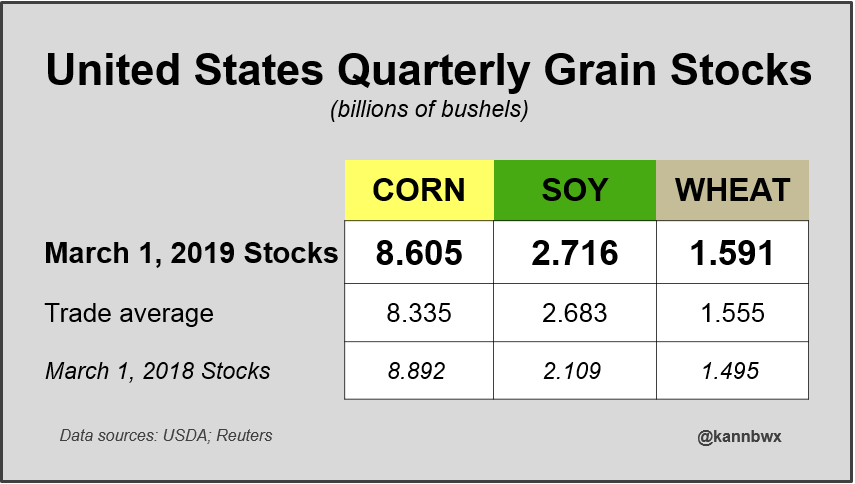
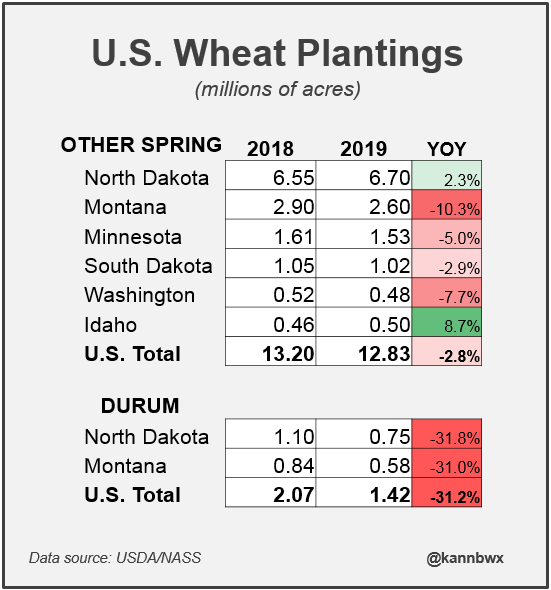
Huge USDA acreage report out on Friday.
Funds have a record or near record short in Corn.
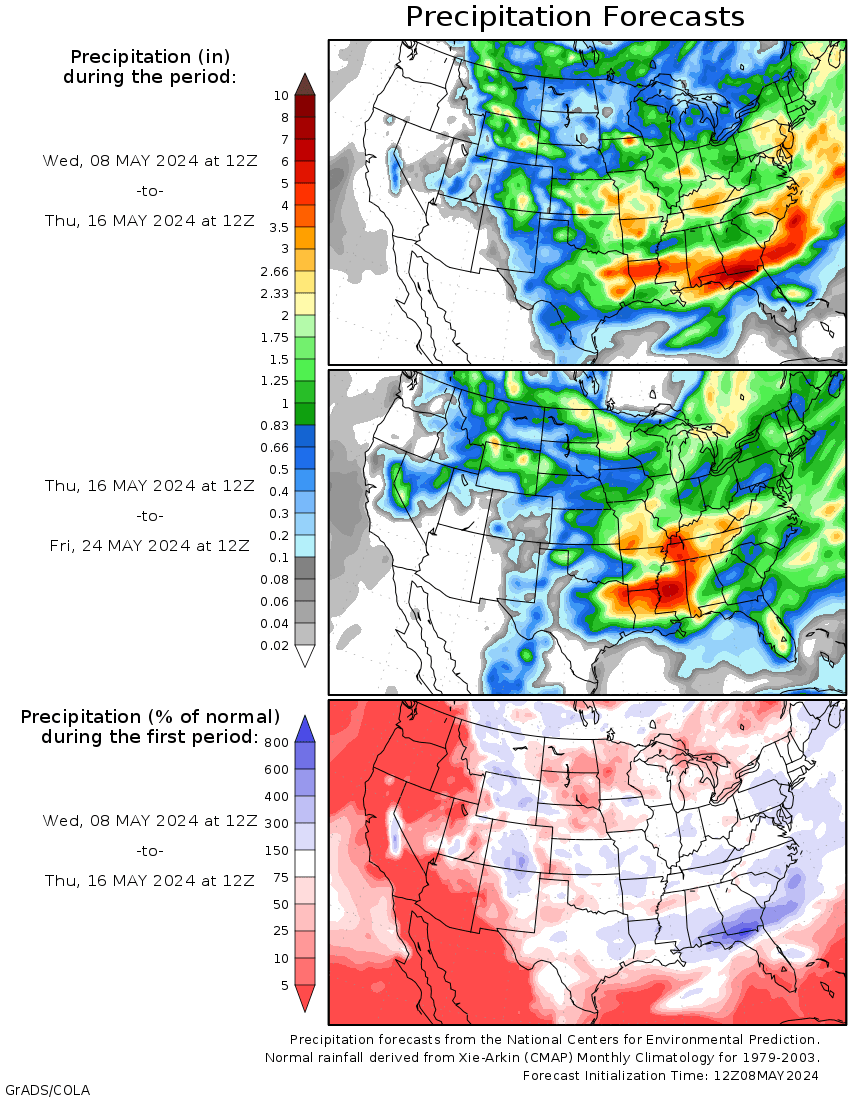
The market is concerned about the cold wet/snowy weather and planting delays......but there is still over a month to dry things out.
The forecast on Tuesday is drier(to me) which is putting some pressure on corn prices today.
This source below is updated every 12 hours:
http://wxmaps.org/outlooks.php
http://wxmaps.org/outlooks.php
I find myself in a pickle trade due to Fridays report.
Long 2 K corn + 1 K wheat
Short 1 K bean
Thanks becker!
Here's some good information from earlier today from farmprogress.
https://www.farmprogress.com/morning-market-review/morning-market-review-march-26-2019


ty ..... looks ike a spectator sport until now ...


...... MINE 3-48 -1/4
By the numbers (complements of Reuters)
Still looks pretty wet The last 4 runs of the GFS operational model, total 2 week precip is below. The top one, 12z model just came out. Below that, are the previous ones, each from 6 hours earlier...... the 6z, 0z and 18z. In 6 hours, the bottom one, the 18z run will be updated and be the latest and this top one 12z the 2nd oldest.
Forecast Hour: 384
Image URL: http://mag.ncep.noaa.gov/data/gfs/12/namer/precip_ptot/gfs_namer_384_precip_ptot.gif

Image URL: http://mag.ncep.noaa.gov/data/gfs/06/namer/precip_ptot/gfs_namer_384_precip_ptot.gif

Forecast Hour: 384
Image URL: http://mag.ncep.noaa.gov/data/gfs/00/namer/precip_ptot/gfs_namer_384_precip_ptot.gif

Forecast Hour: 384
Image URL: http://mag.ncep.noaa.gov/data/gfs/18/namer/precip_ptot/gfs_namer_384_precip_ptot.gif

Export inspections:
https://www.ams.usda.gov/mnreports/wa_gr101.txt
The market is trading weather too wet for planting.