Here's the weather that affects the natural gas market. Cold causes an increase in residential heating. Hot causes an increase in residential cooling:
This week, the forecast has featured widespread very warm temperatures which means near record LOW heating demand in the US for April, which will cause some huge/record natural gas injections into storage!
Sundays Weather:
https://www.marketforum.com/forum/topic/27756/
Mondays Weather:
https://www.marketforum.com/forum/topic/27818/
Tuesdays Weather:
https://www.marketforum.com/forum/topic/27905/
Wednesday Weather:
https://www.marketforum.com/forum/topic/27986/
Thursday Weather:
https://www.marketforum.com/forum/topic/28076/
Friday Weather:
https://www.marketforum.com/forum/topic/28145/
Saturday Weather:
https://www.marketforum.com/forum/topic/28206/
Sunday Weather:
https://www.marketforum.com/forum/topic/28267/
Previous natural gas discussions/threads
:
Previous discussions on natural gas here:
https://www.marketforum.com/forum/topic/27305/
https://www.marketforum.com/forum/topic/26861/
https://www.marketforum.com/forum/topic/26506/
https://www.marketforum.com/forum/topic/26105/
https://www.marketforum.com/forum/topic/25678/
https://www.marketforum.com/forum/topic/25189/
https://www.marketforum.com/forum/topic/24662/
Storage compared to average was extremely low as we started Winter which caused some massive upward price spikes early on. Then a very mild December allowed us to almost catch up...........followed by some extreme cold in February that caused the storage disparity to grow again.
Working gas in storage was 1,155 Bcf as of Friday, April 5, 2019, according to EIA estimates. This represents a net increase of 25 Bcf from the previous week. Stocks were 183 Bcf less than last year at this time and 485 Bcf below the five-year average of 1,640 Bcf. At 1,155 Bcf, total working gas is within the five-year historical range.
For information on sampling error in this report, see Estimated Measures of Sampling Variability table below.

Note: The shaded area indicates the range between the historical minimum and maximum values for the weekly series from 2014 through 2018. The dashed vertical lines indicate current and year-ago weekly periods.
EIA report from last Thursday:
+25 bcf
| Working gas in underground storage, Lower 48 states Summary textCSVJSN | |||||||||||||||||||||||||||||||||||||||||||||||||||||||||||||||||||
|---|---|---|---|---|---|---|---|---|---|---|---|---|---|---|---|---|---|---|---|---|---|---|---|---|---|---|---|---|---|---|---|---|---|---|---|---|---|---|---|---|---|---|---|---|---|---|---|---|---|---|---|---|---|---|---|---|---|---|---|---|---|---|---|---|---|---|---|
| Historical Comparisons | |||||||||||||||||||||||||||||||||||||||||||||||||||||||||||||||||||
| Stocks billion cubic feet (Bcf) | Year ago (04/05/18) | 5-year average (2014-18) | |||||||||||||||||||||||||||||||||||||||||||||||||||||||||||||||||
| Region | 04/05/19 | 03/29/19 | net change | implied flow | Bcf | % change | Bcf | % change | |||||||||||||||||||||||||||||||||||||||||||||||||||||||||||
| East | 209 | 210 | -1 | -1 | 219 | -4.6 | 264 | -20.8 | |||||||||||||||||||||||||||||||||||||||||||||||||||||||||||
| Midwest | 240 | 241 | -1 | -1 | 249 | -3.6 | 332 | -27.7 | |||||||||||||||||||||||||||||||||||||||||||||||||||||||||||
| Mountain | 64 | 64 | 0 | 0 | 84 | -23.8 | 115 | -44.3 | |||||||||||||||||||||||||||||||||||||||||||||||||||||||||||
| Pacific | 119 | C | 113 | 6 | 7 | C | 170 | -30.0 | 207 | -42.5 | |||||||||||||||||||||||||||||||||||||||||||||||||||||||||
| South Central | 523 | C | 502 | 21 | 23 | C | 616 | -15.1 | 722 | -27.6 | |||||||||||||||||||||||||||||||||||||||||||||||||||||||||
| Salt | 166 | C | 156 | 10 | 12 | C | 195 | -14.9 | 209 | -20.6 | |||||||||||||||||||||||||||||||||||||||||||||||||||||||||
| Nonsalt | 357 | 347 | 10 | 10 | 422 | -15.4 | 513 | -30.4 | |||||||||||||||||||||||||||||||||||||||||||||||||||||||||||
| Total | 1,155 | C | 1,130 | 25 | 29 | C | 1,338 | -13.7 | 1,640 | -29.6 | |||||||||||||||||||||||||||||||||||||||||||||||||||||||||
https://www.investing.com/economic-calendar/natural-gas-storage-386 Latest Release Apr 11, 2019 Actual25B Forecast29B Previous23B
| |||||||||||||||||||||||||||||||||||||||||||||||||||||||||||||||||||
These were the temperatures for the 7 day period ending the previous Friday............which went into that report.
Here are the 7 day temps, ending last Friday for this Thursdays report........very mild over a large high population area so residential heating demand was low and the storage number will be a bearishly large injection:
The point of showing it is to show that natural gas has a strong historical tendency to go up after mid February.
The lows in Feb., would be perfectly timed with a typical, end of Winter low, which is followed by increasing prices over 80% of the time into early Spring.
One should also note that at this time of year, when most of the heating season is over, weather/cold temperatures that increases heating demand in the high population centers has less power to determine prices.............as long as supplies aren't precariously low(they are low but not extremely low) or the demand/supply fundamentals are not extremely tight. Fundamentals are actually pretty bearish........note the price is still fairly low even though storage is still less than the 5 year average.....because the market feels very comfortable...... is projecting additional storage gains from supplies gushing in.
These natural gas price charts aren't the greatest but they did show a likely seasonal bottom............which we are getting close to testing. The Feb price dropped down and tested the Jan lows for the May contract which is now the front month and reversed higher.
Huge support in that zone on the yearly chart, with numerous trips down to between around 2.5 to 2.6 that solidly held.
After the spike higher from the record cold, natural gas has been struggling. Is the top in and we go against strong positive seasonal price action because of supplies hitting the market and expectations of a growing surplus later this year pressuring the price? Or will seasonal strength help to support the market?
That was the Sunday Night comment. Obviously we have the answer with weather forecasts continuing to get warmer and warmer this week and prospects for record large injections for the next several weeks vs last year, when the next 2 weeks for 2018 were record large withdrawals.............so we've made new lows for this year, which is extraordinarily rare in the month of April(maybe has happened only once during the last 2 decades).
NG 7 days
Natural gas 3 months below
Natural gas 1 year chart
https://seekingalpha.com/article/4254210-april-2019-natural-gas-demand-overview-forecast
Summary
Natural gas consumption for January was the highest level for any month since 2001.
The average daily rate of dry natural gas production for January was the second highest for any month since EIA began tracking monthly dry natural gas production in 1973.
Under the latest weather forecasts, we project that natural gas consumption will decline in annual terms by around 1.70% (on average) over the next three months.
We have been bearish on natural gas and have been selling the rallies for the past month or so. However, we are not adding to our short exposure anymore.
We believe that over the next three months, total supply will be growing faster (on an annualized basis) than total demand ensuring that total supply-demand balance will be looser relative to 2018.
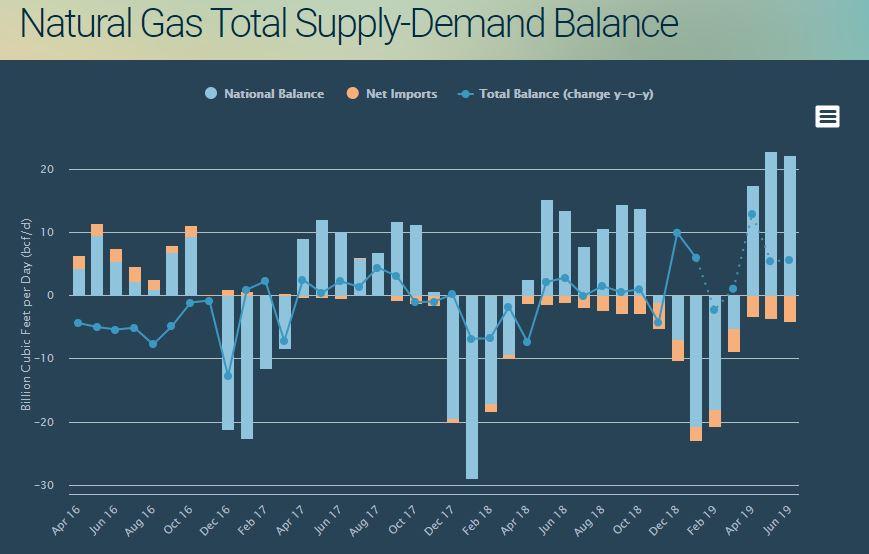
Source: EIA, Bluegold Research estimates and calculations
This January, pipeline and LNG exports combined totaled 362.7 bcf or 11.7 bcf per day. The volume of total exports is now equivalent to 10.7% of national natural gas consumption on a monthly basis. On a 12-month average basis, exports now equate to around 10.90% of total demand - a new all-time record - and its share in the aggregate demand structure has almost doubled over the past three years.
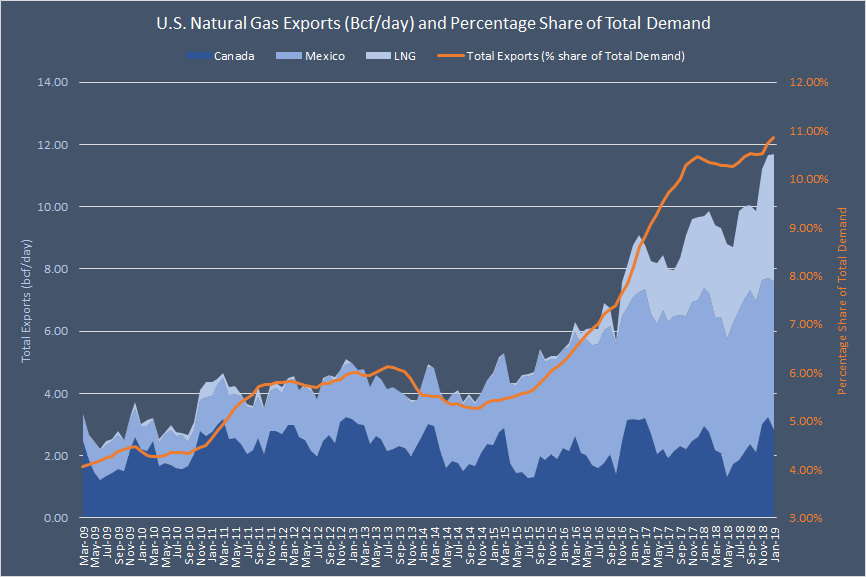
Exports remain the fastest-growing source of demand for American natural gas. While total demand (12-month average) increased by 20.2% over the past five years (from January 2014 to January 2019), exports more than doubled over the same period. In fact, exports have already surpassed the "Other" category in the overall demand mix and are now more significant in weight than U.S. commercial users (see the chart below). Next year, the share of exports will overtake residential consumption (on a 12-month average basis).

Source: EIA, Bluegold Research estimates and calculations
Last year during this time frame was near record chilly for the Midwest/East natural gas high population centers.
As noted above, this year, we already had our first 2 injections of natural gas +23 bcf and +25 bcf.....compared to last year(2018) when there were still withdrawals for the same weeks.
For the next 3 weeks, this is what I have for the 2018 EIA reports.
-34 bcf
-20 bcf
+60 bcf
Last weeks +25 bcf was compared to last years -20 bcf.
So we didn't have our first injection last year until the END of April.
As a result, we should be closing some of the storage deficit gap with 2018 over the next 2 weeks, at a time when, last year, there was a total drawdown of -54 bcf, which has got to be a record for so late in the season.
On the 5 year average for the next 3 weeks, this is what I have.
+21 bcf
+47 bcf
+70 bcf
Last weeks +25 bcf was compared to the 5 year average of +5 bcf.
From Natural Gas Intelligence Monday Morning:
‘Big Warmer Change’ Over Weekend Pressures Natural Gas Futures Lower Early
The 0Z Mon GEFS/EPS runs had ~10-15 fewer HDDs than Fri. Also, it is still way too early for compensating higher CDDs. Actually, the increase in CDDs was marginal at best. We need to get well into May to normally start seeing CDDs have much of an impact. So, the lower NG is no surprise.
Thanks Larry!
Agree on the CDD's. Did you see a source that was drawing attention to them?
At the moment, we're just below the Feb 2019 lows and just above the Jan 2019 lows, which were 2.59 for the May NG.
Below that, we had several trips down to 2.550 last year and dipped just below 2.5 briefly in early May 2018.
You're welcome. No, I saw no mention of CDDs.
Monday closing comment from Natural Gas Intelligence:
Natural Gas Futures Crash Through Key Support After Weather Models Turn Much Warmer
Tuesday morning comment:
Potential Downside for Natural Gas Supply on Maintenance, Imports; Futures Steady Early
The picture is pretty simple (bearish even at the current relatively low prices) as it still looks quite warm vs normal for the rest of April overall for the US, which paired with high production will support very large/larger than normal injections the next few weeks. So, deficits will be falling markedly. The 0Z ensemble changes for 0Z today vs 24 hours ago are minimal.
If we were about two or so weeks later, NG may have been starting to respond bullishly to the warmth. But not yet as CDD gains are still too low vs the HDDs lost to the warmth.
Thanks much Larry!
I think that these next 2 EIA reports, compared to 2018, when there were very late season drawdowns is only going to help amplify the effect of the seasonally big injections coming up.
NGI closing comments from Tuesday:
Small Demand Additions Can’t Stop Natural Gas Futures Slide; Cash Mixed
Strong bearish sentiment was too much for natural gas bulls to overcome Tuesday even as the latest weather data added some demand back into forecasts. However, after Monday’s 7-cent plunge, the Nymex May gas futures contract took somewhat of a breather and ultimately settled only 1.8 cents lower at $2.572/MMBtu. June slid 1.6 cents to $2.617.
From Natural Gas Intelligence Wednesday Morning:
April Weather-Driven Demand Seen Near Historic Lows; Natural Gas Futures Down Early
NG was down pretty strongly on there being little change in the mild to warm outlook for late April in combo with high production levels. Since that means large injections for the foreseeable future and big reductions in the storage deficit, that was again bearish for today’s prices. It is still too early for projected CDDs to be a major market mover although that could start to change within the next 1-2 weeks should week 2 model consensus remain warm, especially considering that low prices would likely start leading to a tightening of the S/D balance.
After the close Wednesday, NGI:
Emboldened Bears Claw Through Key Support as May Natural Gas Slides
6:07 PM
Natural gas bears were emboldened after taking out a long-held key support level on Wednesday with weather models trending increasingly warmer. The Nymex May gas futures contract settled 5.5 cents lower at $2.517/MMBtu, and June settled 5.8 cents lower at $2.559.
And thanks for your comments earlier Larry!
for week ending April 12, 2019 | Released: April 18, 2019 at 10:30 a.m. | Next Release: April 25, 2019
+92 bcf a record for this week Latest Release Apr 18, 2019 Actual 92B Forecast 87B
| Working gas in underground storage, Lower 48 states Summary text CSV JSN | |||||||||||||||||||||||||
|---|---|---|---|---|---|---|---|---|---|---|---|---|---|---|---|---|---|---|---|---|---|---|---|---|---|
| Historical Comparisons | |||||||||||||||||||||||||
| Stocks billion cubic feet (Bcf) | Year ago (04/12/18) | 5-year average (2014-18) | |||||||||||||||||||||||
| Region | 04/12/19 | 04/05/19 | net change | implied flow | Bcf | % change | Bcf | % change | |||||||||||||||||
| East | 228 | 209 | 19 | 19 | 208 | 9.6 | 264 | -13.6 | |||||||||||||||||
| Midwest | 254 | 240 | 14 | 14 | 231 | 10.0 | 332 | -23.5 | |||||||||||||||||
| Mountain | 66 | 64 | 2 | 2 | 83 | -20.5 | 115 | -42.6 | |||||||||||||||||
| Pacific | 128 | 119 | 9 | 9 | 174 | -26.4 | 211 | -39.3 | |||||||||||||||||
| South Central | 571 | 523 | 48 | 48 | 608 | -6.1 | 739 | -22.7 | |||||||||||||||||
| Salt | 187 | 166 | 21 | 21 | 187 | 0.0 | 218 | -14.2 | |||||||||||||||||
| Nonsalt | 384 | 357 | 27 | 27 | 421 | -8.8 | 521 | -26.3 | |||||||||||||||||
| Total | 1,247 | 1,155 | 92 | 92 | 1,304 | -4.4 | 1,661 | -24.9 | |||||||||||||||||
Thursday's closing remarks from Natural Gas Intelligence:
Bears Take Out Key Support as Natural Gas Forwards Tumble; Waha Still Below Zero
A solidly bearish weather outlook sent natural gas forward prices tumbling from April 11-16 as the mild spring setup was expected to significantly improve storage inventories in the weeks ahead, potentially leading to a year/year surplus in stocks. May forward prices dropped an average 11 cents, while June and the balance of summer (May-October) slid a dime on average,
 Seasonal Chart")