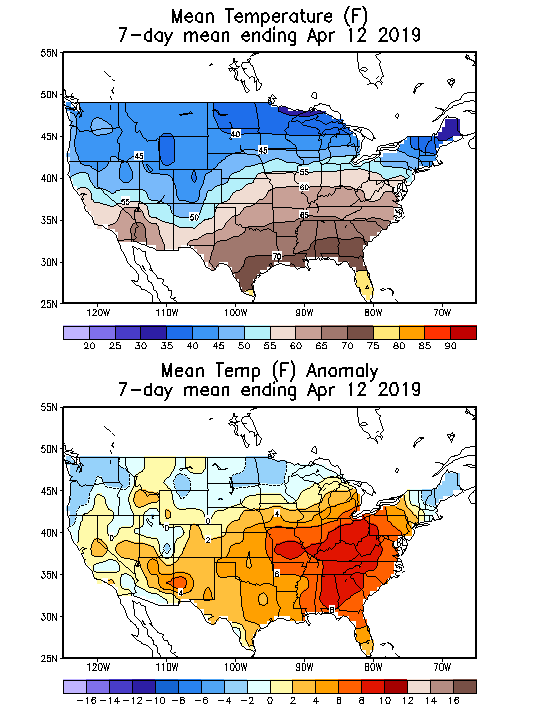
Here's the weather that affects the natural gas market. Cold causes an increase in residential heating. Hot causes an increase in residential cooling:
Recently, the forecast has featured widespread very warm temperatures in the high populations centers which means LOW heating demand in the US for April, which will cause some huge/record natural gas injections into storage!
Monday Weather:
https://www.marketforum.com/forum/topic/28325/
Tuesday Weather:
https://www.marketforum.com/forum/topic/28420/
Wednesday Weather:
https://www.marketforum.com/forum/topic/28499/
Thursday Weather:
https://www.marketforum.com/forum/topic/28562/
Friday Weather:
https://www.marketforum.com/forum/topic/28634/
Saturday Weather:
https://www.marketforum.com/forum/topic/28713/
Sunday Weather:
https://www.marketforum.com/forum/topic/28757/
Monday Weather:
https://www.marketforum.com/forum/topic/28830/
Previous discussions on natural gas here:
https://www.marketforum.com/forum/topic/27780/
https://www.marketforum.com/forum/topic/27305/
https://www.marketforum.com/forum/topic/26861/
https://www.marketforum.com/forum/topic/26506/
https://www.marketforum.com/forum/topic/26105/
https://www.marketforum.com/forum/topic/25678/
https://www.marketforum.com/forum/topic/25189/
https://www.marketforum.com/forum/topic/24662/
Storage compared to average was extremely low as we started Winter which caused some massive upward price spikes early on. Then a very mild December allowed us to almost catch up...........followed by some extreme cold in February that caused the storage disparity to grow again.
Last weeks injection was a record/bearish +92 bcf.
| Working gas in underground storage, Lower 48 states Summary text CSV JSN | |||||||||||||||||||||||||
|---|---|---|---|---|---|---|---|---|---|---|---|---|---|---|---|---|---|---|---|---|---|---|---|---|---|
| Historical Comparisons | |||||||||||||||||||||||||
| Stocks billion cubic feet (Bcf) | Year ago (04/12/18) | 5-year average (2014-18) | |||||||||||||||||||||||
| Region | 04/12/19 | 04/05/19 | net change | implied flow | Bcf | % change | Bcf | % change | |||||||||||||||||
| East | 228 | 209 | 19 | 19 | 208 | 9.6 | 264 | -13.6 | |||||||||||||||||
| Midwest | 254 | 240 | 14 | 14 | 231 | 10.0 | 332 | -23.5 | |||||||||||||||||
| Mountain | 66 | 64 | 2 | 2 | 83 | -20.5 | 115 | -42.6 | |||||||||||||||||
| Pacific | 128 | 119 | 9 | 9 | 174 | -26.4 | 211 | -39.3 | |||||||||||||||||
| South Central | 571 | 523 | 48 | 48 | 608 | -6.1 | 739 | -22.7 | |||||||||||||||||
| Salt | 187 | 166 | 21 | 21 | 187 | 0.0 | 218 | -14.2 | |||||||||||||||||
| Nonsalt | 384 | 357 | 27 | 27 | 421 | -8.8 | 521 | -26.3 | |||||||||||||||||
| Total | 1,247 | 1,155 | 92 | 92 | 1,304 | -4.4 | 1,661 | -24.9 | |||||||||||||||||
Totals may not equal sum of components because of independent rounding. | |||||||||||||||||||||||||
Working gas in storage was 1,247 Bcf as of Friday, April 12, 2019, according to EIA estimates. This represents a net increase of 92 Bcf from the previous week. Stocks were 57 Bcf less than last year at this time and 414 Bcf below the five-year average of 1,661 Bcf. At 1,247 Bcf, total working gas is within the five-year historical range.
For information on sampling error in this report, see Estimated Measures of Sampling Variability table below.

Note: The shaded area indicates the range between the historical minimum and maximum values for the weekly series from 2014 through 2018. The dashed vertical lines indicate current and year-ago weekly periods.
Last 5 EIA reports:
https://www.investing.com/economic-calendar/natural-gas-storage-386
| Release Date | Time | Actual | Forecast | Previous | |
|---|---|---|---|---|---|
| Apr 25, 2019 | 10:30 | 87B | 92B | ||
| Apr 18, 2019 | 10:30 | 92B | 87B | 25B | |
| Apr 11, 2019 | 10:30 | 25B | 29B | 23B | |
| Apr 04, 2019 | 10:30 | 23B | 10B | -36B | |
| Mar 28, 2019 | 10:30 | -36B | -40B | -47B | |
| Mar 21, 2019 | 10:30 | -47B | -48B | -204B |
These were the 7 day temps, ending the previous Friday for the last report........very mild over a large high population area so residential heating demand was low and the storage number was a bearishly large injection:
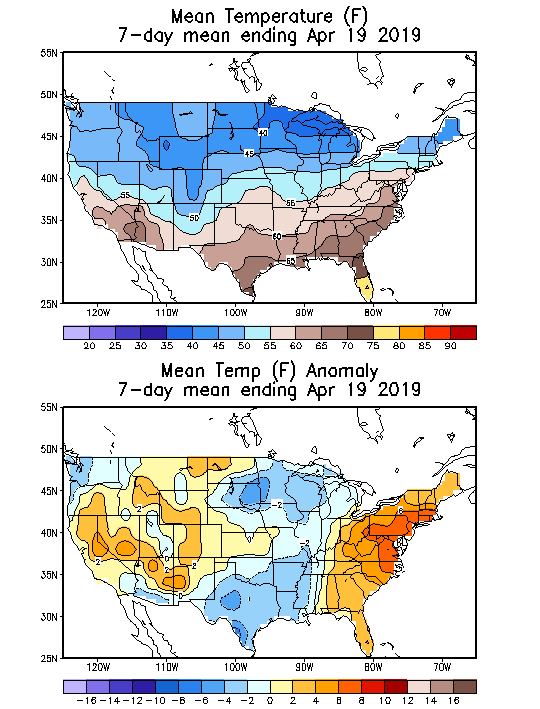
These were the temperatures for the 7 days ending last Friday that will be used for this Thursday report.
Not as warm, especially in the Midwest.
The point of showing it is to show that natural gas has a strong historical tendency to go up after mid February.
The lows in Feb., WERE perfectly timed with a typical, end of Winter low, which is followed by increasing prices over 80% of the time into early Spring.
However, this year has been a noted exception/aberration. Fundamentals are pretty/very bearish........note the price has stayed fairly low even though storage was much less than the 5 year average.....because the market feels very comfortable...... and has been projecting additional storage gains from supplies gushing in.
These natural gas price charts aren't the greatest but they did show a likely seasonal, double bottom............which we violated with gusto last week as we spiked to new lows from huge storage injections ahead..
Record late season withdrawals last April......2018 have only made the big injections that much more bearish on the year to year comparisions. So we have experienced something that's extraordinarily rare in the month of April-new lows(maybe has happened only once during the last 2 decades).
NG 7 days
Natural gas 3 months below
https://seekingalpha.com/article/4254210-april-2019-natural-gas-demand-overview-forecast
Summary
Natural gas consumption for January was the highest level for any month since 2001.
The average daily rate of dry natural gas production for January was the second highest for any month since EIA began tracking monthly dry natural gas production in 1973.
Under the latest weather forecasts, we project that natural gas consumption will decline in annual terms by around 1.70% (on average) over the next three months.
We have been bearish on natural gas and have been selling the rallies for the past month or so. However, we are not adding to our short exposure anymore.
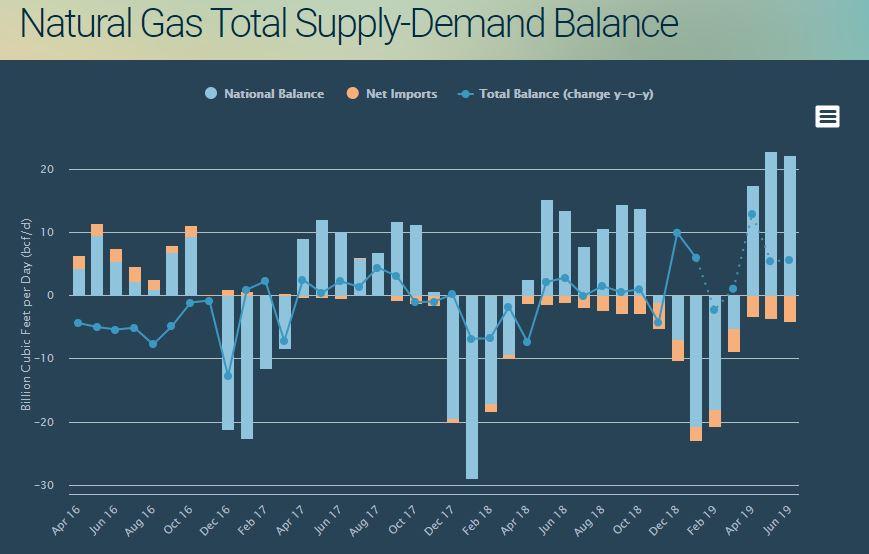
We believe that over the next three months, total supply will be growing faster (on an annualized basis) than total demand ensuring that total supply-demand balance will be looser relative to 2018.
Source: EIA, Bluegold Research estimates and calculations
This January, pipeline and LNG exports combined totaled 362.7 bcf or 11.7 bcf per day. The volume of total exports is now equivalent to 10.7% of national natural gas consumption on a monthly basis. On a 12-month average basis, exports now equate to around 10.90% of total demand - a new all-time record - and its share in the aggregate demand structure has almost doubled over the past three years.
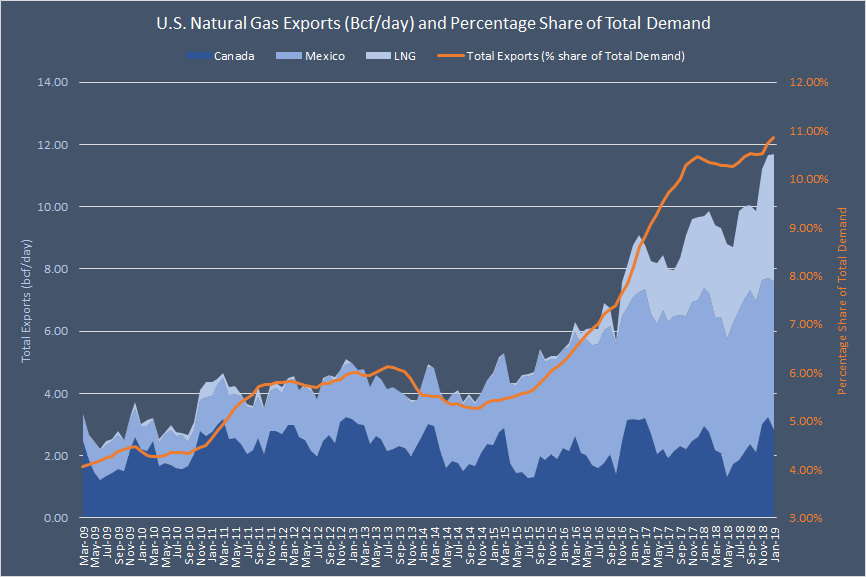
Exports remain the fastest-growing source of demand for American natural gas. While total demand (12-month average) increased by 20.2% over the past five years (from January 2014 to January 2019), exports more than doubled over the same period. In fact, exports have already surpassed the "Other" category in the overall demand mix and are now more significant in weight than U.S. commercial users (see the chart below). Next year, the share of exports will overtake residential consumption (on a 12-month average basis).

Source: EIA, Bluegold Research estimates and calculations
Last year during this time frame was near record chilly for the Midwest/East natural gas high population centers.
As noted above, this year, we already had our first 3 injections of natural gas +23 bcf and +25 bcf, +92 bcf .....compared to last year(2018) when there were still withdrawals for the same weeks. This has quickly closed the storage deficit with last year and this coming week, it will be a surplus vs the previous year for the first time in a long while.
For the next 2 weeks, this is what I have for the 2018 EIA reports.
-20 bcf
+60 bcf
Last weeks +92 bcf was compared to last years -34 bcf.
So we didn't have our first injection last year until the END of April.
As a result, we will now be seeing a SURPLUS vs 2018, staring this Thursday.
On the 5 year average for the next 2 weeks, this is what I have.
+47 bcf
+70 bcf
Last weeks +92 bcf was compared to the 5 year average of +21 bcf. It will take some work and time to get above the 5 year average, which is still 414 bcf higher than current storage.
Closing comments from Natural Gas Intelligence:
Natural Gas Futures Bounce on Cooler Forecast Trends; Spot Market Mixed on Mild Temps
5:16 PM
Cooler forecast trends over the Easter holiday weekend helped natural gas futures bounce Monday to recover some of the declines recorded last week. Mild temperatures and numerous maintenance events continued to shape the spot market as points in the Rockies posted large day/day gains; the NGI Spot Gas National Avg. tacked on 15.5 cents to $2.040/MMBtu.
Natural Gas Intelligence Tuesday close:
Key Pipe Work Affects LNG Exports, Sending Natural Gas Futures Lower Despite Drop in Supply
One day after cooler trends in weather models helped boost natural gas futures by a few pennies, bears attempted to reclaim control by quickly reversing those gains amid shifting forecasts and a significant drop in flows to a Gulf Coast liquefied natural gas facility. The May Nymex gas futures contract settled Tuesday at $2.455/MMBtu, down 6.9 cents. June lost 5.9 cents to hit $2.499
NGI Wednesday morning:
Weather-Driven Demand Inching Higher as Natural Gas Futures Rebound Early
NGI Wed close
Natural Gas Futures Stall Ahead of Expected Flip to Surplus for Storage Stocks; Cash Bounces
5:14 PM
Weather models continued to add back some demand for the next couple of weeks, driving natural gas futures marginally higher Wednesday as the market begins to move beyond a month-long period of massive year/year weather differences that were seen pushing storage inventories to a surplus over last year’s levels. The May Nymex gas futures contract settled seven-tenths of a cent higher at $2.462/MMBtu, while June rose 0.1 cents to $2.50
Natural Gas Storage Stocks Move Above Year-Ago Levels After EIA Reports 92 Bcf Build
| Working gas in underground storage, Lower 48 states Summary text CSV JSN | |||||||||||||||||||||||||
|---|---|---|---|---|---|---|---|---|---|---|---|---|---|---|---|---|---|---|---|---|---|---|---|---|---|
| Historical Comparisons | |||||||||||||||||||||||||
| Stocks billion cubic feet (Bcf) | Year ago (04/19/18) | 5-year average (2014-18) | |||||||||||||||||||||||
| Region | 04/19/19 | 04/12/19 | net change | implied flow | Bcf | % change | Bcf | % change | |||||||||||||||||
| East | 251 | 228 | 23 | 23 | 205 | 22.4 | 277 | -9.4 | |||||||||||||||||
| Midwest | 264 | 254 | 10 | 10 | 213 | 23.9 | 338 | -21.9 | |||||||||||||||||
| Mountain | 70 | 66 | 4 | 4 | 84 | -16.7 | 117 | -40.2 | |||||||||||||||||
| Pacific | 138 | 128 | 10 | 10 | 177 | -22.0 | 216 | -36.1 | |||||||||||||||||
| South Central | 616 | 571 | 45 | 45 | 604 | 2.0 | 761 | -19.1 | |||||||||||||||||
| Salt | 204 | 187 | 17 | 17 | 182 | 12.1 | 227 | -10.1 | |||||||||||||||||
| Nonsalt | 413 | 384 | 29 | 29 | 421 | -1.9 | 533 | -22.5 | |||||||||||||||||
| Total | 1,339 | 1,247 | 92 | 92 | 1,284 | 4.3 | 1,708 | -21.6 | |||||||||||||||||
Totals may not equal sum of components because of independent rounding. | |||||||||||||||||||||||||
Working gas in storage was 1,339 Bcf as of Friday, April 19, 2019, according to EIA estimates. This represents a net increase of 92 Bcf from the previous week. Stocks were 55 Bcf higher than last year at this time and 369 Bcf below the five-year average of 1,708 Bcf. At 1,339 Bcf, total working gas is within the five-year historical range.
Friday early from NGI: Natural Gas Futures Steady as Forecasts Advertise Additional Demand
May natural gas expires today...........watch out for spikes!
For almost 7 months, the amount of heating demand from cold weather in the high population centers of the Midwest and East, historically-seasonally use up the most natural gas.
As the weather warms up gradually in the Spring, the heating degree days(HDD’s) go down and CDD’s go up.
At some point they intersect and CDD’s pass up HDD’s for good..........until October. That point is around May 8th on average.
So starting in the 2nd full week of May, population weighted CDD’s because of hot weather are greater and become more and more important until they peak in mid/late July. After that, they are still very important but less important even as they start falling because the biggest change in demand for natural is always the result of big changes in temperatures which cause a big change in residential cooling or heating needs.
Despite CDD’s being a big deal in the Summer, especially during widespread major heat waves, they pale in the power to move the market compared to HDD’s in the Winter.
This is one of the reasons that we usually have injections that add to supply, sometimes big ones (+100+) during the Summer and withdrawals, sometimes huge ones during the Winter (-200+).
So temperature forecasts are much more important during the Winter.
 Seasonal Chart")