Hello May 3rd! Do something to make somebody feel GREAT today. Don't just think about it........do it. Then think about it.............and how you just made somebody's world a tiny bit greener.
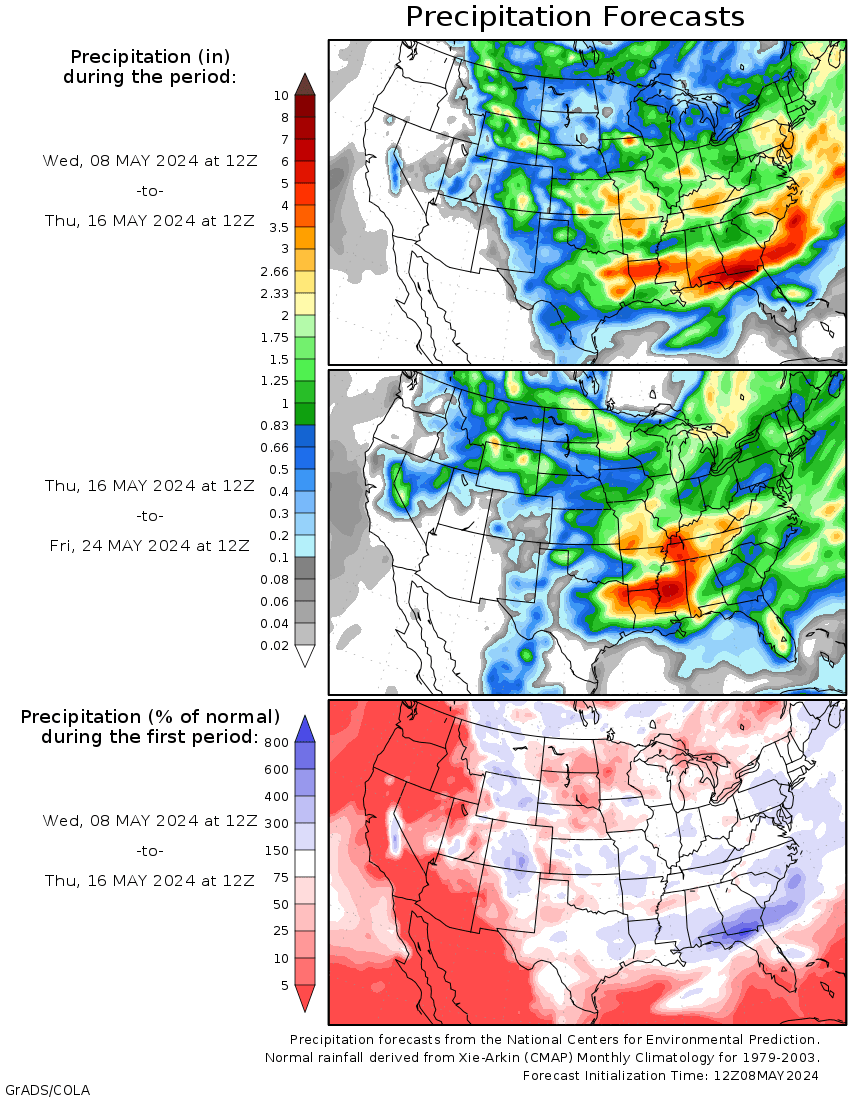
Scroll down and enjoy the latest comprehensive weather to the max...... occurring because of the natural physical laws in our atmosphere. Heaviest rains in the 2 week forecast continue to be south of the Cornbelt-though the Cornbelt is still very wet. On Friday morning we are still seeing a continued shift southward in the wettest weather and more drying from the north............the forecast, as a result is drier vs yesterday.
Noted overnight drier changes on Euro Ensemble and 06Z operational GFS in week 2.
Here are the latest hazards across the country.
Purple/Pink/blue on land is cold/Winter weather. Brown is wind, Green is flooding. Gray is fog. Reddish is a red flag advisory.
Go to the link below, then hit the location/county on the map for details.
https://www.spc.noaa.gov/ Go to "hazards"


Wind map Press down on this on the left with your cursor!


Current Jet Stream

| Low Temperatures Tomorrow Morning |

Balmy air stays entrenched in the Southeast! Chilly northern tier!
Color coding of temperature bands below are poorly chosen............make it look hot everywhere.


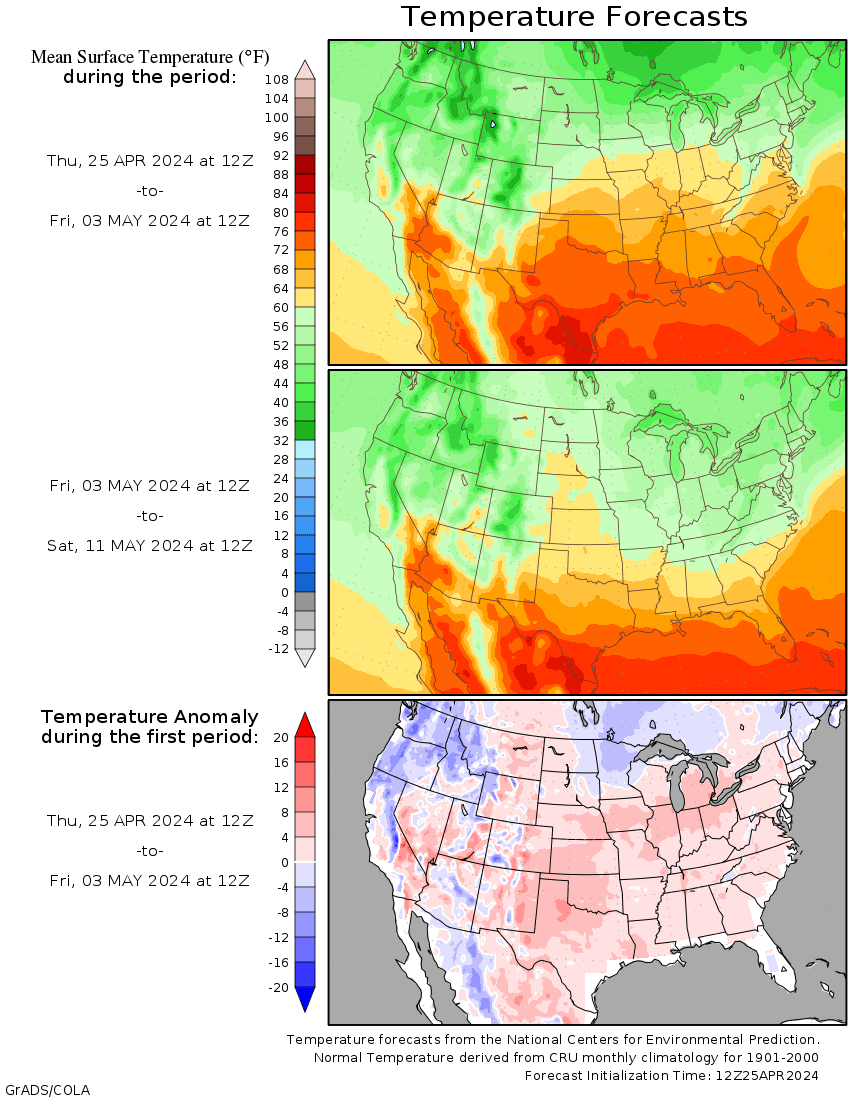
Highs for days 3-7:
Very Warm South and East. Hot in the Southeast!
Cool northern tier. Very chilly N.Plains.


Average Temperature anomalies for days 3-7:
Above average south/east, Below average northern tier, much below N.Plains to Upper Midwest.
https://www.wpc.ncep.noaa.gov/medr/medr_mean.shtml


Weather maps for days 3-7 below
Active Front between very warm south/east and cool to chilly much farther north/northwest.

Last 24 hour precip top map
Last 7 day precip below that
https://www.wunderground.com/maps/precipitation/daily


Liquid equivalent precip forecasts for the next 7 days are below.
Still pretty wet in week 1 but will we see a shift to drier from the north evolving during week 2?
Day 1 below:
http://www.wpc.ncep.noaa.gov/qpf/fill_94qwbg.gif?1526306199054

Day 2 below:
http://www.wpc.ncep.noaa.gov/qpf/fill_98qwbg.gif?1528293750112

Day 3 below
http://www.wpc.ncep.noaa.gov/qpf/fill_99qwbg.gif?1528293842764

Days 4-5 below:
http://www.wpc.ncep.noaa.gov/qpf/95ep48iwbg_fill.gif?1526306162

Days 6-7 below:
http://www.wpc.ncep.noaa.gov/qpf/97ep48iwbg_fill.gif?1526306162

7 Day Total precipitation below:
http://www.wpc.ncep.noaa.govcdx /qpf/p168i.gif?1530796126

Excessive Rainfall Forecasts.
Mesoscale Precipitation Discussions
Current Day 1 Forecast Valid 12Z 04/22/19 - 12Z 04/23/19 |
Day 1 Threat Area in Text Format
| Day 2 and Day 3 Forecasts |
Current Day 2 Forecast Valid 12Z 04/23/19 - 12Z 04/24/19 |
Day 2 Threat Area in Text Format
Current Day 3 Forecast |
Severe Storm risk
Current Day 1 Outlook | Forecaster: Thompson/Squitieri Issued: 20/1624Z Valid: 20/1630Z - 21/1200Z Forecast Risk of Severe Storms: No Svr Tstms |
Current Day 2 Outlook | Forecaster: Broyles Issued: 20/0546Z Valid: 21/1200Z - 22/1200Z Forecast Risk of Severe Storms: Marginal Risk |
Current Day 3 Outlook | Forecaster: Broyles Issued: 20/0711Z Valid: 22/1200Z - 23/1200Z Forecast Risk of Severe Storms: Marginal Risk |
Current Day 4-8 Outlook |
Current Dew Points
Deep moisture pushed just south of the Ohio River Valley.

Latest radar loop
http://www.nws.noaa.gov/radar_tab.php

| Full resolution version loop (3400x1700 pixels - 2.2mb) |

Go to: Most Recent Image
You can go to this link to see precipitation totals from recent time periods:
https://water.weather.gov/precip/
Go to precipitation, then scroll down to pick a time frame. Hit states to get the borders to see locations better. Under products, you can hit "observed" or "Percent of normal"
+++++++++++++++++++++++++++++++++++++++++++++++
Precipitation compared to average for the last 7, 14, 30 and 60 days.
IT DRIED OUT IN THE CENTRAL BELT BUT IT WILL GET VERY WET THERE THIS WEEK!
Usually not updated for previous day until late the next day.
https://www.atmos.illinois.edu/~snodgrss/Ag_Wx.html


Soilmoisture anomaly:
These maps sometimes take a day to catch up to incorporate the latest data. Still too wet over a large area.
Planting stays stalled out in many places not planted yet for awhile. Will we start to day out after day 10?
https://www.cpc.ncep.noaa.gov/products/Soilmst_Monitoring/US/Soilmst/Soilmst.shtml#
![]()


Currently, there is 0% of the Cornbelt/Midwest with drought. There is no place even slightly dry there.
The market will be keying on precip forecasts for planting concerns for the next month.
https://droughtmonitor.unl.edu/

The ideal time frame for planting corn is the next 2 weeks. The market will be scrutinizing the 2 week forecasts every day.
This operational GFS model product is updated every 12 hours. The GFS is updated every 6 hour but this product is only updated for the 0Z and 12Z run.
The top map is the Canadian ensemble average, the maps below are the individual members that make up the average at the end of week 2.
+++++++++++++++++++++++++++++++++++++++++
Each member is like the parent, Canadian model operational model.......with a slight tweek/variation in parameters. Since we know the equations to represent the physics of the atmosphere in the models are not perfect, its useful to vary some of the equations that are uncertain(can make a difference) to see if it effects the outcome and how.
The average of all these variations(ensembles) often yields a better tool for forecasting. It's always more consistent. The individual operational model, like each individual ensemble member can vary greatly from run to run.........and represent an extreme end of the spectrum at times. The ensemble average of all the members, because it averages the extremes.............from opposite ends of the spectrum.........changes much less from run to run.
End of week 2....................0z ensembles:
Analysis starting from a week ago, ending with today:
Last week+ of analysis, starting with the day farthest in the past. This is an end of week 2 forecast!
Last Monday: Much different picture with the Upper level trough.........on the mean farther west and MUCH less southern stream, especially for individual solutions. Instead of potentially turning much wetter, this solution leans to the dry side. It's 2 weeks out, so not surprising for changes.
Tuesday: Around half the members look impressive with a southern stream trough in the Southwest with the energy aimed northeast. Several have almost the opposite solution. So it would get very wet............or be dry.............leaning wet.
Wednesday: Stronger northern stream, cooler temperatures, especially northern half. Potential for potent southern stream but where will it be aimed? Looks like a bit farther south today, being diverted by northern stream energy to the north.
Thursday: Battle between southern stream and northern stream. Great uncertainty late in week 2, after a very wet period preceding it.
Friday: Same northern stream and southern stream battle with a very wet period until we get well into week 2, then great uncertainty.
Saturday: The mean/average map below looks zonal because the average of some opposite extremes cause it to be that way. Less southern stream on the individual solutions today though and less threat for heavy rains now in week 2 and just afterwards.
Saturday: 12z run at the top here, looks a bit wetter than the 0z run below.
Sunday: Lots of uncertainty but this mornings mean shows the upper level ridge in the Southeast more prominent for the 2nd solution in a row. IF there is an upper level ridge in that position, the chances of very wet weather in the mid section of the country go way up. That feature will act in tandem with an upper trough upsteam in the Southwest to steer a southern stream aimed at locations between them, along with southerly winds on the backside of the high transporting juicy Gulf air northward.
Monday: Similar to yesterday for the mean/average..............wetter than average but some extreme differences in individual solutions. That wide spread causes uncertainty.
Tuesday: Doesn't look as wet to me..........with the southern stream and heaviest rains aimed father south today and well south of the Corbelt for the really heavy stuff.
Wednesday: Looks pretty wet on this model, especially south.
Thursday: Still wet BUT more zonal flow vs southwest flow which has the potential to dry things out more......at least end the threats of excessive rain events as we get more progression.
Friday: The trend from yesterday continues with several solutions breaking the long lived connection from the southern stream to the Plains. This will be modulated by the upper level ridge in the Southeast US. The more the ridge weakens, the better chances become to dry out and for sure it would result in a more progressive flow.
360h GZ 500 forecast valid on May 18, 2019 00 UTC


0Z GFS Ensembles at 2 weeks:
Analysis, starting with the oldest, ending with the most recent:
Last Tuesday: Cut off upper level low to deep trough in Southeast Canada will help some cold fronts to push south of the border. Watching the Southwest US for stronger signal on southern stream.
Wednesday: Battle between northern stream with cool air in the northern US and southern stream with moisture and the threat of excessive rains from the south.
Thursday: Southern stream looks stronger/wetter.
Friday: For sure a very wet period leading up to late week 2, which is the period for these maps. Will it continue?
Saturday: This model still looks pretty wet late in week 2 on many of the solutions.
Sunday: Majority look wet. Biggest disparity, especially in the East.
Monday: Looks pretty wet with an upper level ridge in the Southeast and trough in the West with some southern stream..........on many solutions.
Tuesday: Much drier today. Not as many solutions with much southern stream. Almost half of them shut it down completely.
Wednesday: Half of the solutions have a very wet southern stream, especially in the S.Plains. The ensemble mean for the European model, however is MUCH drier than this.
Thursday: Upper level low in Southeast Canada a dominant feature on many solutions means chilly weather in the Northeast to Midwest..........cutting off the deep moisture so precip not as heavy there.
Friday: Solutions all over the place today for late week 2. Some turn drier, some stay wet.

Ensemble mean(average of all the individual solutions above)
Last Friday: Positive anomaly in N/C Canada and negative anomaly in Southeast Canada is a cold couplet dynamic for much of the Midwest and East. How much southern stream moisture pushes into that is not clear late in week 2. The northern stream could suppress the deeper moisture pretty far southwest.
Saturday: Anomalies are weaker today. Still the negative one Southeast Canada, so chilly in the Upper Midwest/Northeast.
Sunday: Strong positive anomaly in the East today that was not there yesterday suggests very wet Plains/Midwest with potent southern stream aimed in that direction. There were a couple of extreme individual solutions that contributed to the positive anomaly though, so the majority don't concur.
Monday: Positive anomaly in the East not as strong but the negative anomaly in the Southwest is significant for modulating the southern stream which should be aimed toward the Plains/Midwest.
Tuesday: No positive anomaly in the East today, so less ridging there, so the negative anomaly in the Southwest doesn't have the couplet connection to steer moisture as strongly northward into the Plains/Midwest. Negative anomaly in Southeast Canada should help steer some northern stream chill south of the border.
Wednesday: Positive anomaly over the Great Lakes today. Still a negative anomaly over the Southwest.
Thursday: Positive anomaly over Northern Canada good for cool northern stream connection below it. Still a negative anomaly over the southwest associated with the southern stream...........which may get suppressed a bit by the northern stream.
Friday: Still a positive anomaly over Northern Canada that favors a cold connection to the south, into the US but its shifting farther a bit northwest late in week 2(that might not mean a lot so far out). Still a negative anomaly in the Southwest which keeps the southern stream potential alive. Upper level ridging in the Southeast or not will determine that.
NCEP Ensemble t = 360 hour forecast 
Latest, updated graph/forecast for AO and NAO here, including an explanation of how to interpret them.
Previous analysis, with the latest day at the bottom for late week 2 period.
Monday: NAO dips negative and is a factor in potential cooling in the Upper Midwest/Northeast.
Tuesday: Negative NAO will steer some cooler air into the Northern Tier. Also a negative PNA, so the cool air will not go to far south.
Wed: Negative NAO will brings cooler northern stream energy/air masses into the Northern tier. How far south can it divert the potent southern stream? The cool air from the north, will probably be overlapped by the moisture coming up from the south in the battle zone between the northern stream and southern stream.
Thursday: Negative NAO and cool along the northern tier. Also a bit of a negative AO and positive PNA can potentially assist in that cooling......during week 2 but tremendous uncertainty late in that period.
Friday: Negative AO and especially negative NAO strongly favor chilly air pushing south out of Canada. PNA increases late in the period that favors that, with potential to shut down the moisture.
Saturday: AO recovers back to near 0. The pretty negative NAO, bounces back to 0 at the end of 2 weeks. PNA increases a great deal into positive territory at the end of 2 weeks.
Sunday: AO around 0, NAO rebounds from negative to near 0 at the end of week 2 and PNA turns positive.
Monday: AO now drops below 0. NAO recovers from negative territory to near 0, same with PNA.
Tuesday: AO drops well below 0. NAO recovers from negative to near zero, same with PNA.
Thursday: Solidly negative AO and NAO forbode some late season chilly weather south of the Canadian border. PNA close to 0.
Friday: Still solidly negative AO and NAO tell us that cold air from higher latitudes in Canada will be flushed south into the middle latitudes, south of the US border. This moderates on these indices late in week 2 as they increase a bit. PNA is near 0 still.
National Weather Service 6-10 day, 8-14 day outlooks.
We might see additional drying from the north on future forecasts.
Temperature Probability | |
Precipitation Probability | |
| the 8-14 day outlooks ArchivesAnalogsLines-Only FormatGIS Data | |
Temperature Probability | |
 | |
This is the latest week 3-4 forecast. Cool but drier, especially in the far north.
| Please provide comments using the online survey. | ||
Temperature Probability | Precipitation Probability (Experimental)  | |
