
Thanks very much Mike!
I know we've had this discussion before and it doesn't matter if you call it a unicorn flag, the trading community almost universally refers to that formation as a bull flag.
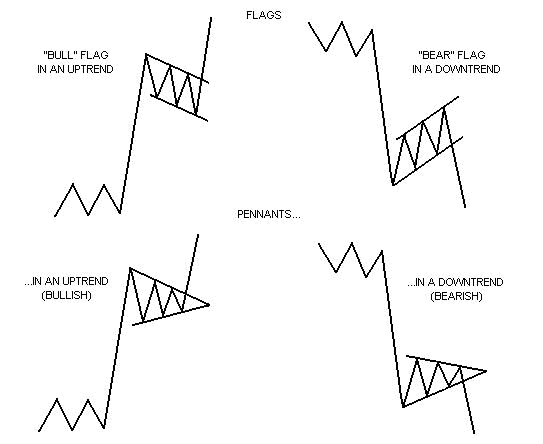
Flags are "potential" continuation patterns of either an uptrend or downtrend. They are just pauses in the direction of the trend. The break out from the flag formation in the same direction of the trend, confirms it.
Since gold is not in a down trend, by definition, that can't be a bear flag...........even if we broke out lower, below the flag formation. If that happened, it would be more or a double top with the February highs.
We do however, have 3 examples of bear flag type formations on the chart that you showed. Late March(which couldn't make new lows) then April, that did make new lows and confirmed, then a bear flag formation that held support numerous times in April and May and the support ended up being our bottom........a triple bottom.
Of course reading charts can be very subjective, especially with regards to expectations of where prices are headed next. Where do you think gold is headed next? (I don't trade metals).
![]()
https://www.chartpatterns.com/flagsandpennants.htm

here are my targets based on the low of the last daily trading bar inside the flag - $1335
The stock market corrected,The Mexican Tariff news,stocks are going up,Gold is selling off
$1335 - 1.5% = 1314
$1335 - 3% = 1294
$1335 - 4% = 1281
$1335 - 5% = 1268
OK, so you think it's a top, so I get why you call it a "bear" flag.
Thanks Mike.
I post this formation a lot. If it points up,the market corrects down. If it points down,the market corrects to the upside. The best way I can explain,its exhaustion type pattern.
People are hedging with Gold based on the news with tariffs.This evening they will realize the stock market correction is over,the Mexican tariffs are over,they should be in stocks ,not gold.
Buy some puts in the ETF (GLD)
Great thoughts Mike!
GC opened lower at 1335.8 and that was the high of the session so far. That's always a good sign.
We are 1333.6 at the moment, close to the lows.
Hi Mike
I refer to those formations as more an ending diagonal but still having the same possible results as you predict and it sure seems to work for you as well as any predictable tech formation does. Thanks.
Hey, has the water weather eased up for you a bit? We actually can call this normal early Summer weather here in coastal NJ.
John
PS- not trading gold or following much for that matter but sure do appreciate some tech talk.
Thanks John,
After a bounce to just above the open/highs to 1336.5, we've sold off to new lows this evening below 1329 now.
So that bearish formation that you recognized earlier Mike, is trying to confirm for you this evening.
It was a sunny, beautiful weekend. Today,here we go again,calling for over an inch of rain in twelve hours.
Thanks Mike,
I was using June Gold and realized(I don't trade metals) that I need to update to the August.\
GCQ has had a high of 1352.7 and low of 1329.0 and is at 1331.0 near the low.