From NewsBlaze:
https://newsblaze.com/issues/environment/foolish-health-professionals-climate-change_158005/
"Last week, the majority of the continental US was caught in a heat wave. About 85 percent of the population experienced daily high temperatures of over 90 degrees Fahrenheit and more than half saw temperatures of over 95oF. But these temperatures were far below state record high temperatures of past decades.
History shows that the warmest US decade on record was the 1930s, long before industry emitted significant amounts of carbon dioxide. According to the National Oceanic and Atmospheric Administration (NOAA), 23 of the 50 state record high temperatures were recorded during the 1930s. Thirty-six of the 50 state record highs occurred prior to 1960."
metmike: Heat waves like we saw last week lasted all Summer long and with temperatures peaking 10 degree hotter than last week during numerous Summers during the 1930's,
This indicator describes trends in unusually hot and cold temperatures across the United States.

Anthony Watts / 2 days ago July 23, 2019
https://wattsupwiththat.com/2019/07/23/some-perspective-on-the-massive-heatwave-in-the-usa/
Many of us saw the exaggerated headlines about the “massive heat wave” gripping the USA over the past weekend of 20-21 July 2019:
https://www.cbsnews.com/live-news/heat-wave-2019-extreme-heat-advisory-warning-deaths-latest-weather-forecast-us-nyc-2019-07-20/

"Well , there is an explanation, it’s called mid-summer.
Climatologically speaking, the two warmest days of the year were this past weekend: July 20 and 21."
1. From everything I've seen, GW has affected lows more than highs. Therefore, I'd like to see the number of record high lows in the 2010s vs the 1930s. Or better yet, I'd like to see the average low of the 1930s vs the average low since 2010.
2. Related to #1, I've been following your daily temperature anomaly maps since last year and have noticed and even pointed out that the average anomaly for minimums has been quite a bit higher than that for maximums.
3. I'd like to see the average dewpoint of the 2010s vs that of the 1930s. I suspect they're higher, partially related to increased vegetation. Also, ocean temps then vs now.
4. As we know, the US is but a very small % of the entire land area of the globe. Nevertheless, it does appear that the 1930s was a warm decade. But is it warmer than the 2010s globally? I doubt it but don't know for sure.
Hi Larry,
Yes, great points as usual. We had at least one discussion on night time lows being warmer much more than the highs. The warming has been greatest in the coldest places(highest latitudes/Arctic) at the coldest times of year(Winter) and the coldest time of day(nights).
By a wide margin lows at night have been warmer than highs vs average, which in the Midwest, have actually seen a cooling trend the last 30 years in the Summer. If I can find those discussions I'll repost them.
For sure global temperatures were cooler in the 1930's than right now and the US is a small place geographically compared to the rest of the planet and this was not intended to be applied to anywhere but the US............because that's where this last heat wave was last week that got all the hoopla.
I'm certain that lows in the Summers of 1930's were still much higher than lows in any recent years, with 2012 possibly rivaling some of those hot years at night only(probably not hotter than 1936 was at night)
Dew points, without a doubt are higher now. Ocean temps being warmer are a huge factor. It's sort of like having an El Nino...........year round and on all the oceans compared to 100 years ago.
Massive increases in vegetation are a huge factor too like you stated. Evapotranspiration in the cornbelt from cornplants that are packed twice as dense as 40 years ago have created a micro climate during the growing season across a huge that is re cycling moisture and helping to make rain making systems more efficient and minimizing risks for drought.
Going from 1988 to 2012, 24 growing seasons, without a widespread severe drought in the Midwest smashed the record amount of time between droughts.
Of course warming the global temperature by 1 deg. C allows the atmosphere to hold around 6% more moisture, which also has increased heavy rains, including adding to totals in some hurricanes and this Spring could have made it wetter.
It didn't cause the weather systems or cause the hurricanes but makes them a bit wetter. Fortunately, it drought, by a wide margin that reduces yields much more than too much rain. This year and 1993 are the 2 noteworthy exceptions in the highest producing area of the world, the US Cornbelt.
Here is a look at daily highs verse daily lows. I think we have seen this graph before but I thought I would put it back as it helps with the current discussion. This would be expected with added moisture in the air from warmer temperatures. As we have stated before more vegetation is adding to low level moisture through evapotransportation. I think another big impact is urban expansion. As cities get bigger and bigger, the heat island they produce does as well. I typical winter night here in Missouri we will see small towns drop down in the upper teens and lower 20s while St. Louis only falls to around 30 degrees. All the sensors close to St. Louis are warmer than the surrounding small towns. I have not researched this however, I imagine in the late 1800s and early 1900s St. Louis saw many more night time lows in the teens and 20s than they do now. When we see strong cold air advection accompanied by winds the temperatures are more uniform. But on calm nights with ideal radiational cooling, there are huge differences, not only here but everywhere.
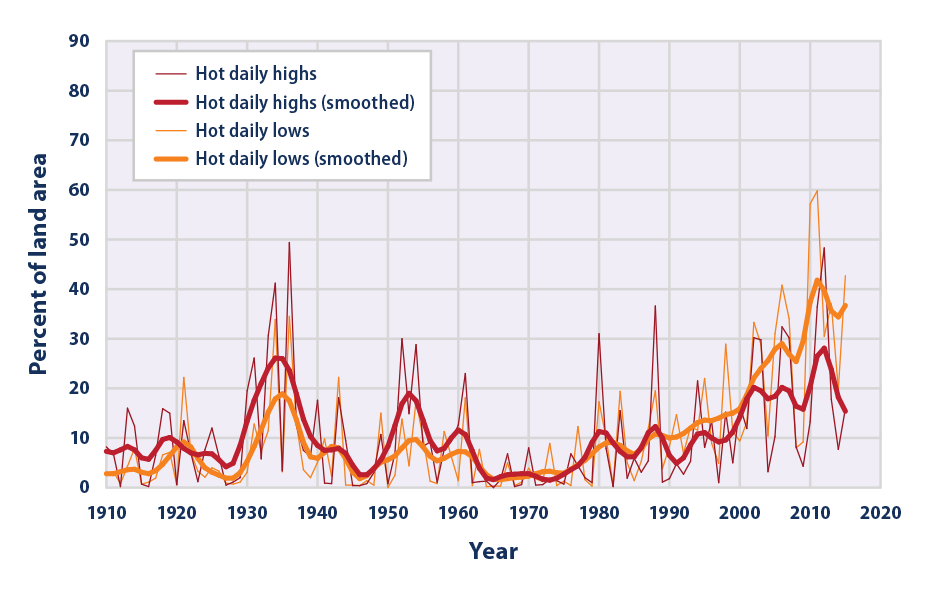
Thats a great graph that really shows it grant.
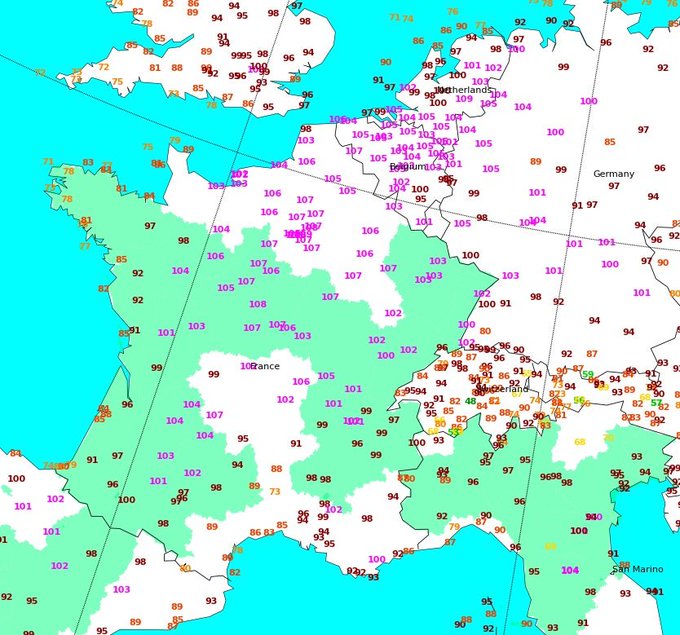
Paris just had a new all-time hottest on record of 109, which shatters the old record of 105! Numerous records have been shattered all over Europe.
Highs today in France and nearby areas (in deg. F; corn growing areas shaded) 3rd straight day of 100+ degree heat; Paris reached 108 Cooler tomorrow with most spots 30+ degrees cooler than today by Saturday
·
Highs today in France w/major corn areas shaded; 2nd straight day of widespread 100+ degree temps Tomorrow might be the very hottest day of the week before temperatures turn sharply cooler
High temperatures today in France and nearby areas (degrees F; main corn growing areas shaded) Similar heat expected for tomorrow and Thursday