Residential cooling demand via electricity generated by burning natural gas, has just passed its seasonal peak(based on historical averages). It's the most important market trading item with potential for big changes because of changes in the weather forecast(cooling degree days)
July is usually a weak month for natural gas prices and storage has been making huge gains but we had some near record cooling demand earlier this month which temporarily lifted natural gas prices............but the market looks ahead and the cooler weather since then and outlooks for no sustained heat has caused ng prices to fall back to life of contract lows.
Monday Weather:
https://www.marketforum.com/forum/topic/35517/
Friday Weather: Much cooler than the last 2 days!
https://www.marketforum.com/forum/topic/35870/
Saturday Weather:
https://www.marketforum.com/forum/topic/35959/
Previous weekly discussions on natural gas here(dang, this is getting to be long list)
https://www.marketforum.com/forum/topic/35104/
https://www.marketforum.com/forum/topic/34604/
https://www.marketforum.com/forum/topic/34053/
https://www.marketforum.com/forum/topic/33668/
https://www.marketforum.com/forum/topic/33132/
https://www.marketforum.com/forum/topic/32675/
https://www.marketforum.com/forum/topic/32177/
https://www.marketforum.com/forum/topic/31521/
https://www.marketforum.com/forum/topic/31099/
https://www.marketforum.com/forum/topic/30641/
https://www.marketforum.com/forum/topic/30007/
https://www.marketforum.com/forum/topic/29419/
https://www.marketforum.com/forum/topic/28858/
https://www.marketforum.com/forum/topic/28351/
https://www.marketforum.com/forum/topic/27780/
https://www.marketforum.com/forum/topic/27305/
https://www.marketforum.com/forum/topic/26861/
https://www.marketforum.com/forum/topic/26506/
https://www.marketforum.com/forum/topic/26105/
https://www.marketforum.com/forum/topic/25678/
https://www.marketforum.com/forum/topic/25189/
https://www.marketforum.com/forum/topic/24662/
Last week's EIA +36 BCF From Natural Gas Intelligence:
‘Neutral’ EIA Report Sends Natural Gas Futures a Few Pennies Lower
11:18 AM
The Energy Information Administration on Thursday reported an on-target 36 Bcf weekly injection into U.S. natural gas stocks, and futures
| Historical Comparisons | |||||||||||||||||||||||||
| Stocks billion cubic feet (Bcf) | Year ago (07/19/18) | 5-year average (2014-18) | |||||||||||||||||||||||
| Region | 07/19/19 | 07/12/19 | net change | implied flow | Bcf | % change | Bcf | % change | |||||||||||||||||
| East | 575 | 561 | 14 | 14 | 524 | 9.7 | 604 | -4.8 | |||||||||||||||||
| Midwest | 650 | 627 | 23 | 23 | 522 | 24.5 | 656 | -0.9 | |||||||||||||||||
| Mountain | 151 | 147 | 4 | 4 | 145 | 4.1 | 172 | -12.2 | |||||||||||||||||
| Pacific | 271 | 268 | 3 | 3 | 256 | 5.9 | 294 | -7.8 | |||||||||||||||||
| South Central | 921 | 929 | -8 | -8 | 823 | 11.9 | 994 | -7.3 | |||||||||||||||||
| Salt | 229 | 246 | -17 | -17 | 217 | 5.5 | 276 | -17.0 | |||||||||||||||||
| Nonsalt | 692 | 683 | 9 | 9 | 605 | 14.4 | 718 | -3.6 | |||||||||||||||||
| Total | 2,569 | 2,533 | 36 | 36 | 2,269 | 13.2 | 2,720 | -5.6 | |||||||||||||||||
Totals may not equal sum of components because of independent rounding. | |||||||||||||||||||||||||
Working gas in storage was 2,569 Bcf as of Friday, July 19, 2019, according to EIA estimates. This represents a net increase of 36 Bcf from the previous week. Stocks were 300 Bcf higher than last year at this time and 151 Bcf below the five-year average of 2,720 Bcf. At 2,569 Bcf, total working gas is within the five-year historical range.
For information on sampling error in this report, see Estimated Measures of Sampling Variability table below.

Note: The shaded area indicates the range between the historical minimum and maximum values for the weekly series from 2014 through 2018. The dashed vertical lines indicate current and year-ago weekly periods.
Latest Release Jul 25, 2019 Actual 36B Forecast 37B Previous 62B
https://www.investing.com/economic-calendar/natural-gas-storage-386
| Release Date | Time | Actual | Forecast | Previous | |
|---|---|---|---|---|---|
| Aug 01, 2019 | 10:30 | ||||
| Jul 25, 2019 | 10:30 | 36B | 37B | 62B | |
| Jul 18, 2019 | 10:30 | 62B | 65B | 81B | |
| Jul 11, 2019 | 10:30 | 81B | 73B | 89B | |
| Jul 03, 2019 | 12:00 | 89B | 85B | 98B | |
| Jun 27, 2019 | 10:30 | 98B | 101B | 115B |
Here are the 7 days for the EIA report released last Thursday. Extreme heat across much of the country.........Midwest to East Coast where alot of people live and use air conditioning.
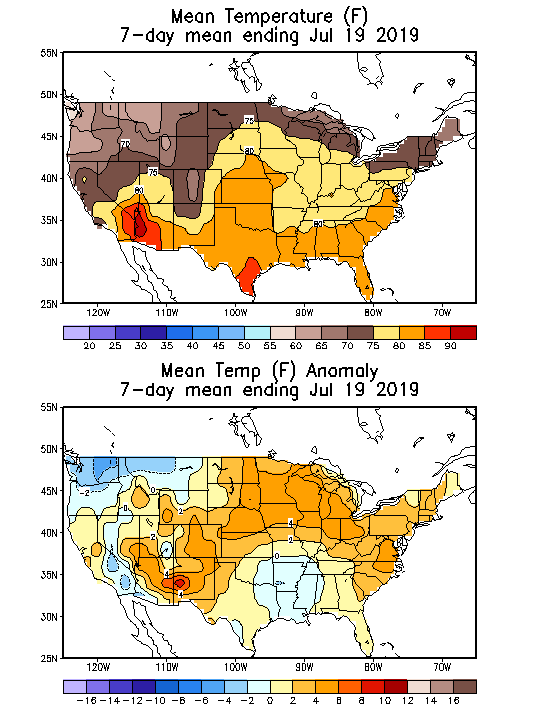
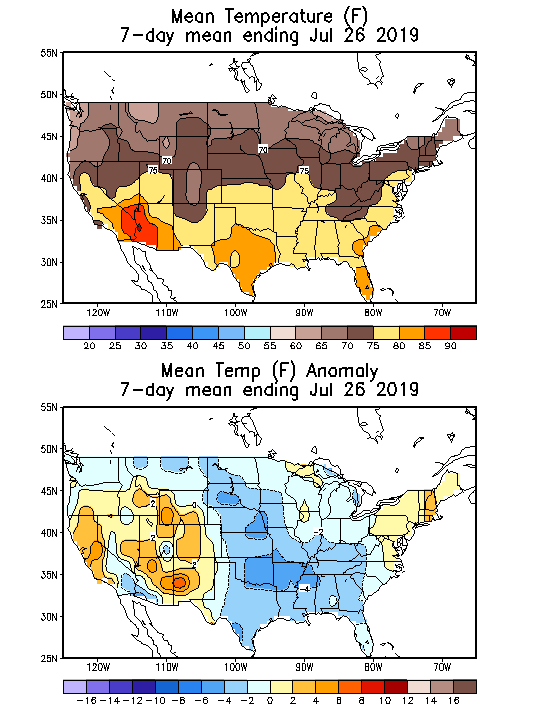
Here is the temperature map for the 7 days, ending last Friday that will go into this Thursday's EIA report.
MUCH cooler, so the injection will be MUCH higher.
The dominant imposing factor for prices this year has been massive, record large injections that have increased supplies faster than any time in history and crushed prices.
The first 2 weeks of July, however featured increasing heat in the extended forecasts, so natural got a huge lift. Cooler forecasts after that has sent prices crashing back to life of contract lows set on June 20th, just above 2.1 for the September contract, which is now the front month.
The market will be reacting to changes in the cooling degree day forecasts thru the rest of the Summer. Widespread, sustained heat needs to return to the forecast if prices have hope of rebounding again.
Cash prices have been below $2, so it's possible that we can still go lower than this, especially if we are cool in August.
NG 7 days
Natural gas 3 months below
This seasonal price chart below is for 2 decades, ending back in 2009.
This shows that natural gas has a strong historical tendency to go up after mid February to mid June. This years extraordinary, contra seasonal plunge lower has been the result of super duper, huge, injections...records by a wide margin........ that have provided numerous bearish surprises and crushed prices. Cash prices during this period have been below $2 at times. We are now in a time frame when ng seasonals become very negative, from mid/late June thru August.
Widespread, intense heat in the forecast gave us an early July, contra seasonal bounce that vanished quickly when the forecasts turned cooler.
 Seasonal Chart")
From Natural Gas Intelligence after the close on Monday:
NatGas Bulls ‘Running Out of Summer’ as August Slides into Expiry
5:31 PM
Natural gas bulls hoping for a spark from the latest forecasts came away disappointed Monday, as cooler trends combined with bearish underlying fundamentals to send the August contract falling into expiry. In the spot market, a hot start to the week for the East Coast spurred modest gains at locations throughout the region; the NGI Spot Gas National Avg. added 1.5 cents to $1.985/MMBtu.
From Natural Gas Intelligence Tuesday Morning:
Forecasts Mixed, Recent ‘Cooler Momentum’ Slows as Natural Gas Futures Steady
NGI after the close Tuesday:
Natural Gas Futures Post Small Gain, but Weather ‘Still Isn’t Nearly Hot Enough’
5:29 PM
Natural gas futures traded both sides of even before nudging higher Tuesday as the bears, taking in a mix of changes to the latest weather outlook, paused for a breather. In the spot market, maintenance wreaked havoc on prices in the Midcontinent and West Texas; the NGI Spot Gas National Avg. dropped 3.0 cents to $1.955/MMBtu.
From NGI earlier this morning:
Natural Gas Futures Gain Early on ‘Notable Jump’ in Weather-Driven Demand Outlook
metmike: Are the lows in? Double bottom? With hotter forecasts, short term lows might be in.
From NGI after the close on Wednesday:
Bulls Finding Solace in Summer’s Dog Days; Natural Gas Futures Rally Big
5:46 PM
With the end of summer fast approaching, natural gas bulls seized their moment Wednesday as a hotter forecast helped to rally prices off a key support level. In the spot market, Gulf Coast prices followed futures higher; the NGI Spot Gas National Avg. climbed 4.5 cents to $2.000/MMBtu.
From NGI Thursday morning:
Natural Gas Bulls Keep Charging in Early Trading as Rebound Continues; Forecasts Little Changed
EIA +65 BCF Bearish!
| Working gas in underground storage, Lower 48 states Summary text CSV JSN | |||||||||||||||||||||||||
|---|---|---|---|---|---|---|---|---|---|---|---|---|---|---|---|---|---|---|---|---|---|---|---|---|---|
| Historical Comparisons | |||||||||||||||||||||||||
| Stocks billion cubic feet (Bcf) | Year ago (07/26/18) | 5-year average (2014-18) | |||||||||||||||||||||||
| Region | 07/26/19 | 07/19/19 | net change | implied flow | Bcf | % change | Bcf | % change | |||||||||||||||||
| East | 597 | 575 | 22 | 22 | 548 | 8.9 | 625 | -4.5 | |||||||||||||||||
| Midwest | 677 | 650 | 27 | 27 | 548 | 23.5 | 677 | 0.0 | |||||||||||||||||
| Mountain | 156 | 151 | 5 | 5 | 146 | 6.8 | 174 | -10.3 | |||||||||||||||||
| Pacific | 270 | 271 | -1 | -1 | 250 | 8.0 | 294 | -8.2 | |||||||||||||||||
| South Central | 934 | 921 | 13 | 13 | 809 | 15.5 | 987 | -5.4 | |||||||||||||||||
| Salt | 226 | 229 | -3 | -3 | 207 | 9.2 | 268 | -15.7 | |||||||||||||||||
| Nonsalt | 708 | 692 | 16 | 16 | 602 | 17.6 | 719 | -1.5 | |||||||||||||||||
| Total | 2,634 | 2,569 | 65 | 65 | 2,300 | 14.5 | 2,757 | -4.5 | |||||||||||||||||
Totals may not equal sum of components because of independent rounding. | |||||||||||||||||||||||||
Working gas in storage was 2,634 Bcf as of Friday, July 26, 2019, according to EIA estimates. This represents a net increase of 65 Bcf from the previous week. Stocks were 334 Bcf higher than last year at this time and 123 Bcf below the five-year average of 2,757 Bcf. At 2,634 Bcf, total working gas is within the five-year historical range.
For information on sampling error in this report, see Estimated Measures of Sampling Variability table below.
+65 BCF vs 57 BCF forecast
| Release Date | Time | Actual | Forecast | Previous | |
|---|---|---|---|---|---|
| Aug 01, 2019 | 10:30 | 65B | 57B | 36B | |
| Jul 25, 2019 | 10:30 | 36B | 37B | 62B | |
| Jul 18, 2019 | 10:30 | 62B | 65B | 81B | |
| Jul 11, 2019 | 10:30 | 81B | 73B | 89B | |
| Jul 03, 2019 | 12:00 | 89B | 85B | 98B | |
| Jun 27, 2019 | 10:30 | 98B | 101B | 115B |
From Natural Gas Intelligence:
| Bearish EIA Storage Miss Brings Abrupt Halt to Natural Gas Futures Rally Aug 01 2019 The Energy Information Administration (EIA) on Thursday reported a 65 Bcf weekly injection into U.S. natural gas stocks, on the high side of estimates, dealing a swift blow to surging futures prices. |
From NGI after the close on Thursday:
Wild Ride for Natural Gas Futures After Tetco Explosion, Bearish EIA Number
5:36 PM
A roller coaster day of trading saw natural gas futures careen lower Thursday after a larger-than-expected inventory build erased an initially bullish response to...
From NGI this morning:
NatGas Futures, ‘Gyrating Like a Young Freddie Mercury,’ Called Sharply Lower
NGI comments after the close on Friday:
Loose Balances, Cooler Weather See NatGas Futures Stumble to Close Out Volatile Week
6:38 PM
After rallying briefly earlier in the week, natural gas futures came crashing back down Friday, selling off sharply amid moderate forecasts and signs of ample supply. Spot prices mirrored the downward move in the futures market, with double-digit discounts across most of the Lower 48; the NGI Spot Gas National Avg. tumbled 19.0 cents to $1.840/MMBtu.
Sat wx updated