http://www.drroyspencer.com/2019/08/uah-global-temperature-update-for-july-2019-0-38-deg-c/
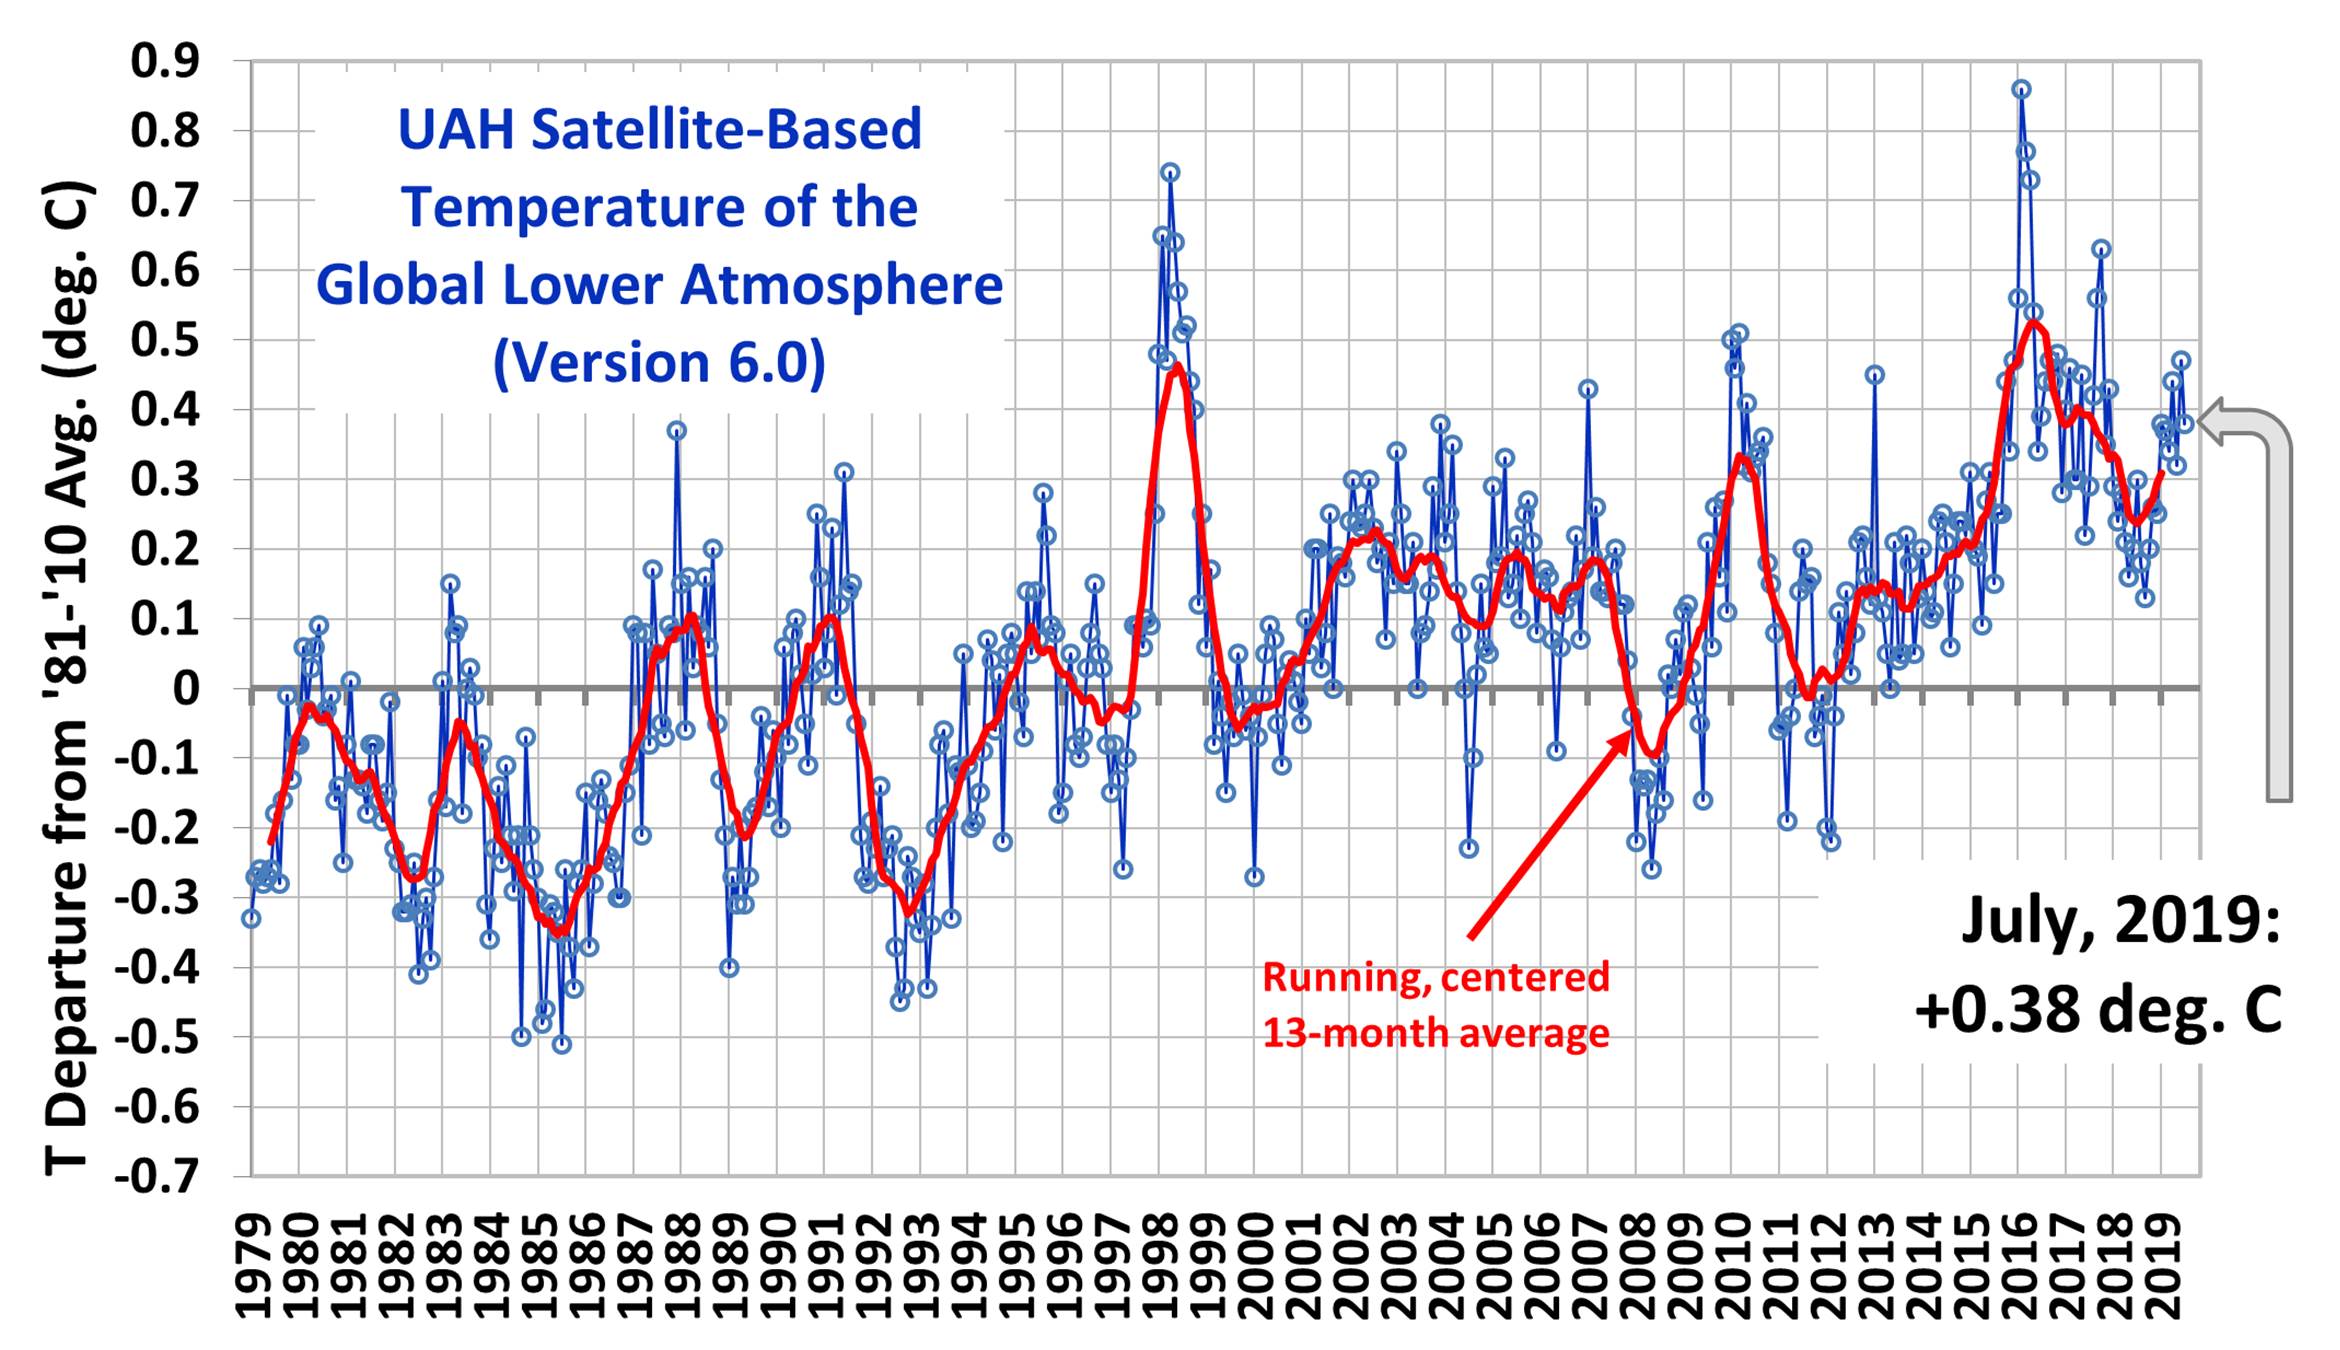
The linear warming trend since January, 1979 remains at +0.13 C/decade.This is +1.3 deg./century.
The slight, mostly beneficial global warming continues. Yeah, in the hottest month of the year, July it's not beneficial but the positives continue to outweigh the negatives by a wide margin overall across the planet.
August 2nd, 2019 by Roy W. Spencer, Ph. D.
http://www.drroyspencer.com/2019/08/july-2019-was-not-the-warmest-on-record/
"We are now seeing news reports (e.g. CNN, BBC, Reuters) that July 2019 was the hottest month on record for global average surface air temperatures.
One would think that the very best data would be used to make this assessment. After all, it comes from official government sources (such as NOAA, and the World Meteorological Organization [WMO]).
But current official pronouncements of global temperature records come from a fairly limited and error-prone array of thermometers which were never intended to measure global temperature trends. The global surface thermometer network has three major problems when it comes to getting global-average temperatures:"
The plot of surface temperature departures from the 1981-2010 mean for July 2019 shows a global average warmth of just over 0.3 C (0.5 deg. F) above normal:
http://www.drroyspencer.com/2019/08/july-2019-was-not-the-warmest-on-record/
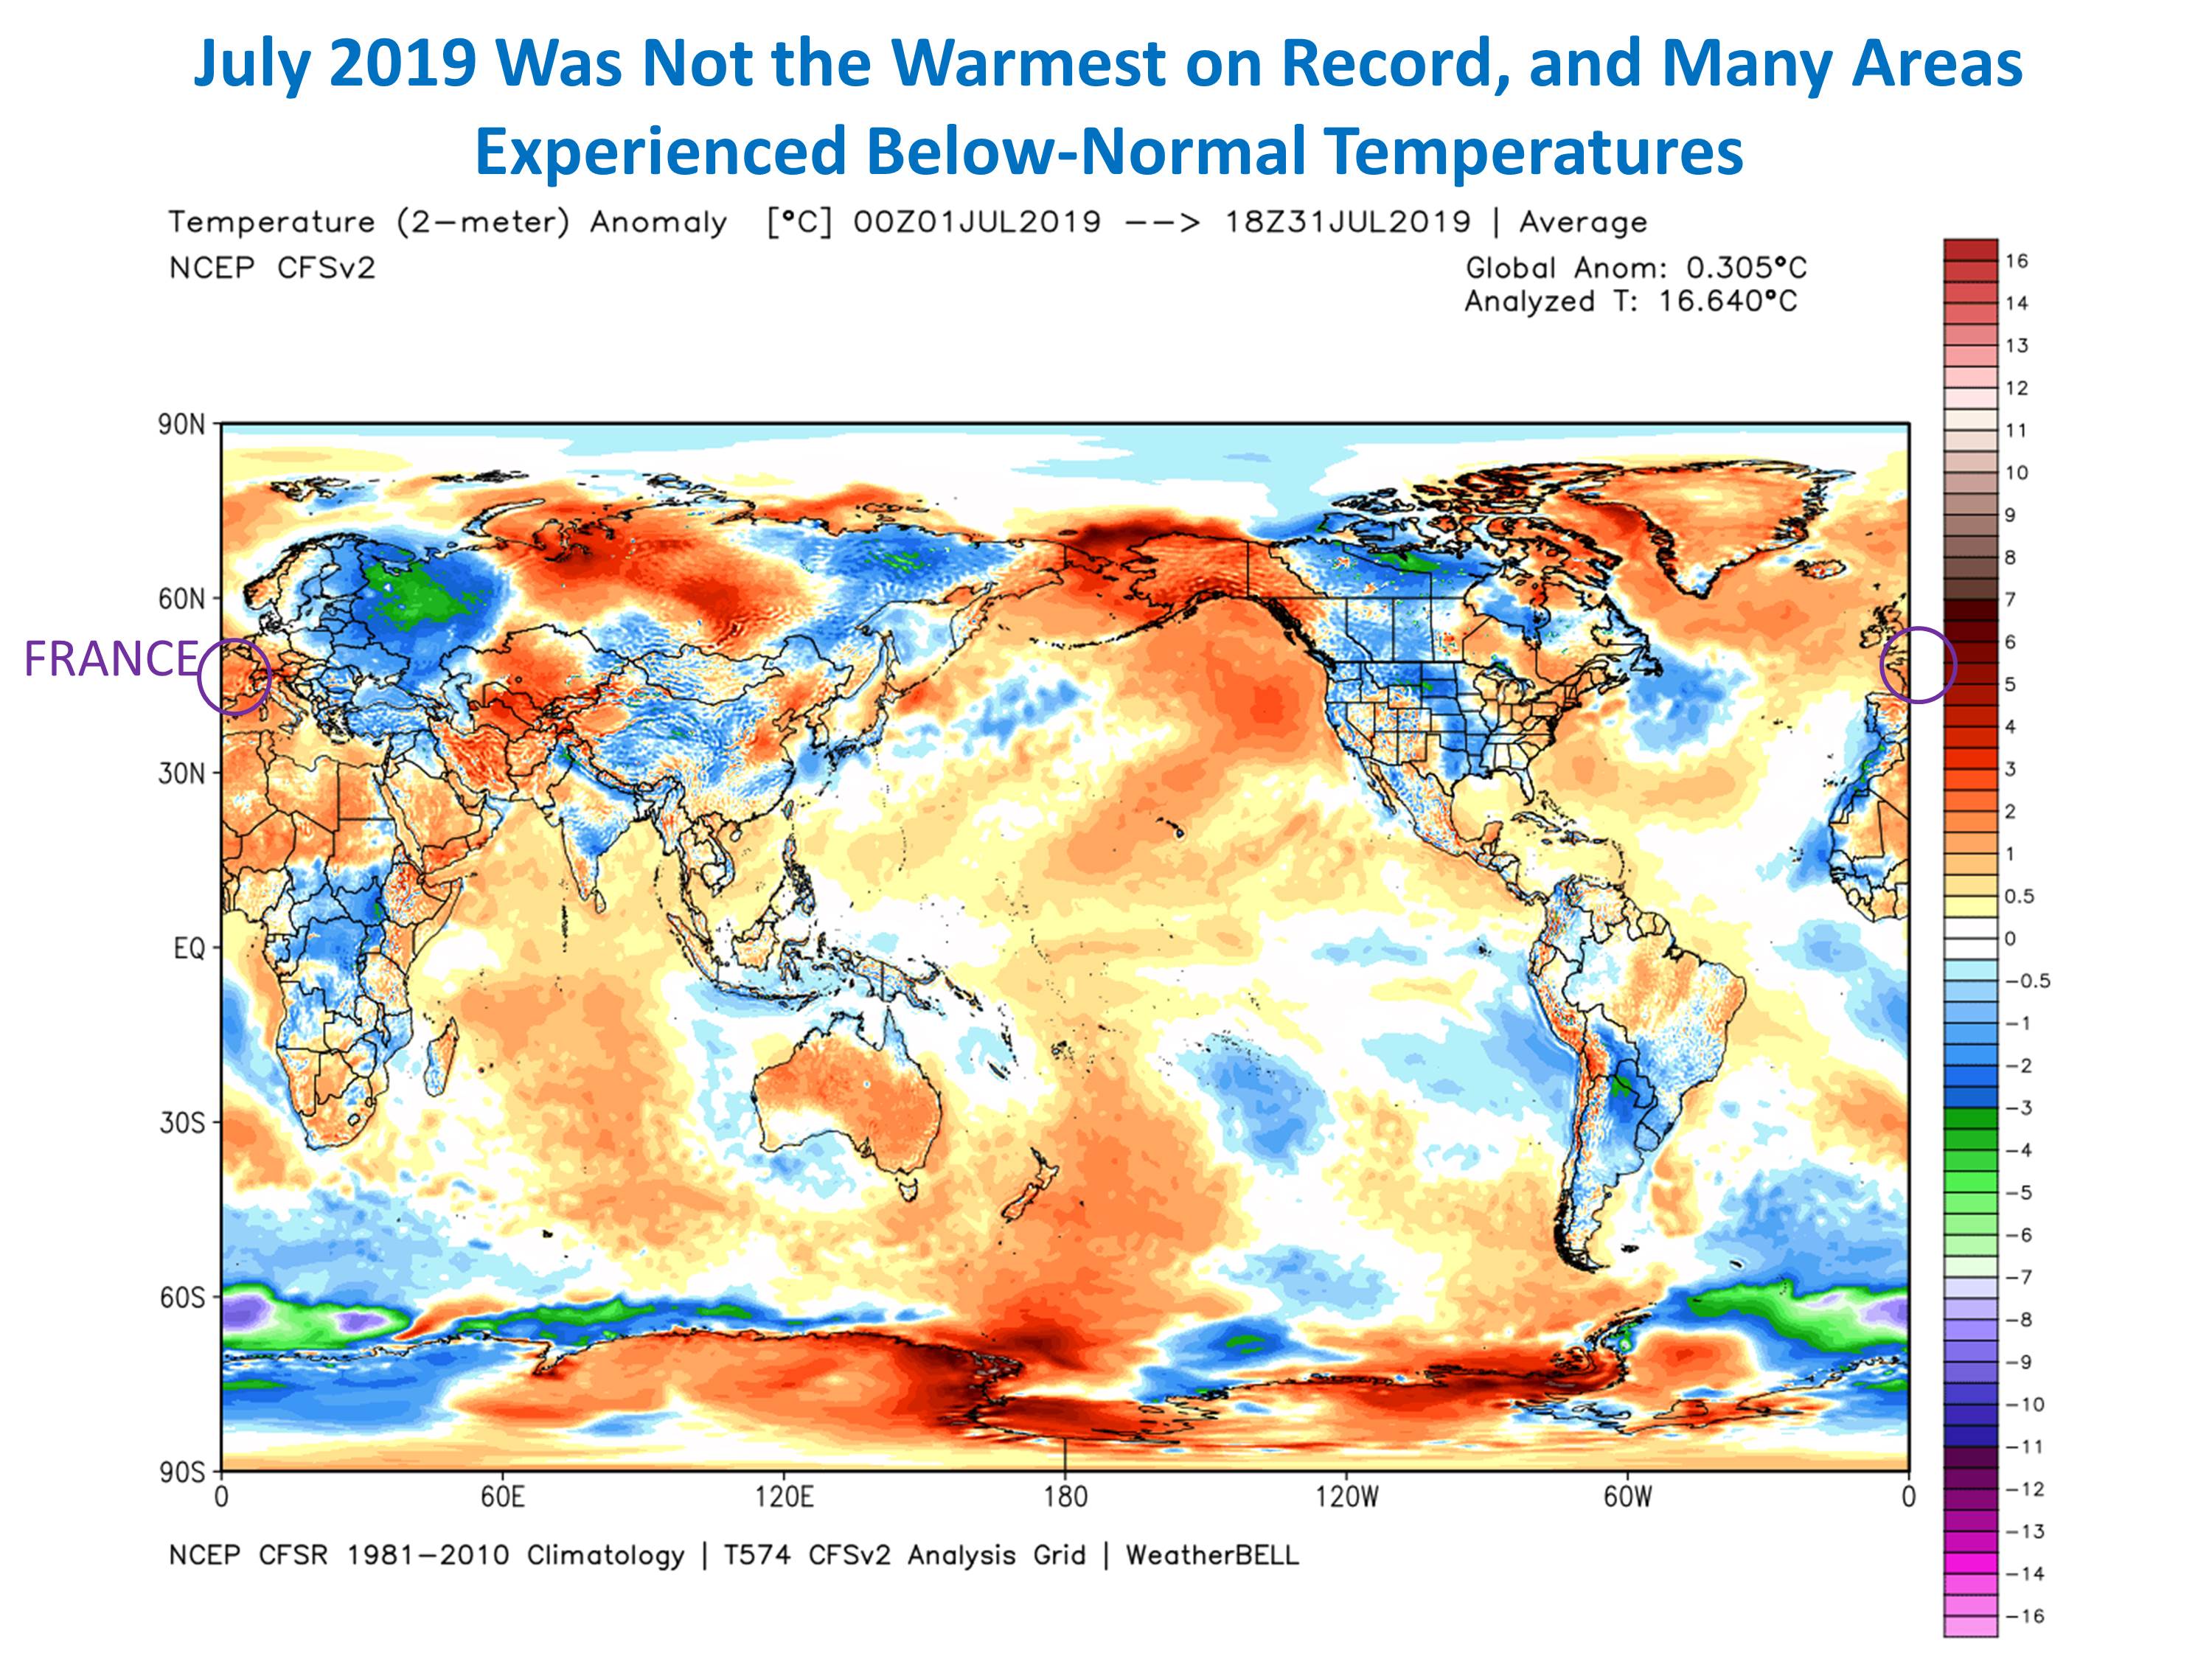
Note from that figure how distorted the news reporting was concerning the temporary hot spells in France, which the media reports said contributed to global-average warmth. Yes, it was unusually warm in France in July. But look at the cold in Eastern Europe and western Russia. Where was the reporting on that? How about the fact that the U.S. was, on average, below normal?
Hey Mike,
Great stuff! When I saw that Weather Bell’s CFSv2 map had a good portion of the US cooler than normal in July, my immediate reaction was surprise. I’ve looked further into it and now think that map’s anomalies are deceptively overall too cold. I will write further about this with specific examples for July showing something’s fishy when I get some more time. When I say deceptively, I’m not saying WxBell was necessarily intentionally trying to deceive as it MAY be due to the way the CFSv2 calculates the 1981-2010 anomaly. But I do leave open the possibility that Weather Bell knows it is deceptive and due to an agenda is more than happy to show the map without explaining it and why it is so cool.
Thanks Larry!
https://www.cpc.ncep.noaa.gov/products/tanal/temp_analyses.php
| About the Analyses | ||
| DATA SOURCE: River Forecast Centers ~5000 stations per day, including ~1500 stations from the Hydrologic Automated Data System (except above 5km altitude), and Climate Assessment Data Base ~several hundred stations per day. Climatologies used to calculate the anomalies were updated to use the 1981-2010 climatology dataset as of August 5, 2011. | ||
Mike,
Here’s a followup. I looked at numerous US cities’ July, 2019, mean anomalies starting with some in SD and NE. Then when they almost all came in warmer than that CFSv2 showed, especially in the eastern halves of those states, I decided to expand my analysis to cities in states such as MN, IA, IL, AZ, CO, LA, AR, TN, MS, AL, GA, FL, and the Pacific coast states. I made sure I was comparing apples to apples such as making sure the normals were based on 1981-2010 and I converted from F to C. I found only a very small % that were close, mainly in AR (where the coolness verified pretty well) and FL (Gainesville did come in near -0.5 F)...so pretty close there. But the vast majority came in 1-2 F or even warmer than the CFSv2 map showed!
After seeing this, I found out from Radiant/Maxar that Moscow came in 3.6 cooler than its 1981-2010 normal. If you look closely at the map, Moscow is on the edge of the green. The edge of the green is -3 C or -5.4 F. Comparing the -5.4 F suggested by the map to the actual of -3.6 F tells me that even at Moscow it is close to 1.8 F too cool!
When you get a chance, check for yourself rather than take my word for it. Why is this so important? Because WxBell is essentially claiming based on this CFSv2 map that the globe was only 0.305 C warmer than the 1981-2010 globe average. But if one were to adjust for the average error in the too cool direction, the actual could very easily be more like 1 F warmer than +0.305 C. If so, that would bring the actual anomaly closer to +1 C vs 1981-2010 normals! Even if the average error in the map were only 0.5 F too cool, that would still be enough to warm the anomaly from +0.305 C to near +0.55 to +0.60 C. This is a big deal to me and should be investigated. I do not trust Weather Bell at all.
Thanks much Larry, good homework.
I'll take a look at that later today and see if there is a reason that makes sense to me.
Wow, Mike, check this out. Ryan Maue, the former employee of WxBell who actually was the guy who is responsible for first producing the CSFv2 anomalies maps, is saying in response to Roy Spencer that what he said is false because the July, 2019, CSFv2 anomalies map is flawed and therefore shouldn’t be used!!
https://mobile.twitter.com/ryanmaue/status/1158767762413670402
Per Ryan Maue in this tweet:
“This is false.
“ wattsupwiththat.com/2019/08/02/jul…These old maps I created 10-years ago from CFSR have a fatal flaw: the model changed in 2011 so the climatology & real-time numbers (e.g. July 2019) are mismatched. Do NOT use. Use ERA5 or JRA-55 (like I do)”
To review what I said earlier in this thread, this CFSv2 map is overall significantly cooler than what official station data shows in many areas of the US like SD, NE, MN, IA, LA, TN, AZ and the west coast states among others as well as in Moscow, Russia. The issue is that those who claim July, 2019, was at or near the warmest month on record globally are basing it on ~+0.56 C anomaly vs 1981-2010 normals. In contrast, the CFSv2 map that Roy Spencer was touting shows only +0.305. Now we have the creator of that map with only +0.305 saying it has a major flaw and shouldn’t be used!
And now look what Spencer has added to his article:
“[NOTE: It turns out that the WMO, which announced July 2019 as a near-record, relies upon the ERA5 reanalysis which apparently departs substantially from the CFSv2 reanalysis, making my proposed reliance on only reanalysis data for surface temperature monitoring also subject to considerable uncertainty].”
So at this point what data can be trusted?
It is often stated that major government supported weather recording and reporting agencies tamper with their own temperature data. It is also well documented that many temperature reporting sites are of poor quality due to urban sprawl and heat island effects.
mad,
I don't know but I'd say that thanks to the aforementioned tweet from Ryan Maue, the actual creator of the WxBell CFSv2 maps, the maps are flawed without question. This even forced Roy Spencer, who was emphasizing a supposed only +.305C anomaly vs 1981-2010, to backtrack. I was going to post city by city details to back up my feeling that the map was too cold, but I don't need to do that now thanks to Ryan.
Mike, any further thoughts about this? I know you were intending to address this.
This is made even more interesting because out here in the Sacramento valley I'd say we've been having one of the mildest summers I can remember. Starting tomorrow they are forecasting a couple days of mid-80s, and this is in August when it's not unusual to still have high 90 and triple digit temperatures.
Hi Larry,
Let me look into this over the weekend. Great stuff you found.
I spent some time trying to obtain data or information to try to figure this out myself but it's not possible for me.
Fortunately, Dr. Spencer did an update with the data that is available to him(and he is so much more qualified than me to analyze and interpret it.
August 6th, 2019 by Roy W. Spencer, Ph. D.
“Reading, we have a problem.”
As a followup to my post about whether July 2019 was the warmest July on record (globally-averaged), I’ve been comparing reanalysis datasets since 1979. It appears that the ERA5 reanalysis upon which WMO record temperature pronouncements are made might have a problem, with spurious warmth in recent years.
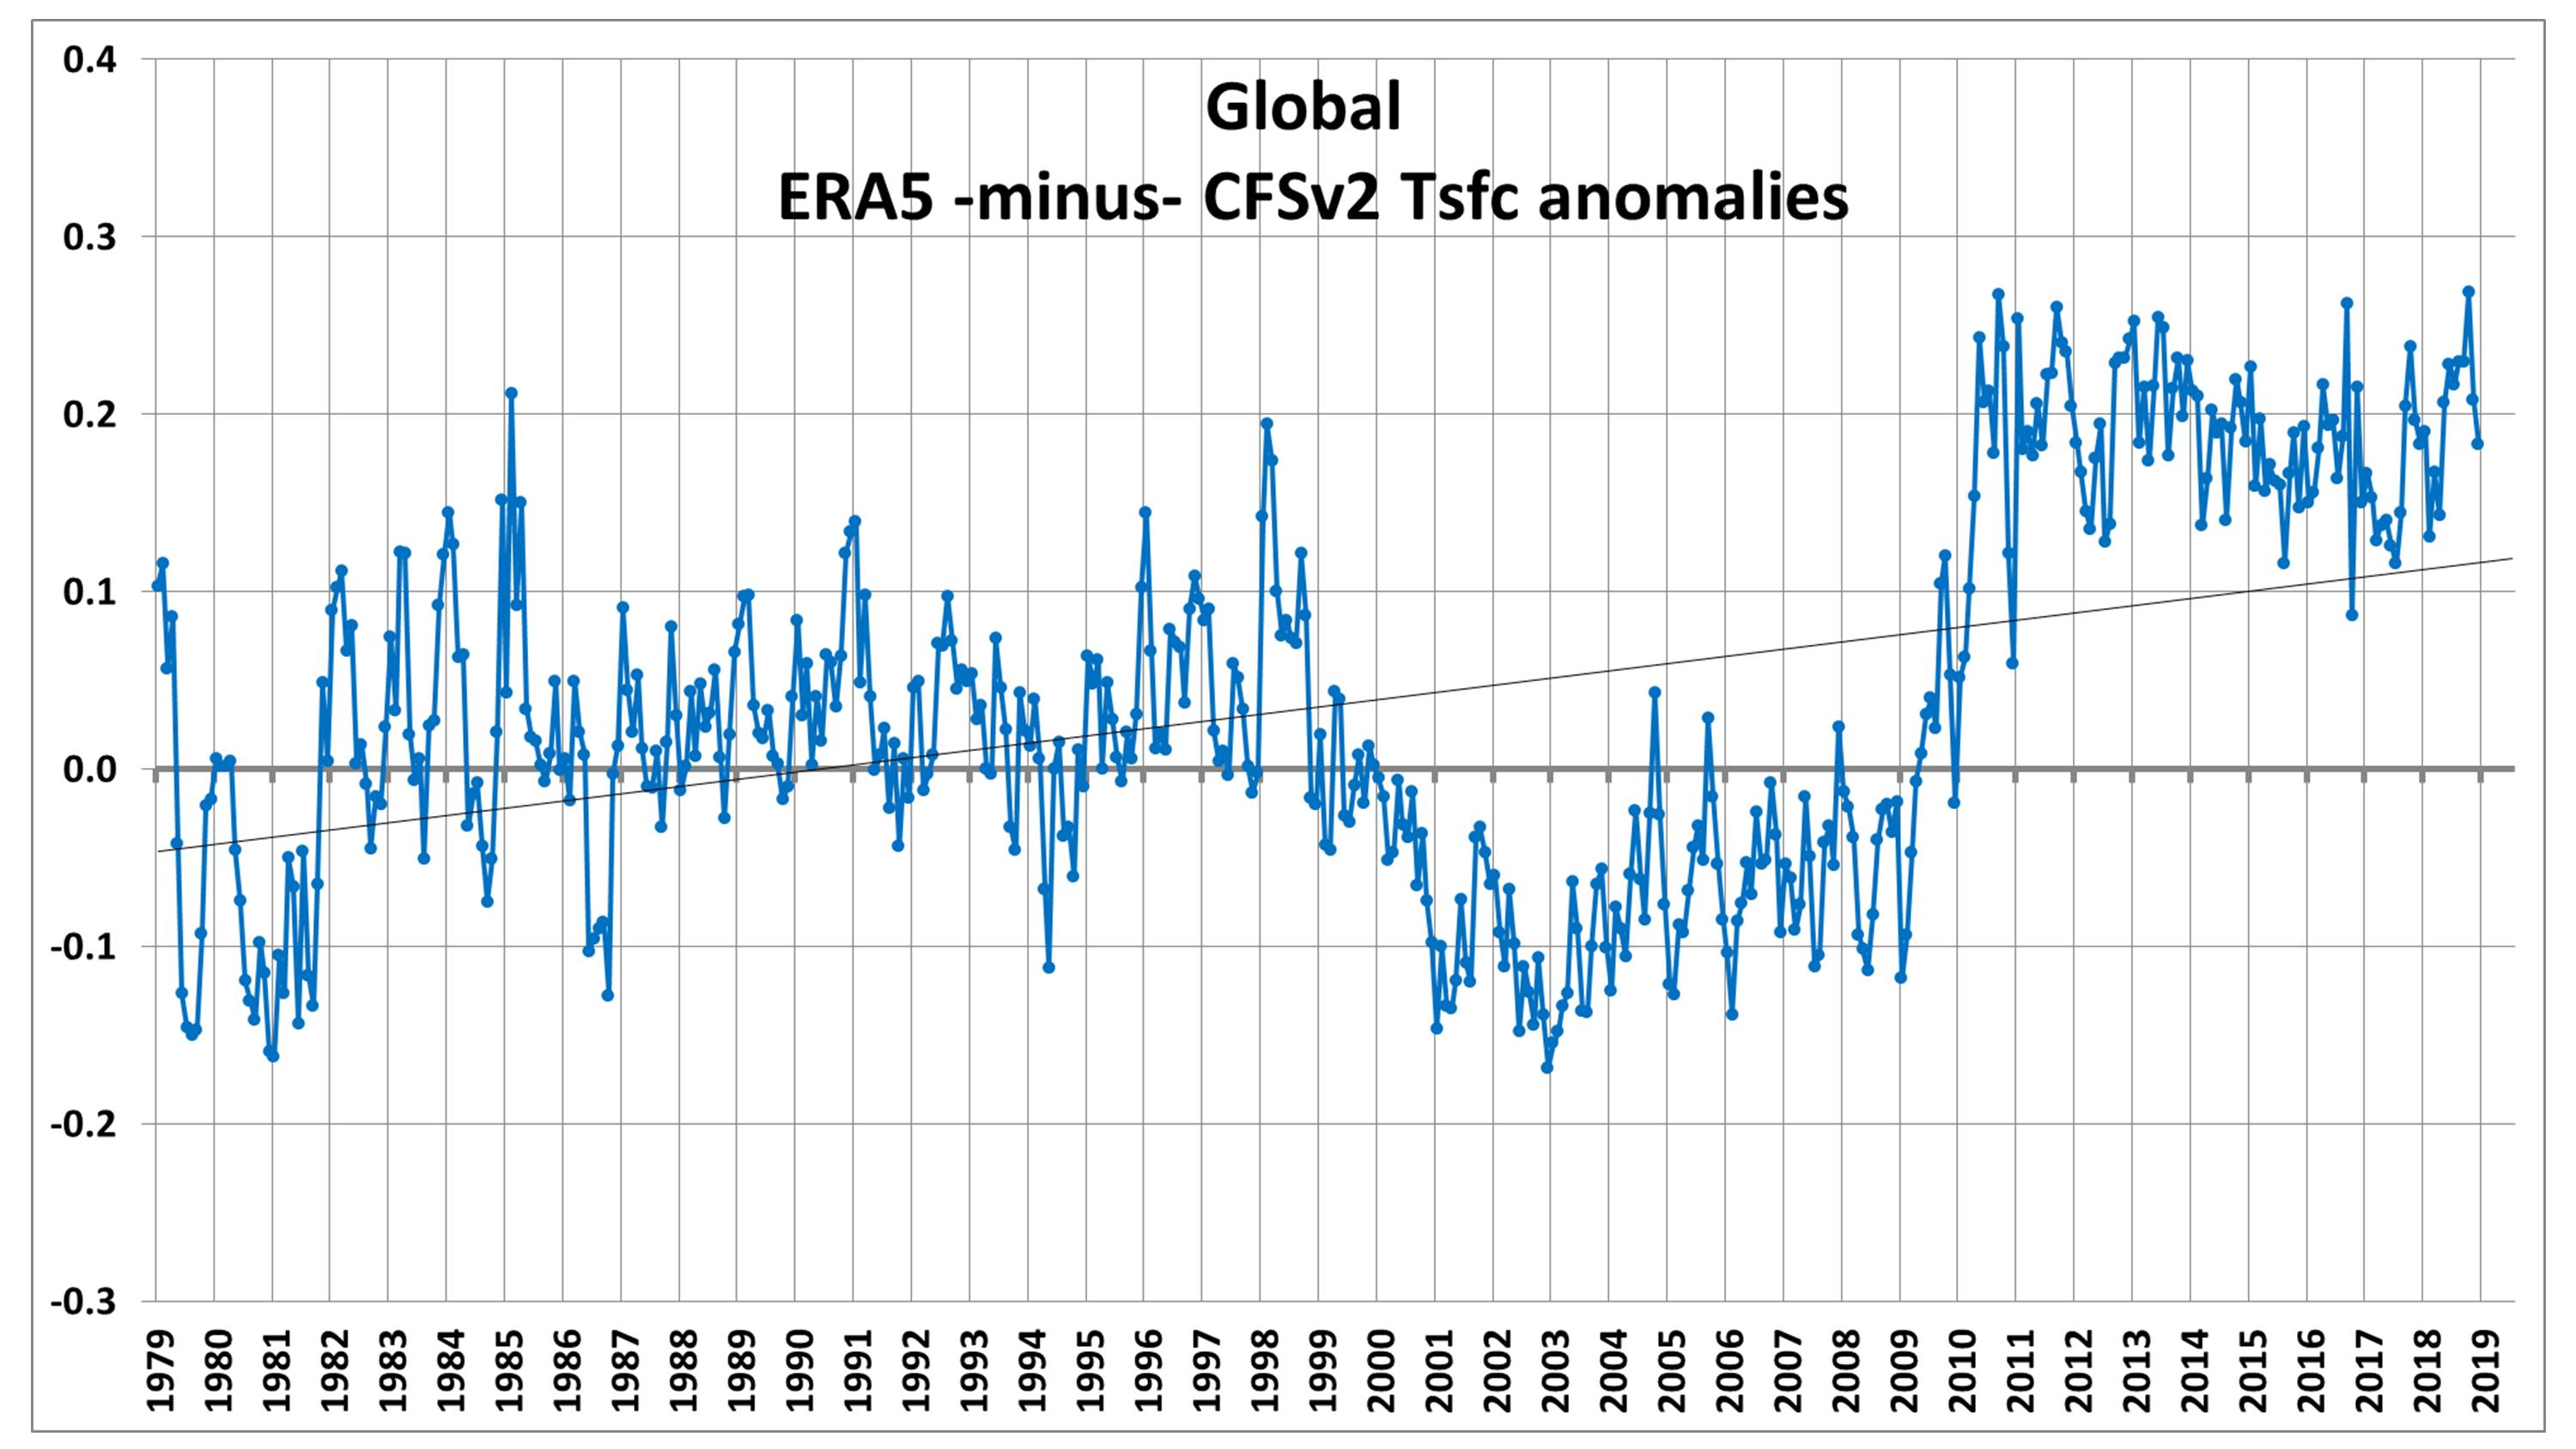
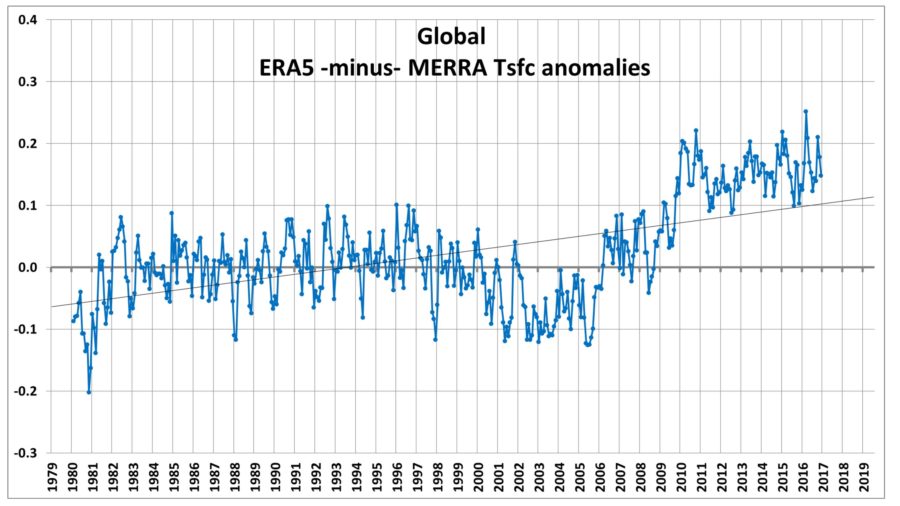
Here’s a comparison of the global-average surface air temperature variations from three reanalysis datasets: ERA5 (ECMWF), CFSv2 (NOAA/NCEP), and MERRA (NASA/GSFC). Note that only CFSv2 covers the full period, January 1979 to July 2019: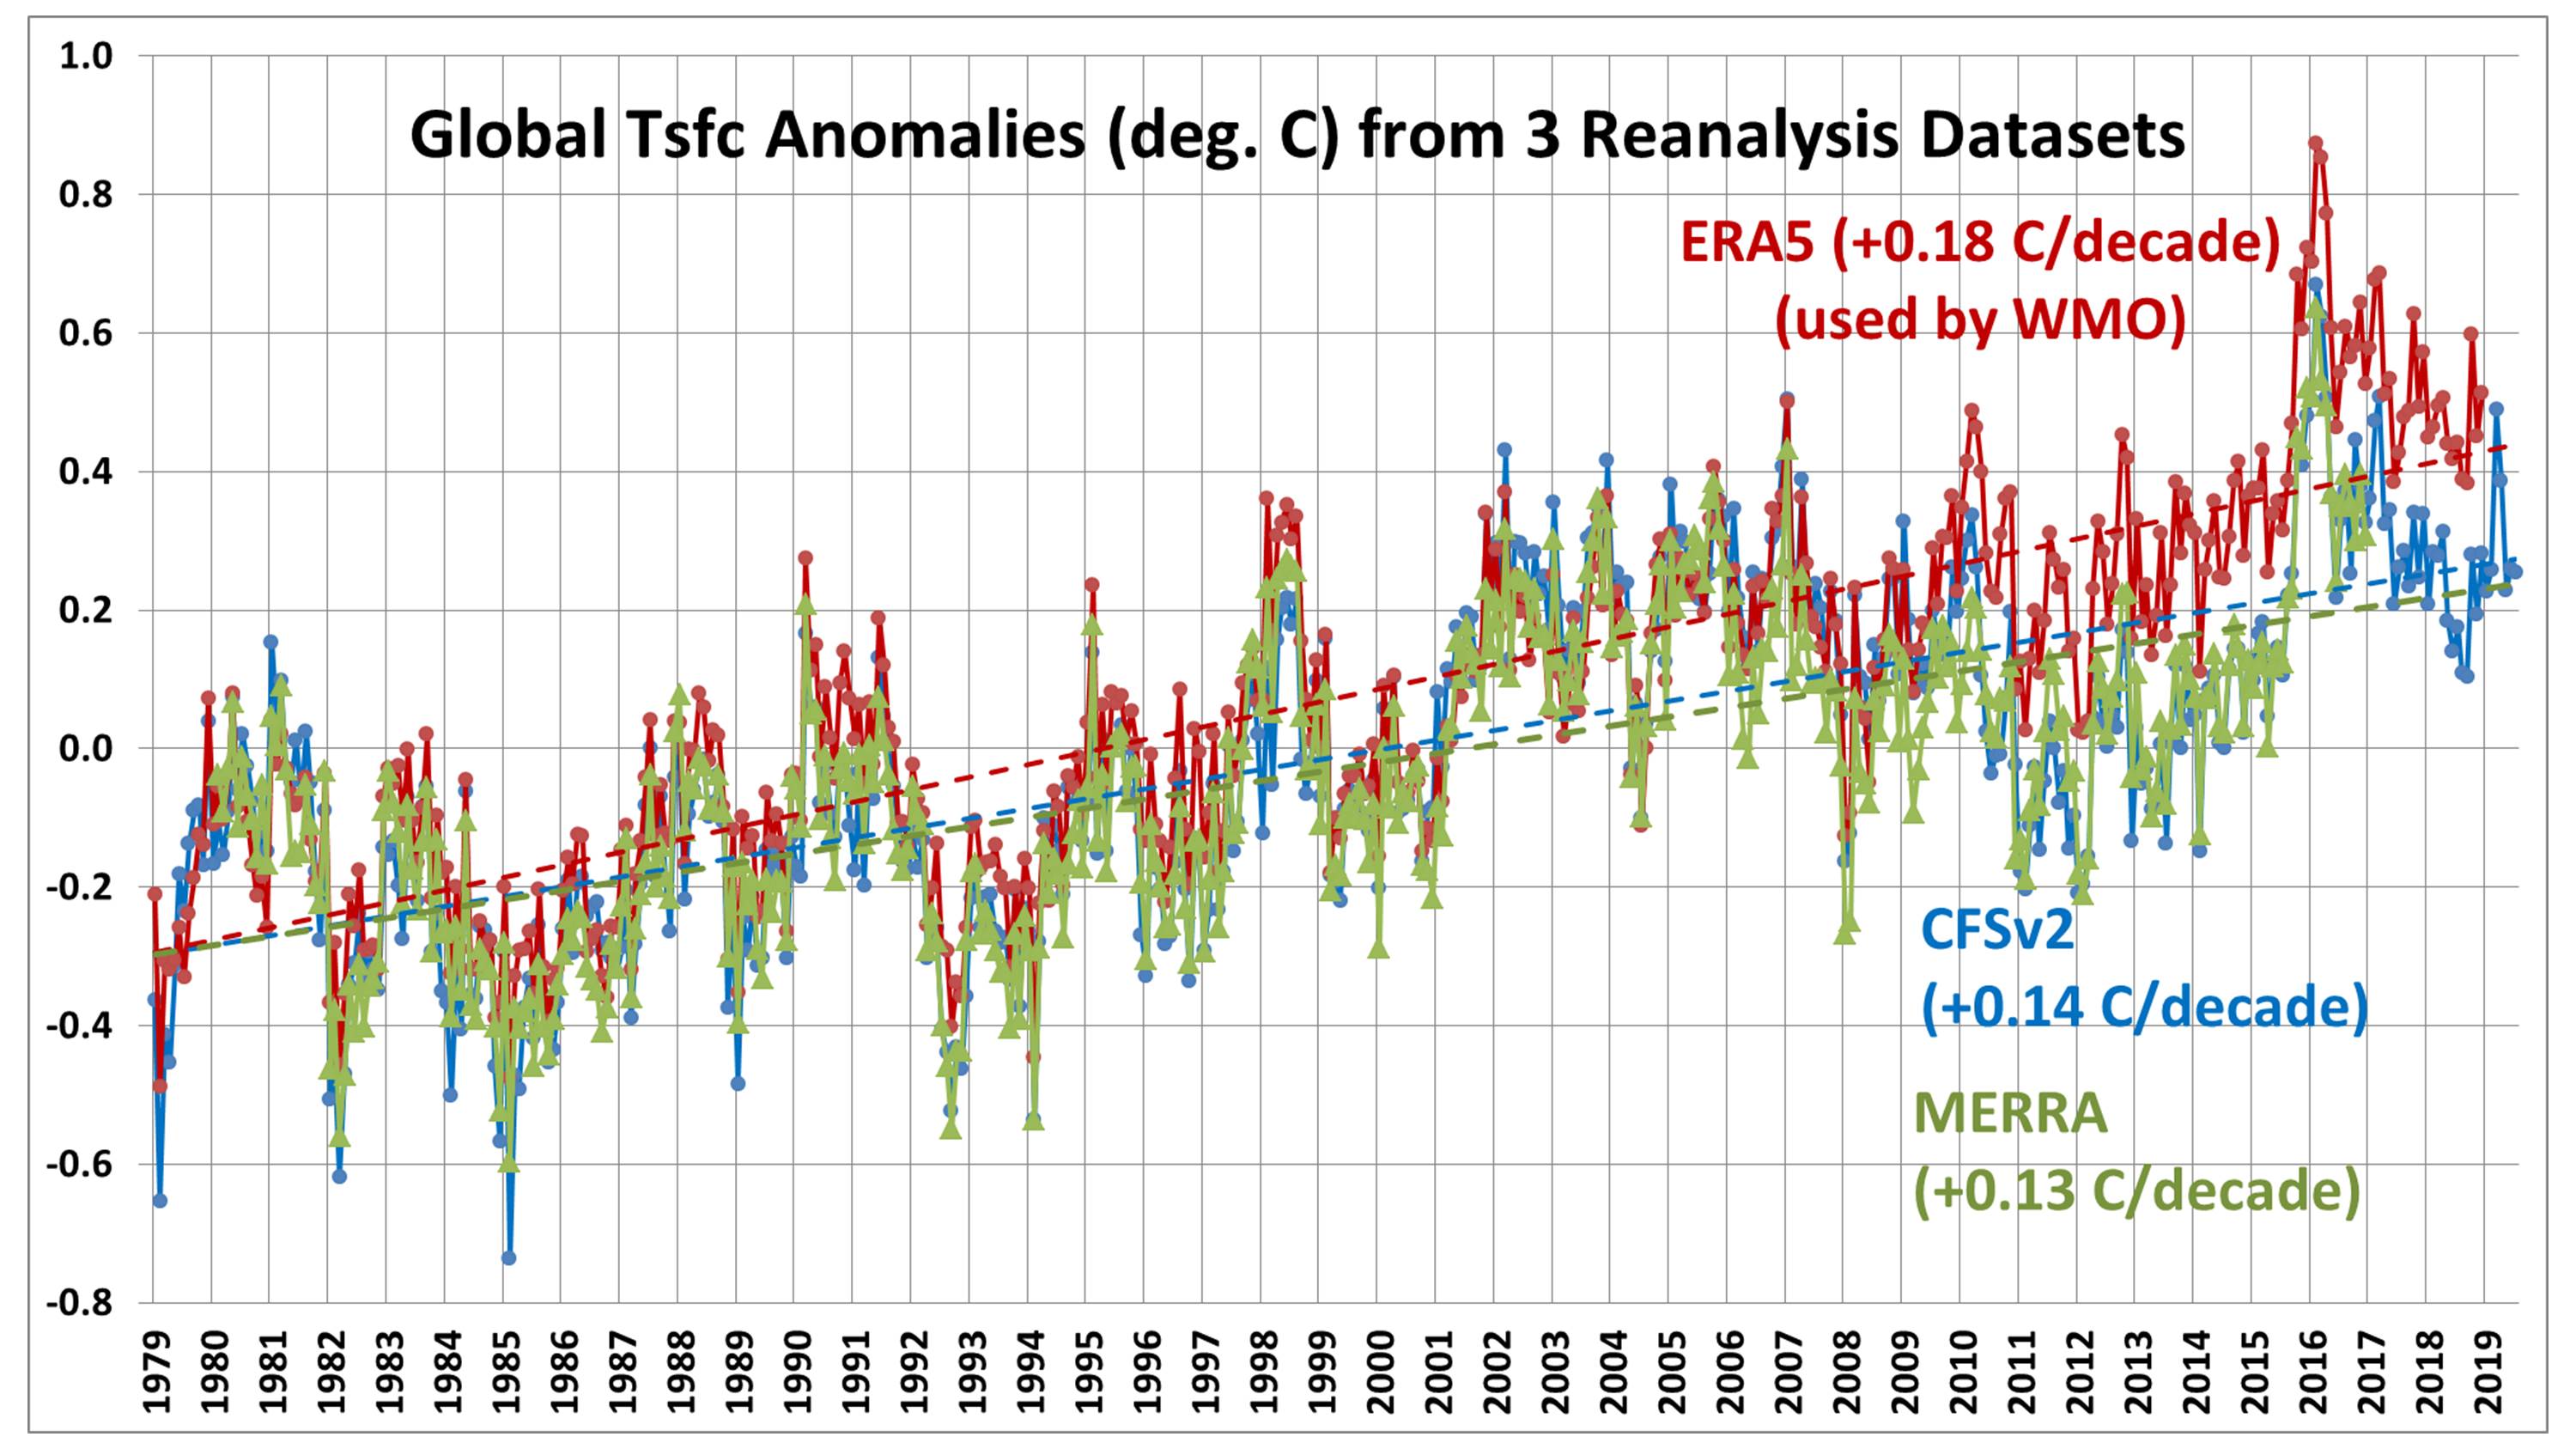
ERA5 has a substantially warmer trend than the other two. By differencing ERA5 with the other datasets we can see that there are some systematic changes that occur in ERA5, especially around 2009-2010, as well as after 1998:
These kinds of changes suggest to me differences in how the satellite deep-layer air temperatures from MSU and AMSU are handled, which through the data assimilation process can affect surface temperatures.
Dr. Spencer: Reanalysis datasets’ dependence upon various data sources is difficult to diagnose because a wide variety of data are included in them: surface thermometers, weather balloons, aircraft, ships, buoys, and a variety of satellites. Because the satellites are the only truly global source, they have the potential to significantly impact global-average quantities.
So, I am no longer standing by my previous statement that the current reanalysis datasets should be used for determining record warm months. At this point, it’s not even clear to me that reanalysis datasets are better for inferring record high (or low) surface temperatures than our (UAH) satellite dataset is, even though the satellite senses much more of the troposphere than it does of the surface.
This is all very preliminary, and I am open to other interpretations.
On this topic, we see there's uncertainty and I can't add any expertise that would shine a light on it that is any brighter than Dr. Spencer is doing.
I will say that by a wide margin, I use and trust Dr. Spencers temperature data sets from the satellite derived measurements vs other data sets, which are contaminated by things like the Urban Heat Island effect, location, adjustments and other bias.
From Mike’s post: “ERA5 has a substantially warmer trend than the other two. By differencing ERA5 with the other datasets we can see that there are some systematic changes that occur in ERA5, especially around 2009-2010, as well as after 1998”
———————
Mike,
Ryan Maue said not to use CFSv2 starting in 2011 because of a data flaw in the anomalies. Looking at the comparison between ERA5 and CFSv2, you can clearly see that ERA5 jumps up about 0.2 C near 2011 vs CFSv2 and stays there. My own analysis of the July, 2019, CFSv2 map clearly shows it is significantly too cold. I could easily see it being 0.2 C too cold for the globe as I found numerous US examples that were ~1 C too cold in anomalies vs 1981-2010 as per what I said earlier in this thread a couple of days before Maue tweeted about the CFSv2 problem. Also, I had commented that I found Moscow to be ~1 C too cold. So, I could very easily believe that the July, 2019, CFSv2 is near 0.2 to 0.25 C too cold for the globe as a whole. If I had to bet on whether or not the ~0.2 C discrepancy vs ERA5 is due to ERA5 or due to CFSv2, I’d bet heavily it is CFSv2 and that the true July, 2019, global anomaly actually is near the +0.56 C used by those who were saying warmest or near warmest month on record as opposed to the mere +0.305 shown by CFSv2.
It looks like I’m going to need to provide actual city by city examples like I had originally planned to make my case against the CFSv2 clearer. As soon as I get time, I will.
Good work Larry.
I'll let you handle this one if/when you get the time.
While I was looking around for more information/data on this, I found a couple of graphs comparing measured temperatures(where this discussion morphed to) to modeled temperatures from an article that I hadn't seen before.
According to the average results of computer climate models, we should have seen about 0.27˚ C of global warming per decade since the late 1970s:
https://wattsupwiththat.com/2019/07/27/why-climate-change-chicken-littles-demand-action-now/
But the best data we have show about half that much—0.13˚ C per decade according to the University of Alabama at Huntsville’s satellite data.

Don’t get me wrong. There has been warming. But the models simulate about twice what we’ve observed.

Per NOAA, Roy Spencer was wrong to say July, 2019, wasn't the hottest month globally on record. At this point, I see no reason not to side with NOAA after the detective work I did suggesting that the Weather Bell CFSv2 map that Roy was referring to that had the global anomaly vs 1981-2010 at only +0.305 C was significantly too cold. I found numerous instances in the US that suggested it was 1-2 F too cold. Also, Moscow in Russia looked ~1 C too cold. After considering my research, I do think the true anomaly is likely a good bit warmer than that +0.305 C of the CFSv2. There's a good chance it really is +0.5 C+ and quite possibly near the +0.55C that makes it the hottest month on record:
https://www.wral.com/scientists-confirm-july-set-new-global-heat-record/18571082/
Thanks Larry!
That makes sense since July is the hottest month of the year and we continue to have modest global warming(temperatures are slowly climbing higher).
I would suspect that in 10 years, July 2029, the global temperature will be a bit warmer than this too.
I was wondering if there is any data suggesting weather is becoming more volatile in temp, storms, floods etc.
Avg temp is one part of the equation. It does create some have and have not parts of the world.
The U.N is trying to tell us world food production may be a greater risk than past yrs. due to weather changes and not so much actual temp
If the grass lands in Africa are greener then the wild animals benefit
If a rice crop or wheat which is a staple food for millions is damaged by weather then greener grass lands over a larger area may make the planet greener but does not benefit human food production.
Thus greener needs to be looked at closely to decide who benefits and who losses, and how much of a lost crop may be due to greater damaging weather anomalies.
Many parts of the world are reported to have suffered from poor weather and the world will produce, on avg. less crop this yr.
Perhaps this is correct or just hype as I don't know
Hi Wayne,
The last 40 years has featured the best weather/climate for life and growing crops in at least the last 1,000 years.
The planet is greening up because the laws of nature can't be abolished and don't follow politics.
CO2 is a greatly beneficial gas and current levels for plants/life are still far lower than the optimal level.
CO2 is also a greenhouse gas that is causing some slight and so far mostly beneficial warming but the benefits outweigh the negatives by a margin of 10 to 1 for the planet.
Please read these discussions for much more and let me know if you have any questions.
Mike
Climate Reality discussions
https://www.marketforum.com/forum/topic/27864/
Interesting article today at WUWT.
Kip Hansen / 1 hour ago August 16, 2019
https://wattsupwiththat.com/2019/08/16/july-2019-hottest-july-ever/
So the main reason to bring this one up is the point of these 2 sides making a huge deal out of a couple tenths of a degree difference because it allows one to claim that it was the warmest month ever or it was not quite the warmest month ever.
The reality is that the fractional difference didn't make any difference to life on this greening planet, which is doing the best that it has in the last 1,000 years.....but that doesn't matter to the humans that want to use it to either scare people more or to use it to tell people they shouldn't be scared(which is the correct emotion-not be scared of the beneficial warming but be petrified over what one side wants to do to us because of the fake climate crisis).
So who cares if it was just barely the warmest month or not(since the Medieval Warm Period). The rate of warming is not alarming. The benefits are greater than the negatives for life on this greening planet(which still hibernates and goes dormant or migrates south in the Winter because the planet is still colder than the optimal temp-which was much warmer than this in the higher latitudes just over 5,000 years ago.)
And we would expect it to be the warmest...........either now or within the next several years because we are having global warming.
The current rate is around 1.3 deg/century or .13 deg/decade.
So in a decade, the physics from the greenhouse gas warming because of the increase in CO2 may have warmed us up by another .13 deg or so.
However, the warming from CO2 is logarithmic, so its possible that rate could slow down.......or, with more positive feedback from increasing H2O, it might not. The increase in water vapor is causing nights to be much warmer than its effecting days.
Also a greater affect in the highest latitudes and during the coldest times of year, when the increase in H2O is greater in a relative sense.