·
Trade estimates for Monday's report from USDA. U.S. #corn yield seen at 164.9 bu/acre. Harvested acres seen falling 3.55 million from June survey. Production at 13.193 billion bushels, down 5% from last month's forecast.
·
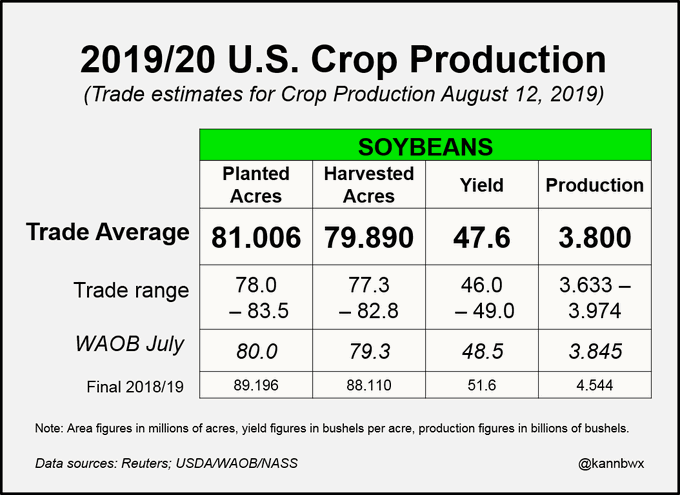
Trade expectations for #soybeans. Yield down 0.9 bpa to 47.6. Harvested acres up 590,000. Production down 1% from July.
·
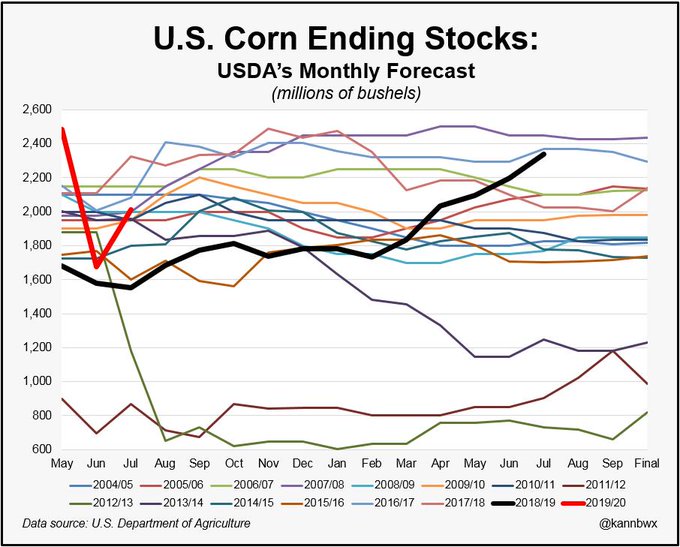
A 390 mln-bu cut to #corn stocks is extremely rare. Has only happened 3 times in modern history: June 2019, July 2012, and August 2012. Requires a complete crop disaster, basically. USDA cut the crop by 1.82 bbu in July 2012 and by another 2.19 bbu in Aug 2012.
The #corn carryout reductions: June 2019 (810 mln bu), July 2012 (698 mln bu), August 2012 (533 mln bu). The next largest monthly reduction in USDA's U.S. ending stocks projection was 225 mln bu in March 2018.
Two tweets above, I should clarify my statement. ***It would basically require a complete crop disaster to get that large of a reduction TWO TIMES in one marketing year. That is just based on recent history (about 20 years or so) and the examples from 2012.
USDA and wild guesses.....that is funny right there mm. if the USDA does not account for PP acres what good is the report? 86 m planted no 86 intended
USDA will NEVER report 88 intended 78 harvested (pp and normal loss) with 160 yield as I 'suspect' is the true situation. Doubt USDA will recognize 5-7 pp
thanks for the comments.
This is interesting. In the last 20 years, the market has missed the direction of U.S. #corn yield in August only 3 times. 2015: trade thought yield would be LOWER than USDA's July figure, but it was HIGHER. 2003, 2013: trade thought yield would be HIGHER, but it was LOWER.
But the degree of the miss has been more influential. For example, market was looking for a lower yield (166.2) in August 2017 than USDA had in July (170.7). Yield was lower, but it came in at 169.5, over the top end of the trade range.
And keep in mind, Monday's yield will not be USDA "raising" or "lowering" yield from the current 166 bpa. Monday's estimate is a completely new, independent estimate from NASS derived in a different way than WAOB's figures from May-July.
·
Last year, August soybean yield came in 6.4% larger than in July, the largest jump between the two months in at least 20 years. The August 2018 yield of 51.6 bpa was the first August peg above 50. It also turned out to be the final yield last year.
Yield for #soybeans has been a bit more difficult with the trade missing the direction in August 6 times in the last 20 years. Two of those were recent (2015, 2017) where market was looking for a lower yield than in July, but the August number came in higher.