Thanks mcfarm,
Every iota of information that this guy stated is based on the authentic science.
Whether it be climate science, biology, agronomy, zoology or something else.............CO2 is a beneficial gas and the optimal level for life on this planet is double where it is currently.
We rescued life and plants from a near CO2 starvation mode.
Only in the field of politics is CO2 defined as pollution. The MSM is brainwashing us with junk science and fake news about a fake climate crisis that is really a climate optimum.
The last 40 years have featured the best weather/climate on this planet in the last 1,000 years.............the last time that it was this warm, during the Medieval Warm Period.
https://www.nass.usda.gov/Charts_and_Maps/Field_Crops/soyyld.php
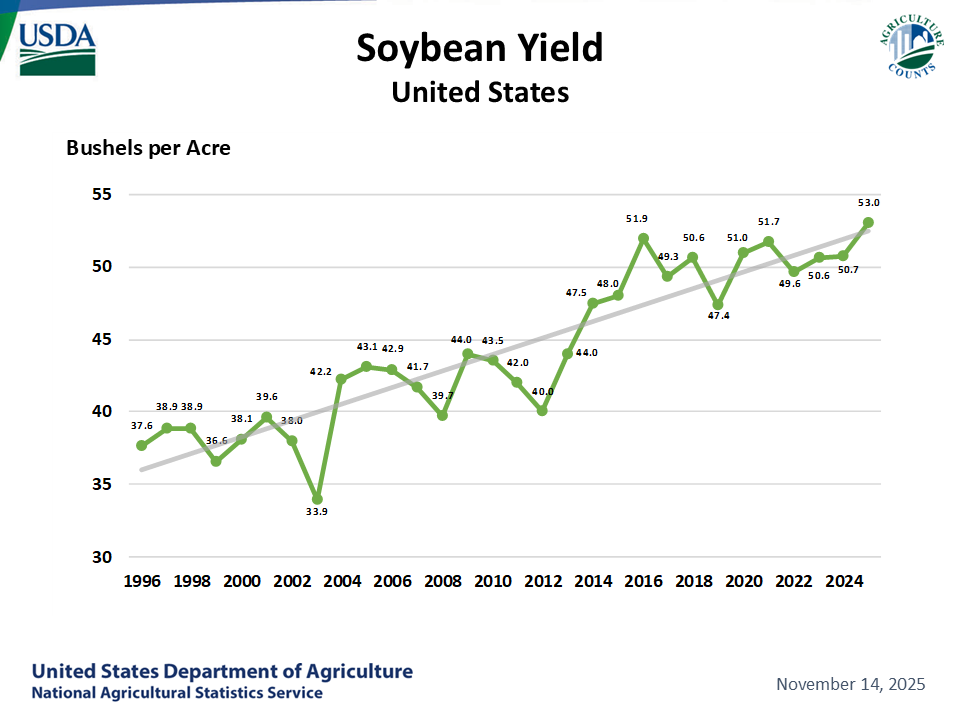
There obviously are other contributing factors with genetics and farming technology (+75%) but the +CO2 and weather(+25%) have been a big plus.
With Corn, it's a different picture because of the introduction of nitrogen fertilizer causing corn yields to triple real fast and not as much to do with CO2 or weather during that initial tripling. However, recent decades have featured a steady increase, along with a steady increase in CO2 and beneficial weather.
http://crazyeddiethemotie.blogspot.com/2014/10/corn-questions-from-food-inc-worksheet.html

Here is irrefutable evidence using empirical data to show that the increase in CO2 is causing a huge increase in crop yields/world food production.
We can separate the CO2 effect out from other factors effecting crops and plants with many thousands of studies that hold everything else constant, except CO2.
Observing and documenting the results of experiments with elevated CO2 levels, tell us what increasing CO2 does to many hundreds of plants.
Here's how to access the empirical evidence/data from the site that has more of it than any other. Please go to this link:
http://www.co2science.org/data/data.php
Go to plant growth data base:
http://www.co2science.org/data/plant_growth/plantgrowth.php
Go to plant dry weight(biomass):
http://www.co2science.org/data/plant_growth/dry/dry_subject.php
Pick the name of a plant, any plant and go to it based on its starting letter. Let's pick soybeans. Go to the letter S,http://www.co2science.org/data/plant_growth/dry/dry_subject_s.php
Then scroll down and hit soybeans. This is what you get:
http://www.co2science.org/data/plant_growth/dry/g/glycinem.php
Glycine max (L.) Merr. [Soybean]
Statistics
| 300 ppm | 600 ppm | 900 ppm | |
| Number of Results | 238 | 25 | 3 |
| Arithmetic Mean | 48.3% | 71.2% | 61% |
| Standard Error | 2.4% | 7.9 | 11.3% |
This tells us that there were 238 studies with the CO2 elevated by 300 ppm. The mean increase in plant biomass was 48.3% from all those studies.
The individual studies are listed below that.
A very rough estimate for the increase in CO2 is something like +1% in plant growth for every 5ppm increase in CO2 but it varies a great deal from plant to plant. The increase in CO2 from 280 ppm to 411 ppm is +131 ppm which would equate to an increase of around 26%.
The increase in growth would be greatest at the lowest levels of CO2(at 280 ppm, plants were in CO2 starvation mode) but they would continue in most plants to 1,000 ppm. The studies done above that increased CO2 by 600 ppm would have elevated them to close to 1,000 ppm. You will note that going higher than that caused yields to start dropping.
It's extremely unlikely that CO2 levels will ever get close to going up another 300 ppm, let alone to the even more beneficial level of 600 ppm higher. Going to 900 ppm higher, in the studies, establishes the level at which the benefits stop.
Here are most of the scientific studies on the climate of 1,000 years ago(hundreds on the map below), most of which, by a wide margin, show that the Medieval Warm Period was warmer than this:
From the same site below, over 100 studies from the Medieval Warm Period, most of which show the planet was this warm or warmer 1,000 years ago. It was also this warm 2,000 years ago during the Roman Warm Period and also just over 3,000 years ago, during the Minoan Warm period.
Medieval Warm Period Project:
http://www.co2science.org/data/mwp/mwpp.php
| MWP-CWP Qualitative Temperature Differentials - CO2 Science www.co2science.org Figure Description: The distribution of Level 2 Studies that allow one to determine whether peak Medieval Warm Period temperatures were warmer than (red), equivalent ... |
For the Medieval Warm Period compared to today below:
Red balloons showed it was warmer.
Blue was colder than today(in that study)
Green was wetter/more precip
Yellow was drier
https://wattsupwiththat.com/2017/01/03/documenting-the-global-extent-of-the-medieval-warm-period/

And the Holocene Climate Optimum from 5,000-9,000 years ago was even warmer than the Medieval Warm Period in the higher latitudes.
Note that this was called an OPTIMUM not a crisis.
https://en.wikipedia.org/wiki/Holocene_climatic_optimum
"Out of 140 sites across the western Arctic, there is clear evidence for conditions warmer than now at 120 sites. At 16 sites, where quantitative estimates have been obtained, local HTM temperatures were on average 1.6±0.8 °C higher than now."

Temperature variations during the Holocene from a collection of different reconstructions and their average. The most recent period is on the right, but the recent warming is only seen in the inset.
Get the rest of the truth, here: