1. Its the time of year when the crop tours start. Today marks the start of #pftour19. Interesting to think about the impact of the tour this year in light of the fact that NASS dropped the objective yield survey for the August crop report this year.
2. My view is that we can think of the #pftour19 as a first look in the corn and soybean fields this year, given no objective yield survey in August. So, the market may react even more than usual to the news out of the tour.
3. I am of two minds about the #pftour19 data this year (classic for an economist, I know). On one hand, I really do think the data will be more valuable than in the past due to change in NASS surveys for August.
4. On the the other hand, I am more concerned than I have been in the past about the sample sizes used to compute the #pftour19 yield estimates. My past concerns are laid out in this #FDD

5. The reason I am even more concerned than usual is the incredible variability that I think is within corn and soybean fields this year. My views in this regard were formed by the Corn Project aerial photos found here

6. If conditions within fields are as variable as these aerial photos indicated in early July, then it will take more than the usual number of samples per field to get an accurate estimate of yield in each field.
7. I am not bashing on #pftour19, just trying to provide some context when you see the estimates. I am as interested in what they report as everyone else. Given the inherent limitations in crop tours like this, I think the PF team does a pretty good job.
8. But what I am really going to be paying attention to is any reporting on the variability within fields and the scope of low-yielding areas within fields, particularly in the eastern Corn Belt. Everyone be safe out there!
The corn yields from the tour are best compared with past tour data, NOT USDA numbers! #pftour19 does not cover the entire state(s)... except for Iowa. Routes are the same each year. States included: South Dakota, Ohio, Nebraska, Indiana, Illinois, Iowa, Minnesota.
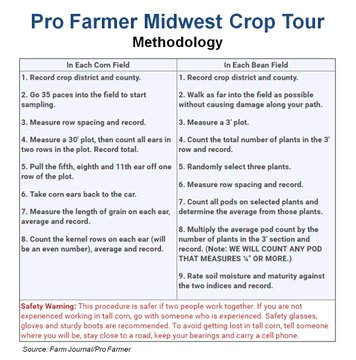
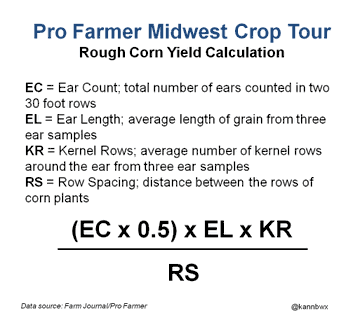
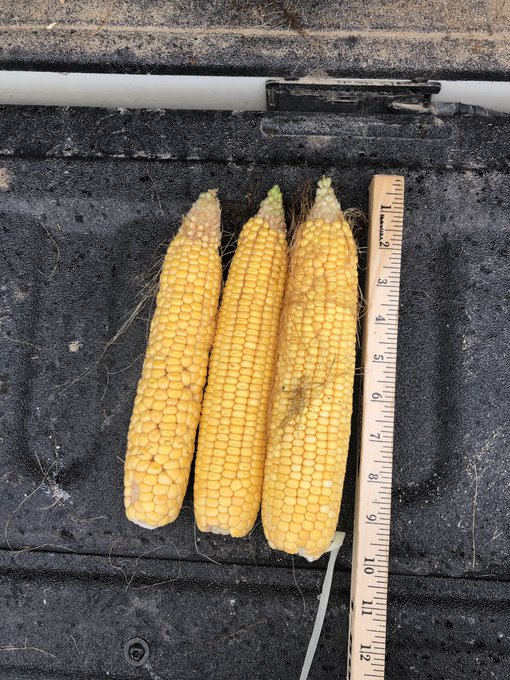
This is exactly what the Pro Farmer Midwest Crop Tour scouts are doing in the fields this week and how the rough #corn yield calculations are done. For #soybeans, scouts count the number of pods in a 3x3 foot plot to gauge potential. #pftour19
·
6 total stops in South Dakota. Here are the final two. #pftour19 6 stop
#corn avg = 149 bpa 6 stop
#soybeans = 1054 pods
3-year district 9 avg: Corn = 153 bpa
Soybeans = 943 pods
https://www.goldeaglecoop.com/news/morning-commentary-262/
The tour released results last night that estimates the Ohio yield at 154.35 bushels per acre vs. the current USDA estimate of 160 bushels per acre. Last year the USDA estimated Ohio’s yield at 187 bushels per acre vs. the Pro Farmer Crop Tour estimate last year for Ohio at 179.57 bushels per acre. The Western leg of the tour estimates the South Dakota average yield at 154.08 bushels per acre vs. the current USDA estimate of 157 bushels per acre.
The Pro Farmer Crop Tour on Day #1 also reported seeing a lot of immature fields. The Eastern leg of the tour showed Ohio pod counts at around 764 pods per 3×3’ square area vs. a pod count average of 1,248 last year, which puts this year’s pod count off by about -38% compared to last year. The average settlement price for Nov beans since August 13th is 876.75.
·
South Dakota #corn yields averaged 154.1 bu/acre on #pftour19, down 13% from last year's tour but only 3% off the recent average. Soybean pod counts come in at 833, down 19% YOY. USDA's yields are both down 2% YOY.
Ohio #corn yield samples come in at 154.4 bu/acre, down 14% from last year's tour. USDA's corn yield projection is also down 14% YOY. Pod counts for #soybeans down 39% YOY, USDA's yield is down 17% YOY. #pftour19
https://www.ocj.com/2019/08/pro-farmer-midwest-crop-tour-eastern-leg-day-2/
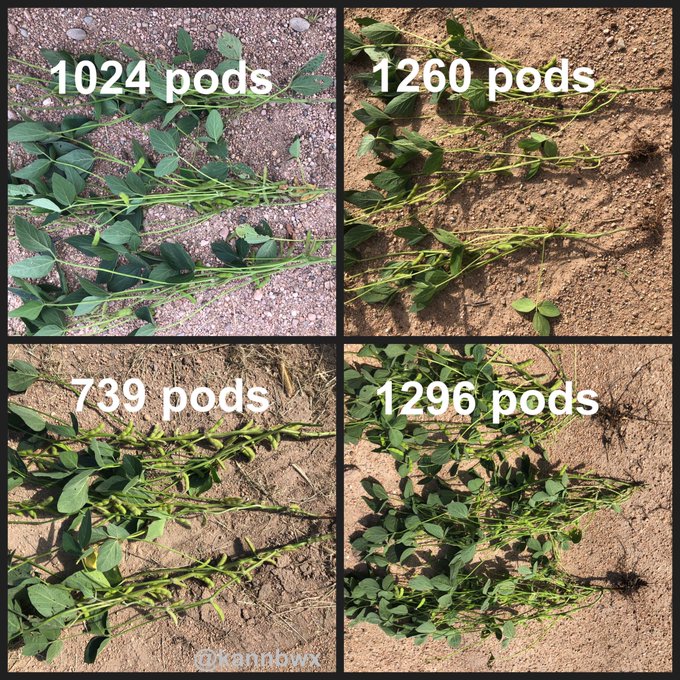
The #soybeans at those same 4 stops. Only the last one was irrigated. Average pods in a 3x3' plot is 1080. Last year's tour found 1296 in this district, 3 year avg is 1188. #pftour19
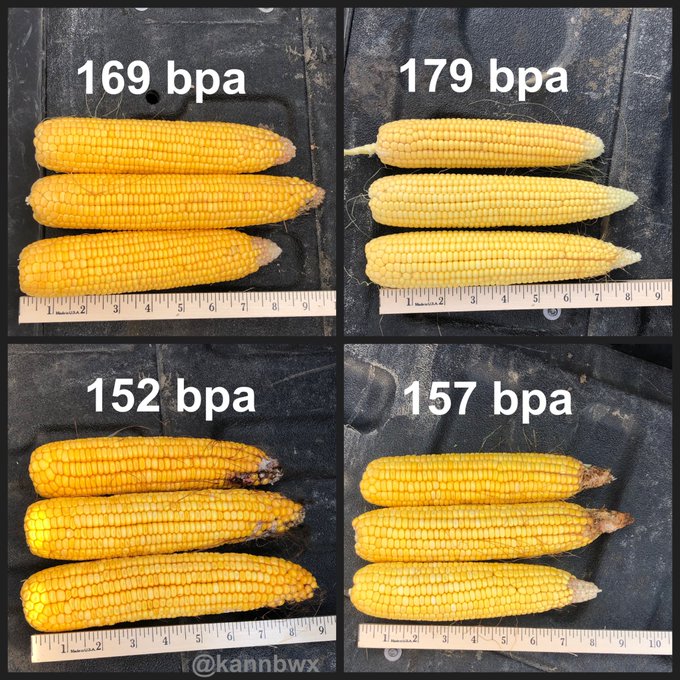
#Corn in Nuckolls, Thayer, and Fillmore Ctys, Nebraska. 4-stop avg of 164.3 bpa. Last year's tour found this district at 170, three-year avg is 157. #pftour19
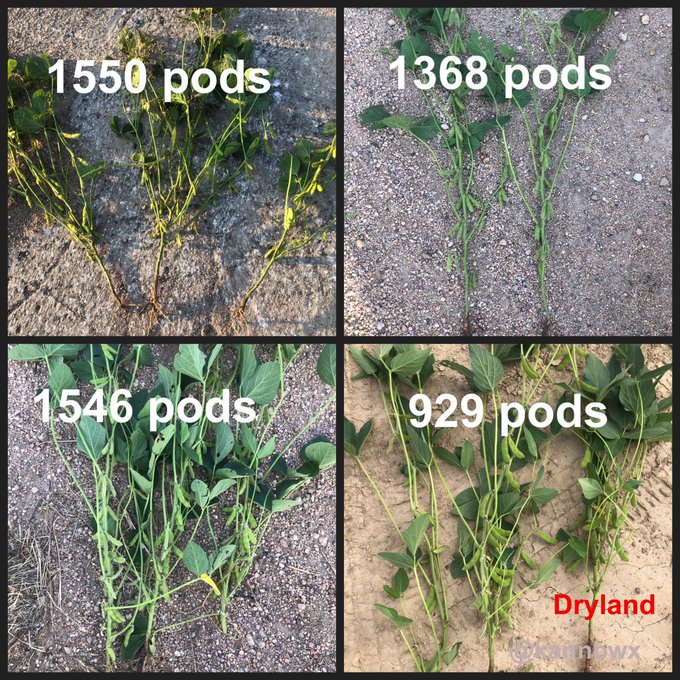
These were the #soybeans at those same 4 Nebraska stops. Pod counts in the first 3 notably stronger than what I saw last year. 4th one fell short (that was the dryland). #pftour19
·
4 stops in Hall, Adams, and Webster Counties, Nebraska. Average #corn yield 146 bpa. All but one irrigated. Definitely lower yields than recent tour averages for this area. #pftour19
Hi Mike
I agree with you on the variability
Reading the report I notice where the plants counted were on better parts of the field
One stop was especially interesting
The scouts walked past a spot of damaged beans to reach a better part of the field
No mention was given as to, if the pod count was considerd an average of the entire field
Another stop was at a field of corn [I think] that was obviously not going to yield very much. So they went a short distance and found a better looking field, to sample
Makes me wonder if these samples are an average of the better locations within the field, or if any consideration is given to below average crops which will be harvested, no matter how poor, and will be the corn going into the bin, good, bad or average, on all acres if it makes corn.
Is this tour a realistic look at the entire crop or the better crop within the field. Any consideration to average yield on all acres, that will be harvested?? Good question and one has to be on the tour, in person, to know.
I have not seen one sample of corn in the blister stage, but farmers report fields with blister stage corn, if only in part of the field
Ontario will have acres of corn [today] that is at blister or just past that stage of maturity
I can still see some white silks in some fields of corn locally, but it is changing every day.
White silk today will be mush in the bin as the harvest has to take the average or wait for snow and then next spring harvest.
I bet a lot of corn in Ontario gets harvested in 2020
A walk down the rows, good and bad, is a humbling experience locally..
Thanks Wayne,
Results from the Eastern tour in IN and IL seemed pretty bullish today!
Despite huge rains, the beans couldn't close lower/make new lows.
We also have a bit of a frost threat now in the Plains/Upper Midwest in 10 days.
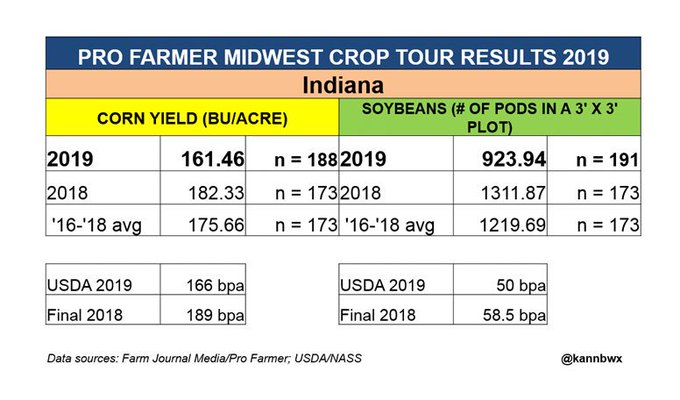
Indiana #corn yield comes in at 161.46 bu/acre, down 11% from last year's tour and down 8% from 3yr avg. USDA has yield down 12% YOY. Pod counts on #soybeans at 923.94, down 30% from last year's tour and down 24% from 3yr avg. USDA has yield down 15% YOY. #pftour19
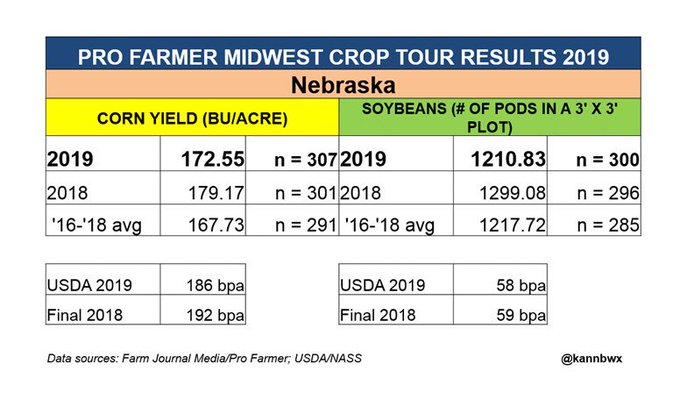
Nebraska #corn yield comes in at 172.55 bu/acre, down 4% from last year's tour and up 3% over last 3 yrs. USDA has yield down 3% YOY. Pod counts on #soybeans at 1210.83, down 7% from last year's tour and close to 3yr avg. USDA has yield down 2% YOY. #pftour19
I have not been impressed with the crop tour's opinion for many years. During normal growth years, they are alright. But during abnormal years, they are all astray. And this has definitely been an abnormal year.
Seems to me(maybe my memory is wrong but mcfarm and others can confirm or tell me on wrong on this) that the Profarmer comments during the week tend to be pretty bullish, then at the end of the week, their crop estimate comes out alot more bearish than the comments suggested and often lines up pretty close to the USDA's numbers.
One can guess that their connections and clients in the farm community like to hear the bullish comments/spin but when it comes down to it, the number at the end of the week is the one that defines their work and will stand at the end of the year and is the one they have live with when comparing it with the actual crop after harvest.
It seems to me that the bean pod count, because of the late planting is going to be MUCH lower than what the market is trading and the USDA is assuming based on their last forecast. This will cause production to be lower.............although the excellent August weather here is adding alot of bushels.
you are not wrong MM. Pro-crop thry Chip flory {x-farmer} has "massaged" the weeks numbers on Friday often times. This is NOT to say the guys in the field do or did anything wrong, they are good honest volunteers. I have 1 such person in my marketing group who farms in
S dak and Iowa
so my guy on the tour says not much of a story in corn until the combines roll or USDA starts weighing ears....something like 164 times 82m acres
beans could have a story right now with many many pods under 1/4 being tossed and not counted as they may or may not even finish......tons of beans so short they will not feed unless they reach a miracle growth spurt that does not happen this time of year
Thanks mcfarm!
Take a look at some 271 bushel/acre corn!!!!! We need to double the CO2 in the air for Indiana to have yields like that (-:
 Show
Show ·
After 6 stops in Iowa district 4 - #corn averaging 201 bu/acre. First two samples weren't as good as the ones below. Last year the tour pulled 187 bu/acre in this district. #pftour19
961 pods avg in a 3x3' plot for #soybeans on these four stops in western Iowa. Plant populations are low and number of pods is not the strongest. Plenty of soil moisture though. PLENTY. #pftour19
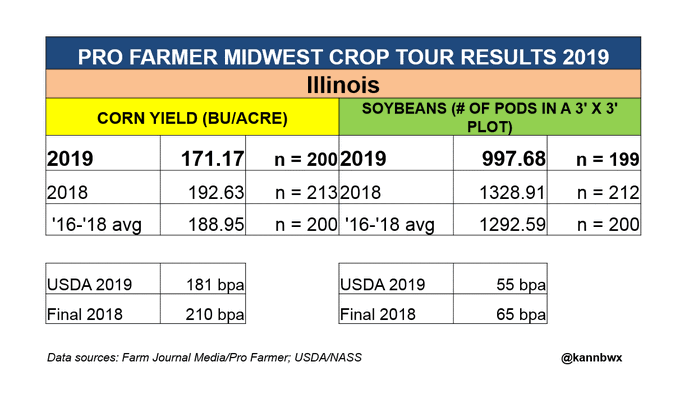
Illinois #corn yield comes in at 171.17 bu/acre, down 11% from last year's tour and down 9% from the 3yr average. USDA's yield is down 14% YOY. #Soybeans at 997.68 pods in a 3x3’ plot, down 25% from last year’s tour and 23% from 3yr avg. USDA’s yield is down 15% YOY. #pftour19
·
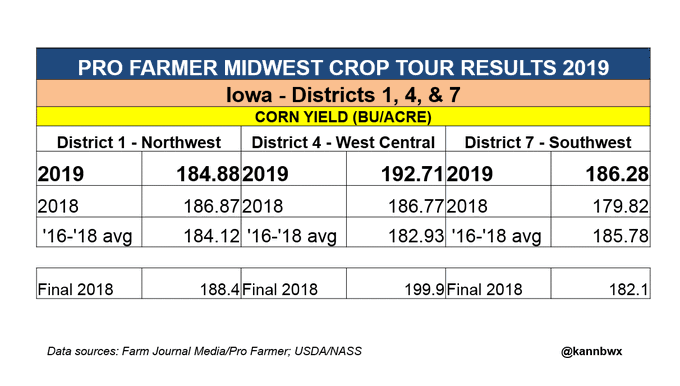
#Corn results from #pftour19 in Western Iowa. Northwest yield down 1% from last year's tour and close to 3yr avg. West Central yields up 3% YOY and up 5% from 3yr. Southwest yield up 4% YOY and in line with 3yr. Full Iowa results will be available Thursday night.
·
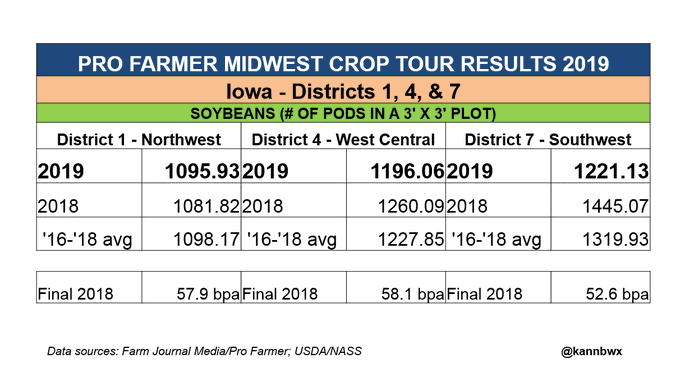
Pod counts for #soybeans on #pftour19 in Western Iowa. Northwest up 1% from last year's tour and close to 3yr avg. West Central down 5% YOY and down 3% from 3yr avg. Southwest down 16% YOY and down 8% from 3yr avg. Full Iowa results will be available Thursday night.