Lots of talk of world trade not doing well, let the BDI is hitting new highs.
Whats up with that?
Richard,
A profound point that is intriguing!
https://transportgeography.org/?page_id=5619
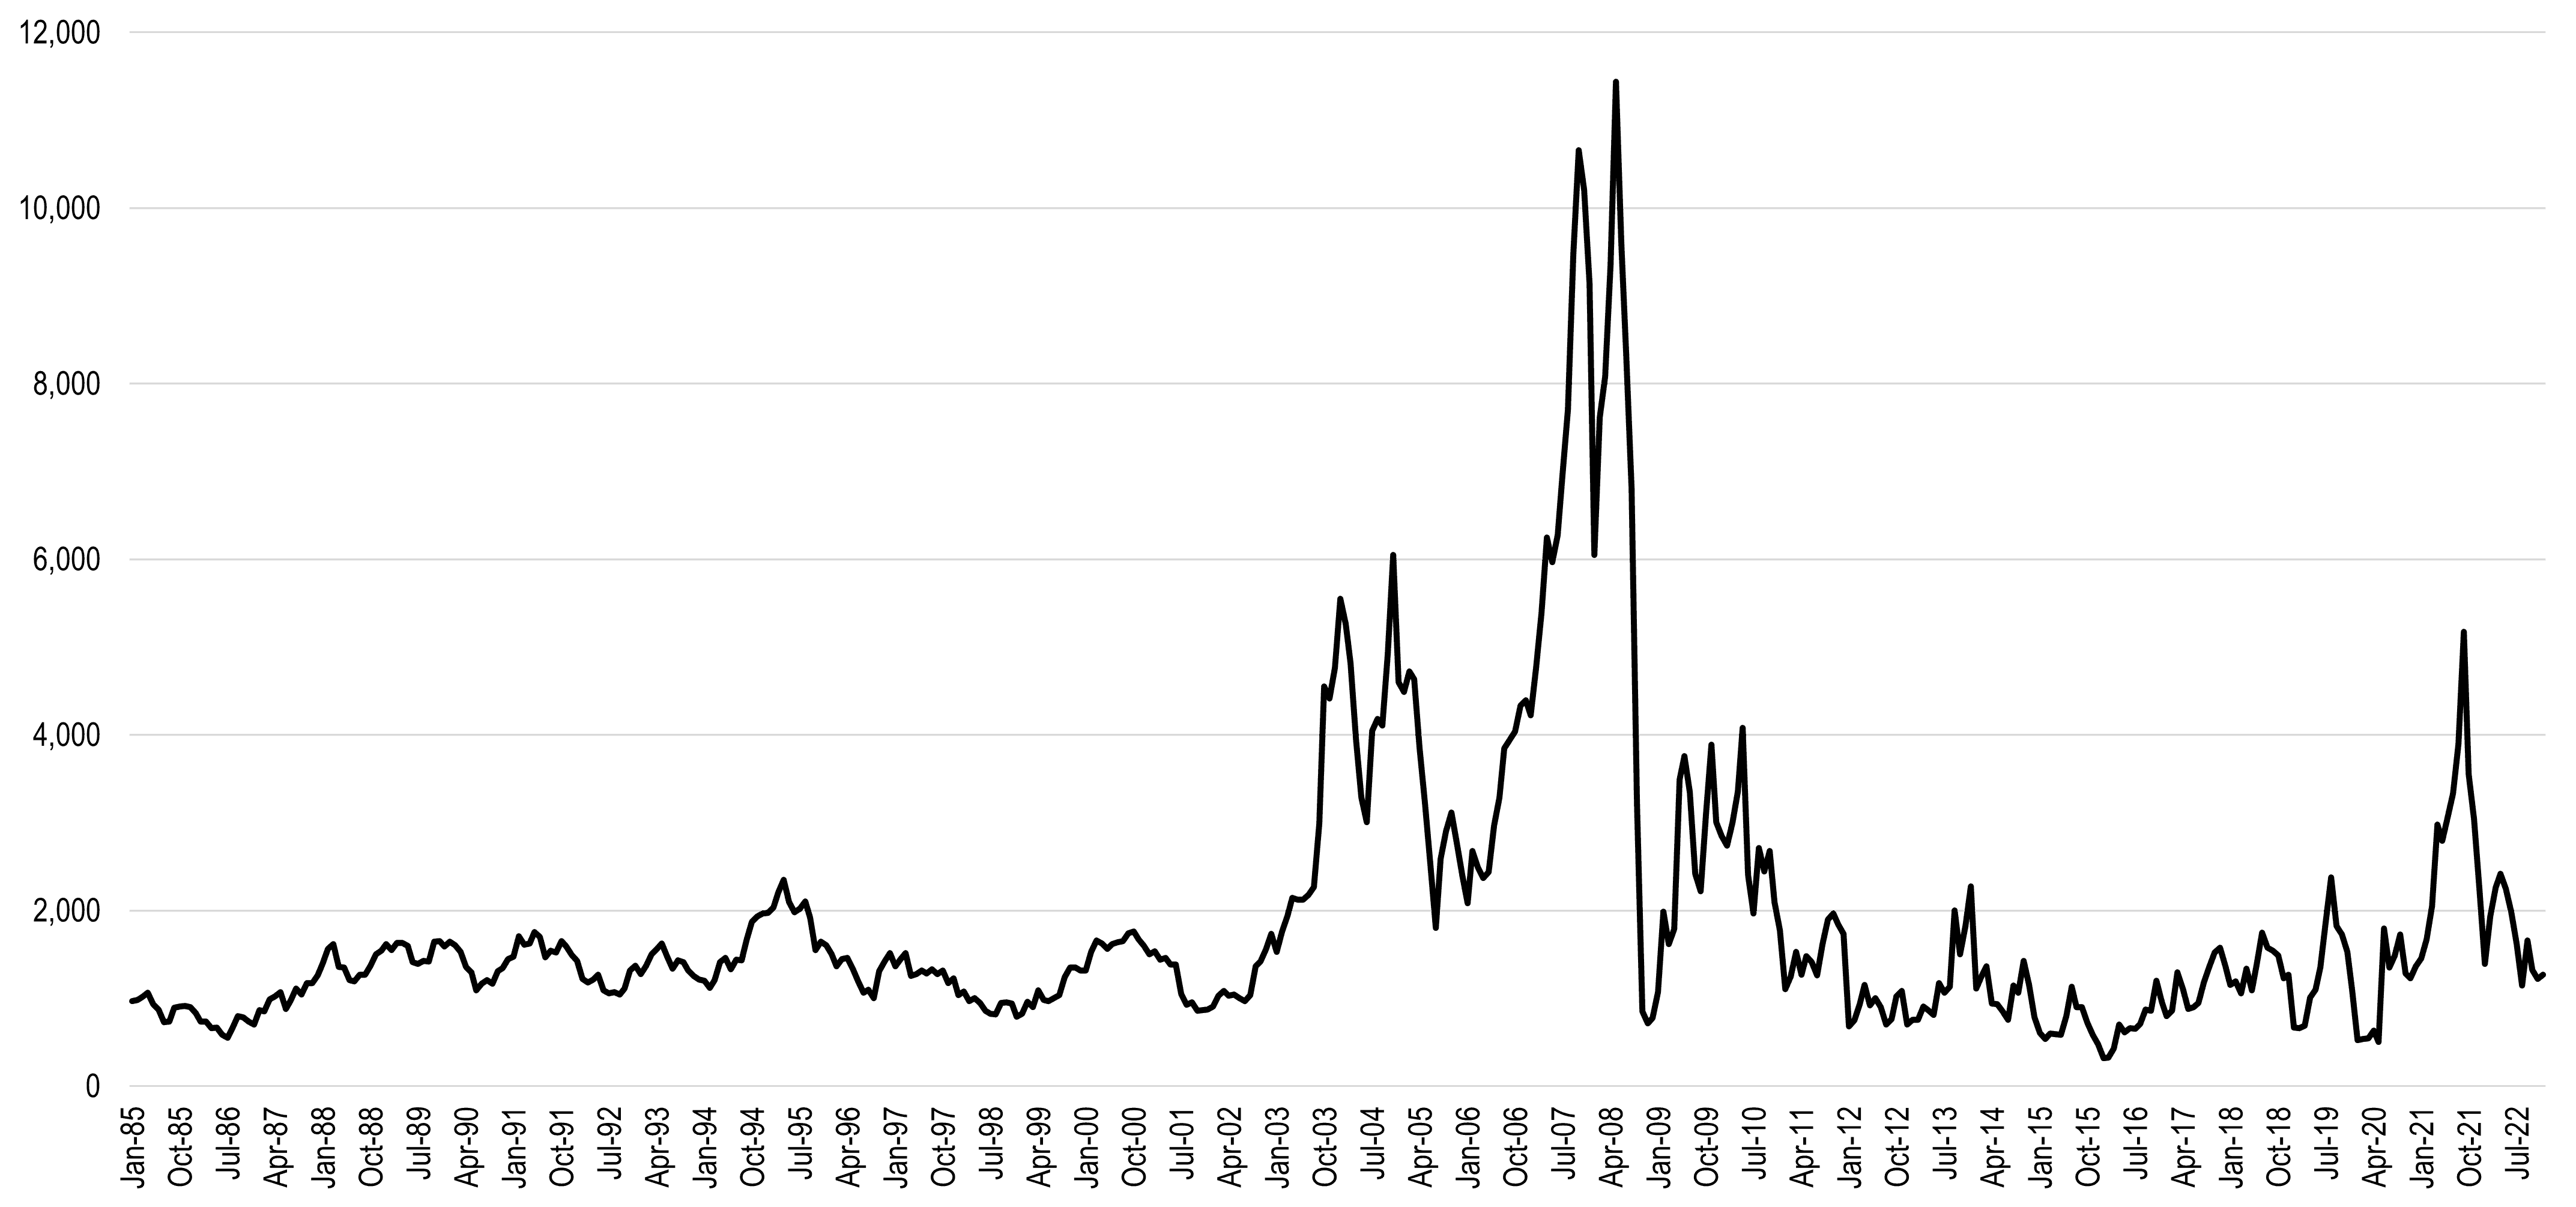
The Baltic Dry Index (BDI) is an assessment of the average price to ship raw materials (such as coal, iron ore, cement and grains) on a number of shipping routes (about 50) and by ship size. It is thus an indicator of the cost paid to ship raw materials on global markets and an important component of input costs. As such, the index is considered as a leading indicator (forward looking) of economic activity since it involves events taking place at the earlier stages of global commodity chains (the procurement and transformation or raw materials). A high BDI index is an indication of a tight shipping supply due to high demand and is likely to create inflationary pressures along the supply chain. A sudden and sharp decline of the BDI is likely to foretell a recession since producers have substantially curtailed their demand leaving shippers to substantially reduce their rates in an attempt to attract cargo. Like all market indexes, the BDI is constantly changing, reflecting its price discovery mechanism.
The above graph underlines that the BDI has been very volatile in recent years, particularly between 2005 and 2009 when it behaved as a bubble. The main driver of this surge was linked to commodity prices, particularly oil. The index then plummeted back to historical levels and has remained weak in spite of a recovery in global trade. A factor is that many ships were ordered during the “bubble years” and have entered the market, providing capacity growth above demand growth. In recent years the BDI remains low, underlining a situation of excess capacity in the shipping industry.
https://www.mcoscillator.com/learning_center/weekly_chart/baltic_dry_index_leads_stock_prices/
"Starting a couple of years ago, the BDI also became useful as a leading indicator for the stock market. Its movements now tend to show up about 25 trading days later in the movements of the SP500. That’s a pretty fun insight, because it can tell us ahead of time about the future movements of stock prices."
I wish I had a good answer to the question of why it really did not work all that well before August 2017, and also why it has correlated well since then. I do not have that answer, but I see that it is so. I also see that what lies ahead on this agenda is a big rebound by the BDI which is now due to get echoed by the SP500.
Tom McClellan
Editor, The McClellan Market Report
Once considered one of the major indicators for stocks, the BDI has lost its cachet somewhat in the aftermath of the recession, when the index fell dramatically as stocks made their recovery. It is important to remember though that, like all indicators of price, it is subject to the influences of both supply and demand, and in the case of ships, supply is slow to come online.
The declines in the index from 2010 to 2015 seem to have been more about new ships coming into service that had been commissioned during the boom that preceded the recession than a decline in demand. That has presumably worked its way through the system now, a contention supported by what has happened so far this year.
Now for the main point related to why Richard brought this up:
The lagging transports might worry you even if you’re not a follower of the Dow Theory. That’s because the transportation sector is widely considered to be a leading economic indicator, on the basis that this sector will be among the first to signal coming economic weakness.

As I’ve pointed out before, there is empirical support for this theory. According to research conducted by the Bureau of Transportation Statistics of the U.S. Department of Transportation, declines in the sector have, at least over the last three decades, led economic slowdowns by an average of four to five months.
This is certainly enough reason to sit up and take notice. This backdrop provides context for the extraordinary rally of the Baltic Dry Index, which reflects the cost of moving raw materials by ship. Many analysts pay close attention to this index, and it has many notable successes in presaging economic downturns, as detailed in a 2016 New Yorker article entitled “The Surprising Relevance of the Baltic Dry Index.”