We've started the week with colder forecasts than when we ended last week.
The front month November expires tomorrow also and some additional short covering has likely provided some ammo.
Natural Gas Intelligence after the close on Monday:
Colder Shift in Weather Data Leads to Big Gain for Natural Gas Futures; Cash Rallies Too
5:21 PM
Natural gas futures surged Monday as all weather models trended colder for the coming weekend and next week. Even with production hitting another new high, a strong cash market helped send the November Nymex contract up 14.6 cents to $2.446/MMBtu. December climbed 9.6 cents to $2.555.
Previous posts earlier today:
Monday Weather:
https://www.marketforum.com/forum/topic/41897/
Colder than Friday with potential for much colder in Great Lakes/Northern Tier in week 2 and beyond if -AO pattern flex's it's meteorological muscle in pushing cold air in Canada southward.
Associated with this pattern is a powerful upper level ridge(Alaska and vicinity) and downstream trough(Southeast Canada to Upper Great Lakes) couplet that is very favorable for cold air delivery southward, across Canada into the US. ....especially cold from the Plains to Midwest to Northeast.
Re: Re: Re: Re: Natural Gas October 14, 2019
metmike: The last run of the 6z GFS ensembles after 6am was especially cold(had around 10HDD's more than yesterdays 12z run for instance). Entirely from an early week 2 cold wave.
The AO looks to be plunging strongly negative during week 2 and we are getting into the time of year when that can be a big contributor in flushing cold air masses from high latitudes to the middle latitudes............so moderation in temperatures in November will have this indice against it.
https://www.marketforum.com/forum/topic/15793/
With such a wide spread opening up during week 2, there is a higher than usual amount of uncertainty.
++++++++++++++++++++++++++++++++++++++++++++++++++++++++++++++
US 12z operational model was MUCH warmer than any recent runs. This caused the brief spike down just before noon.
Ensembles were colder early in week 2 but much warmer after that.
There could still be a spike higher from NGX expiring but unless the models turn much colder late in week 2, the highs are probably in.
Confirmation of that would be when/if we fill the gap higher from last night and trade down to Monday's high of 2.479 for NGZ.
This would lay down a gap and cap, very negative chart formation........when the price opens higher than the previous days highs, then is no longer able to hold those gains, and trades back into the previous days range.....suggesting a buying exhaustion just took place.
Weather models, like the European model could save the day as early as a couple of hours from now if they come out much colder than these US model solutions.
++++++++++++++++++++++++++++++++++++++
Operational European model, unlike the GFS operational model was colder. Looking at the total heating degree days on the GFS ensemble products, which came out earlier, they were close to the previous model.
The European ensemble is COLDER overall too by a fairly significant amount but has the moderating at the end.
We are seeing the front month experiencing a HUGE spike higher here, one of the risks of natural gas prices when get this close to expiration(tomorrow)....especially in a ng, which has some long lived HUGE spec shorts that have had to cover ahead of expiration.
October 28, 2019 update:
The dominant imposing factor for prices this year has been massive, record large injections that have increased supplies faster than any time in history and crushed prices.
Prices plunged from 3.000 during the Spring down to below 2.200 in early August, when we hit a seasonal bottom. Cheap prices and record heat on weather models, then propelled us to an impressive short covering rally to just above 2.700 in mid September. The record heat continued into early Oct. but it was just too late in the cooling season to help anymore and prices collapsed, while injections were bearish vs expectations.
The market has been getting some support from cold in the next 2 weeks. However, seasonals often turn down in this time frame thru November, particularly when temperatures are mild. Prices are pretty low right now, however and the early season cold has attracted more speculative buying than late season cold.
Why is that?
In March/April, the market knows that Spring is right around the corner and the cold's staying power is limited. In Oct/Nov sustained cold that stick around and defines Winter has the potential to use up a lot of natural gas and draw down storage significantly. This Winter, it will take much colder than usual temperatures to achieve that because supplies are gushing in.
NG 7 days
Natural gas 3 months below
This seasonal price chart below is for 2 decades, ending back in 2009.
We should note from this chart that prices often bottom in late August................and we did have a bottom in that time frame with a stronger than usual rally in September, thanks to the heat using up so much natural gas for cooling.
That top was well defined in September and it will take some sustained, cold to go higher than that.
Late October thru early December is very often a weak period for ng prices. When its warm during that period, its extraordinarily tough for prices to go up.  Seasonal Chart")
11:34 AM
The Energy Information Administration (EIA) reported an 87 Bcf injection into natural gas storage inventories for the week ending Oct. 18, coming in.
++++++++++++++++++++++++++++++++++++++++++++++++++++
for week ending October 18, 2019 | Released: October 24, 2019 at 10:30 a.m. | Next Release: October 31, 2019
| Working gas in underground storage, Lower 48 states Summary textCSVJSN | |||||||||||||||||||||||||
|---|---|---|---|---|---|---|---|---|---|---|---|---|---|---|---|---|---|---|---|---|---|---|---|---|---|
| Historical Comparisons | |||||||||||||||||||||||||
| Stocks billion cubic feet (Bcf) | Year ago (10/18/18) | 5-year average (2014-18) | |||||||||||||||||||||||
| Region | 10/18/19 | 10/11/19 | net change | implied flow | Bcf | % change | Bcf | % change | |||||||||||||||||
| East | 898 | 880 | 18 | 18 | 823 | 9.1 | 886 | 1.4 | |||||||||||||||||
| Midwest | 1,069 | 1,044 | 25 | 25 | 930 | 14.9 | 1,034 | 3.4 | |||||||||||||||||
| Mountain | 208 | 205 | 3 | 3 | 177 | 17.5 | 209 | -0.5 | |||||||||||||||||
| Pacific | 297 | 296 | 1 | 1 | 262 | 13.4 | 322 | -7.8 | |||||||||||||||||
| South Central | 1,134 | 1,093 | 41 | 41 | 893 | 27.0 | 1,129 | 0.4 | |||||||||||||||||
| Salt | 268 | 246 | 22 | 22 | 216 | 24.1 | 303 | -11.6 | |||||||||||||||||
| Nonsalt | 866 | 847 | 19 | 19 | 677 | 27.9 | 825 | 5.0 | |||||||||||||||||
| Total | 3,606 | 3,519 | 87 | 87 | 3,087 | 16.8 | 3,578 | 0.8 | |||||||||||||||||
Totals may not equal sum of components because of independent rounding. | |||||||||||||||||||||||||
Working gas in storage was 3,606 Bcf as of Friday, October 18, 2019, according to EIA estimates. This represents a net increase of 87 Bcf from the previous week. Stocks were 519 Bcf higher than last year at this time and 28 Bcf above the five-year average of 3,578 Bcf. At 3,606 Bcf, total working gas is within the five-year historical range.
For information on sampling error in this report, see Estimated Measures of Sampling Variability table below.

Note: The shaded area indicates the range between the historical minimum and maximum values for the weekly series from 2014 through 2018. The dashed vertical lines indicate current and year-ago weekly periods.
https://www.investing.com/economic-calendar/natural-gas-storage-386 Latest Release Oct 24, 2019 Actual87B Forecast88B Previous104B
| Release Date | Time | Actual | Forecast | Previous | |
|---|---|---|---|---|---|
| Oct 31, 2019 | 10:30 | 88B | 87B | ||
| Oct 24, 2019 | 10:30 | 87B | 88B | 104B | |
| Oct 17, 2019 | 10:30 | 104B | 106B | 98B | |
| Oct 10, 2019 | 10:30 | 98B | 97B | 112B | |
| Oct 03, 2019 | 10:30 | 112B | 105B | 102B | |
| Sep 26, 2019 | 10:30 | 102B | 89B | 84B |
Temperatures that were used for last Thursdays EIA report:
Temperatures for this Thursday's EIA report:
Previous posts:
By wxgrant - Oct. 21, 2019, 7:11 p.m.
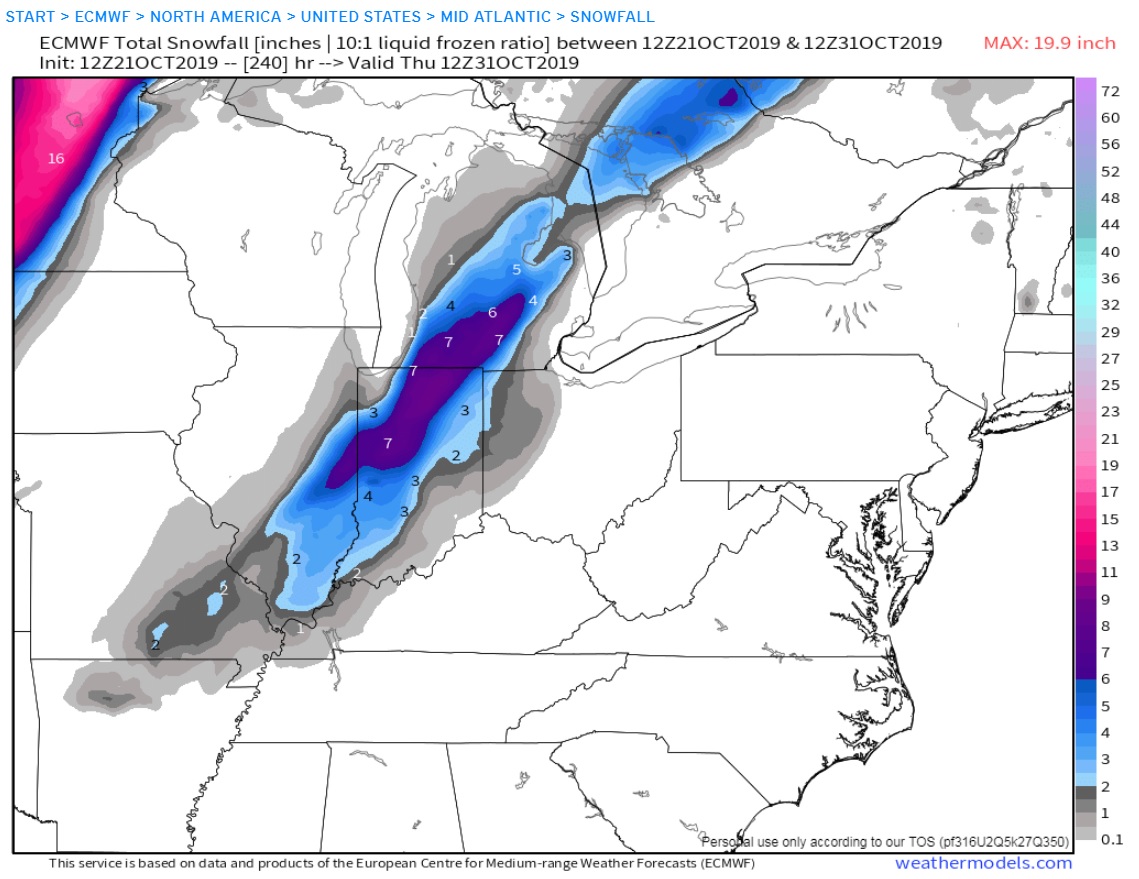
1993 anyone? This is the 240hr Operational Euro which is painting some snow the morning of Halloween. I know it probably won't happen but I love winter weather and I'm glad it's that time of the year where hour 240 is always interesting somewhere :-) . There was a huge cold air outbreak around Halloween 1993. Snowed as far south as Montgomery Alabama that day.
++++++++++++++++++++++++++++++
By metmike - Oct. 21, 2019, 7:42 p.m.
Thanks Grant!
I remember that one vividly and it was actually the day before Halloween here in Evansville, Oct 30th which was a Saturday.
I went sledding with the kids and we made a snow man in the backyard.
I went Trick or Treating with the kids the next day with the snow on the ground and sub freezing temps.
I'm guessing our snow was just over 6 inches and it was a record for October but will retrieve the records.
Snow storms have always been my favorite too. When I moved down here in September 1982 from Cincinnati(6 months) to be chief meteorologist at WEHT after living in Michigan, it was thought to be temporary and farther south than I would have preferred because of less snow(but I was going to any tv station that would hire me-including applying at Fairbanks Alaska)
++++++++++++++++++++++++++++++
By metmike - Oct. 21, 2019, 7:55 p.m.
OK, we got a total of 4.6 inches from that event, 3.7 inches fell on October 30th(most of which was very early in the morning.
The 3.7 inches is a record for 24 hours in October.
Our record snow for November is 6.9 inches set on the 28th in 1958.
That snow event in 1993 is the biggest snow in the records until the event on Nov 28th almost a month later to show how anomalous the Oct 1993 event was.
Go to snowfall at the link below
https://www.weather.gov/pah/EvansvilleDailyNormalsAndRecords
Maybe I can retrieve some wx maps of that storm now.
++++++++++++++++++++++++++++
By metmike - Oct. 21, 2019, 7:58 p.m.
OK, even better:
+++++++++++++++++++++++++++++++++++
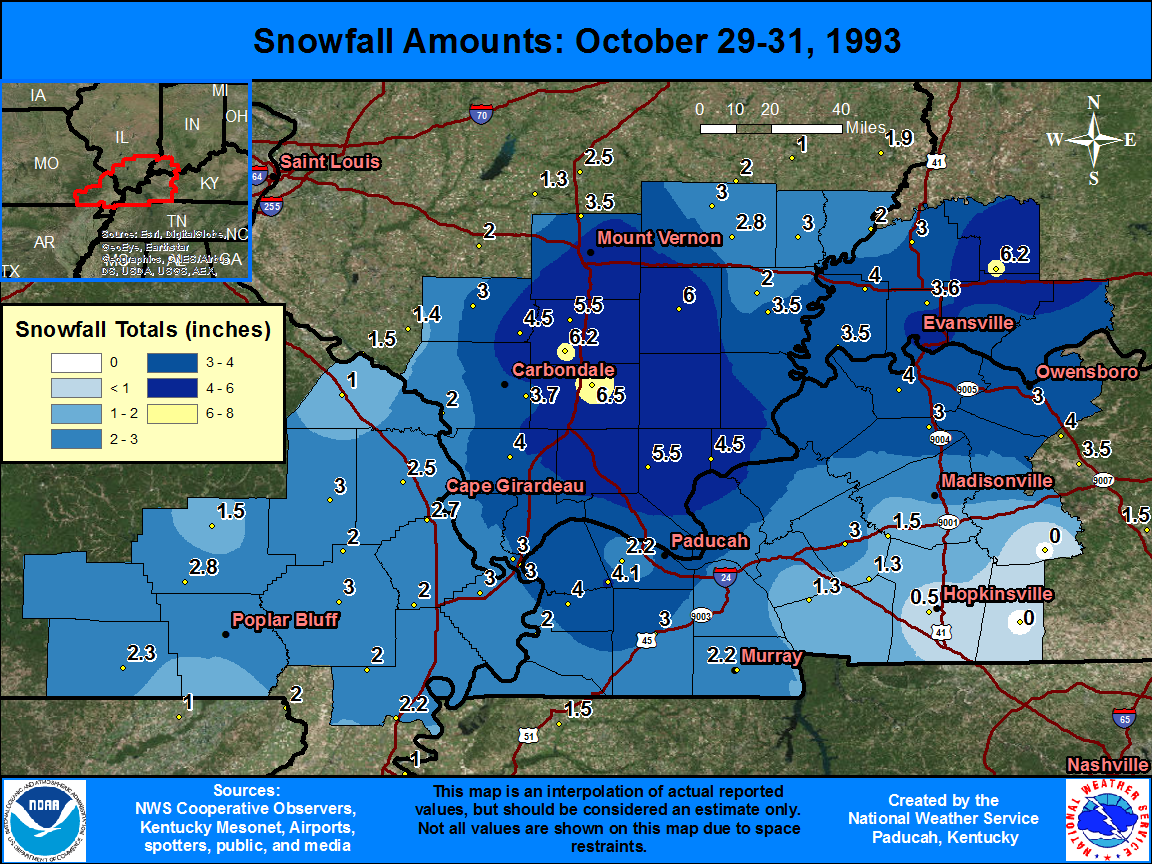
By metmike - Oct. 21, 2019, 8:06 p.m.
https://www.youtube.com/watch?v=uzosOgVFQJY
A surprise snowstorm hit the Cincinnati area on the weekend of Oct. 30-31, 1993. When it ended on Sunday, there were 6.2 inches on the ground, marking the first White Halloween on record in the region. The 5.9 inches of snow on Saturday – Halloween Eve - was a record for a single day in October. The next day, the coldest high temperature for Halloween - just 36 degrees – kept a lot of trick-or-treaters home.
++++++++++++++++++++++++++++
By wxgrant - Oct. 21, 2019, 9:43 p.m.
I was going to grab that image from Paducah, I see you got it. As for my thoughts on November, I think we will start off below average for the first week to ten days and then modify. The question is how warm by week three. That can be bad as a warm third or fourth week in November usually ends in some sort of severe weather outbreak. As for my position in NG, I hope it doesn't get too warm that third week.
+++++++++++++++++++++++++++++++++
By cutworm - Oct. 21, 2019, 10:42 p.m.
I remember taking the kids Trick or Treating that year! Great memories! Should have had abominable snow man costumes!
++++++++++++++++++++++
By metmike - Oct. 22, 2019, 9:57 a.m.
Thanks cutworm!
++++++++++++++++++++
Below is the latest 768 hour European model, picking up where the other models end, at 384 hours, towards the end of the 2nd week in November(12th)....then going out at 24 hour intervals to November 29nd.
Not sure how much the market will pay attention. Weeks 3 and 4 look fairly mild on this particular run of this low skill product. If it were to verify, natural gas prices will likely be lower in November than they are now.
The 0z Guidance has come in MUCH colder by a wide margin.
It is so interesting that I knew that just by looking at my NG position. That market moves with each model run.
Natural gas trading on temperatures in the HDD/cold weather season is some of the best.
The wild card this time that is enhancing the spike higher is the expiration of the front month, November.
If the models turn milder this week, ng will likely collapse lower. The strongly -AO and slightly -NAO favor colder.
Natural Gas Intelligence after the close:
Natural Gas Market ‘On Edge’ as Weather Models Shift Colder
5:09 PM
The sharp swings higher just keep coming for natural gas futures. With another solid shift to the colder side in the latest weather models, the November Nymex gas futures contract expired Tuesday some 15.1 cents higher at $2.597. December, which takes the prompt-month position on Wednesday, rose a more moderate 8.4 cents to $2.639.
MetMike
I am 'surprised' at the strength Mon/Tu, as I had suspected strength from Wed/Th into Friday peak FROM a cycle point of view.
HOW much weather can be thrown at this rally?
When does MetMike/TJC buy puts or outright sell??
How 'cold' is next week? Then the two weeks thereafter?
MOST importantly, put my golf clubs away? (NC Illinois)
"When does MetMike/TJC buy puts or outright sell??"
I never buy options.
I shorted earlier but don't want to be short if the models turn much colder overnight.
If they don't the highs are likely in.............unless the models turn sharply colder soon.
My long position is still looking good. Getting more and more theta from that call I sold against my long Jan Contract. I am hoping we actually have a drop towards the middle of November and then I plan to sell a 16 Delta Put to collect more premium. The 16 delta put it too high for me right now.
Be sure to take some snow photos for us in NC Illinois!
Congrats Grant!
I was thinking of you when natural gas was going higher last night.
My bias is obviously short here and it would take MUCH colder models for me to be long again.
The massive spike high that we just had near the end of October on the front month expiration the last few days is textbook for putting in the Autumn highs if the pattern morphs to milder in November. This rally was more than I was expecting last week but we added alot of cold since then.
I still think that a very mild November(after a cold start) can push us down close to $2.
If we come in next week with mild forecasts in week 2 and beyond, (I think) the large specs will pile on the shorts again with no mercy.
Sustained, widespread cold in the eastern half of the country can bring us back close to the September highs, which were just under $2.9.
We have a daily gap higher from Sunday night that is still open from 2.480(Fri high) and 2.499(Mon low). This happened because of all the additional cold added to the forecast this week.
At this time, it looks likely that milder days at the end of the forecast will be replacing colder ones at the start. This is the recipe for lower prices........unless we add a big amount of HDD's in the middle(especially early week 2), which is what happened last night.
I do think it drops as the second half of November looks mild compared to the first two weeks. I am betting it rises again going into December so that's what I am holding out for and also why I sold a call against the position. I wish I would have sold another call this afternoon but I didn't want to get to big in my position.
Thanks,
I covered my small short, with a stop at just better than the price that I got in and will wait for the overnight guidance to show a big change before doing another ng trade.
With the -AO and models underforecasting the cold(getting colder vs warmer on most runs this week) I am not very confident in being short.
The gfs ensemble was milder and so was the euro operational and we made new lows. I was short right after the gfs but we are back up and I was out 2 hours ago. This is one reason I never include trades. I am in and out so often and would have to double my posts just reporting that as well as people not having a chance to get in or out the second a model run changes and I report it minutes or longer later.........and I’m not getting paid for this just trying to share authentic information to help others understand the markets to make better decisions for themselves.
Of course I am wrong sometimes too.
Tjc will often ask my position or plan and I’m happy to state it if asked.
I think that the trades grant shares here are more useful and viable for traders to utilize as profit making opportunities.
I seriously want you all to pay attention to his trades and solid reasoning.
He has the mindset, plan and discipline to use it based on well define criteria that he generously shares.
Many of my trades are just jumping in and out based on knee jerk reactions to weather model changes. You really don’t want to be doing that.
The very jumpy not consistent 6z gfs is the opposite of recent models. It’s much warmer in the middle then is much colder After that.....after day 10
The GFS ensemble mean after 6am showed much more cold during the 11-14 day period, around 9 HDD's more than the previous solution for that period(the models had been getting milder late in week 2 but this reversed that).
Very impressive to take out yesterday's spike highs on this additional cold.
Forecasts Continues to Show November Cold as Natural Gas Futures Called Higher
8:59 AM
Wednesday Weather(last GFS ensemble brought a much stronger wave of cold in week 2). I am looking to sell still but am flat.
GFS operational and even the ensemble continues all over the place.
With different amounts of warmer and colder vs previous runs depending on how much northern stream and southern stream flow dominated with individual waves.
I sold at 2.690 earlier but had to put in a tight stop 2.685 at some random number after we spiked lower than that which was just minutes later because the volatility is too much and we could spike back above 2.7 in a flash if the market wants to focus/trade on the cold periods..which it has recently.
The 12z GFS ensemble mean is clearly MUCH warmer in week 2 reversing the much colder previous, 6z solution that got ng fired up after 6am.
This caused the big spike lower to 2.666, now we're back to 2.685.
Overall the ensemble is more bearish/less bullish.
Our late corn crop is also a factor for increased NG and LP gas usage. More of the corn crop is requiring artificial drying than usual and there's more talk of LP supply issues so one would expect more strain on Natty gas as a few grain dryers use NG instead of LP gas. .02
I would have never thought about the corn impact. Thanks. Something to remember for the future.
From Natural Gas Intelligence after the close:
Lower Production, Frigid Outlook Spook Nymex NatGas Ahead of Fresh EIA Data
5:22 PM
A sustained drop in natural gas production and relatively stable weather outlooks were enough to propel Nymex futures higher on Wednesday despite expectations for upcoming government storage data to reflect a much larger-than-normal injection.
There was actually an issue with regards to propane being drawn down in late 2013 because of record demand to dry a record corn crop.
https://www.eia.gov/todayinenergy/detail.php?id=18231
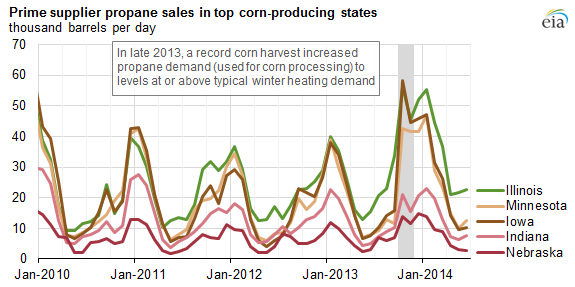
Source: U.S. Energy Information Administration, Petroleum Marketing Monthly
The weather influences both the moisture content of the crop and when it reaches maturity. If weather is favorable, farmers may let their corn dry in the field, especially if there is not a price incentive to get it to market right away. Last year, propane demand in the top five corn-producing states increased in October to levels that rivaled the normal peak demand in January, drawing down propane inventories before the heating season began. Propane inventories in the Midwest were drawn down by 4.1 million barrels (130,000 bbl/d) in October, which was the largest October stock draw since 1985.
As a result, Midwest inventories of propane started the heating season at relatively low levels and remained at the bottom of the five-year range through December. Logistical problems, including the closure for maintenance of the Cochin Pipeline that transported propane from Canada to the Upper Midwest and disruptions of rail transportation, prevented Midwest inventories from being replenished before winter began. With prolonged cold weather in January and February, propane inventories dipped well below the five-year range.
metmike: Look how low inventories got on the graph below in early 2014 when the Polar Vortex was hitting and many people needed propane for residential heating.
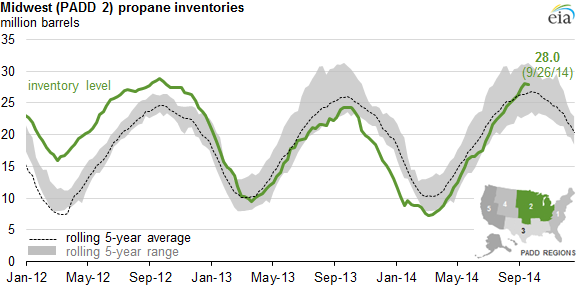
Source: U.S. Energy Information Administration
When the Polar Vortex hit in late January 2014, propane prices continued to soar and reached double the highest price that they were at prior to and since then.
https://www.eia.gov/dnav/pet/hist/LeafHandler.ashx?n=PET&s=W_EPLLPA_PRS_R20_DPG&f=W
I've been unable to determine how much actual additional natural gas demand will occur because of the additional drying of corn or how much the demand/use is during an average season.
Unlike weather demand in the form of heating degree days, which we don't have skillful information about until we get within 2 weeks or so of the period being estimated, this years late corn crop has been well known since June, when it was planted the latest ever. So we always knew there would be hefty drying costs this Fall.
The Fall weather obviously is playing a role too. These cold temperatures are not going to dry corn in the field, so it will be harvested wet and dried using, mostly propane and an uncertain amount of natural gas.
The southeast half of the country(to north of the Ohio River), however that had drought thru September and sustained record heat for much of the month, likely had their crop completely dried in the field last month.
On the crop drying issue I found this from Aug. 26...
http://www.lpgasmagazine.com/flooding-on-the-farm-poses-crop-drying-challenges/
In that article they mention farmers possible leaving the corn stand in the field longer to dry down but we've since seen severe wind events that have since caused stalk breakage and ear droppage. The crop has been under so much stress since being planted late that it is in a very fragile condition from delayed planting and also fertility issues caused by lack of funding for adequate fertilization and/or plants not being able uptake nutrients to progress normally. We've known for many years that when it gets late one either has to buy more time or buy dryer gas...since we can't buy time we buy dryer gas to prevent further yield loss but not everyone can or chooses to do this.
Thanks cliff,
I guess on the late corn and extra drying we have an offsetting factor. Less corn was planted and though the % of the crop that needs to be dried is high, it's not as big as if it was another record.
The other thing is that this is not even close to being the latest crop still in the field right now.
In 2009, we were MUCH farther behind than this year in late October!
National corn harvest progress on October 27 (since 1987)
2009 21%
1992 36
1993 39
2019 41 ****
2008 41
1996 45
2014 49
2017 49
2013 59
2004 59
2018 61
1990 62
1994 62
Another item too, is that even though it will be too cold for much drying, after this system currently exiting, there isn't much precip in the forecast for the next 2 weeks.
The GFS overnight came out with some outlying, crazy warmer solutions in week 2 which caused tiny blips lower in the continued surge higher from the approaching cold.
The more reliable ensembles are getting most of the weighting by the market.
I still think we are putting in a top but that can only happen if being correct that the patter will morph to milder later in week 2.
That’s still what I’m thinking at the moment but am willing to adjust colder when guidance shifts that way.
NGI From Thursday morning:
Chilly Forecast Still Giving NatGas Market Shivers as December Called Higher
8:58 AM
Additional cold trends in the overnight guidance, albeit with a possible endpoint in sight for an upcoming stretch of frigid November temperatures, helped push natural gas futures higher in early trading Thursday. The December Nymex contract was up 3.0 cents to $2.721/MMBtu at around 8:30 a.m
Yes it'll be too cold for natural drying but yesterday I saw many corn dryers running in 20F temps. and it takes a lotta gas to heat 20F air up to 190F-205F dryer plenum temp. And the corn coming in from the field is also very cold. Corn thru put is greatly reduced and it becomes very costly to dry grain at these cold temps.
EIA +89 BCF
| Working gas in underground storage, Lower 48 states Summary text CSV JSN | |||||||||||||||||||||||||
|---|---|---|---|---|---|---|---|---|---|---|---|---|---|---|---|---|---|---|---|---|---|---|---|---|---|
| Historical Comparisons | |||||||||||||||||||||||||
| Stocks billion cubic feet (Bcf) | Year ago (10/25/18) | 5-year average (2014-18) | |||||||||||||||||||||||
| Region | 10/25/19 | 10/18/19 | net change | implied flow | Bcf | % change | Bcf | % change | |||||||||||||||||
| East | 913 | 898 | 15 | 15 | 826 | 10.5 | 895 | 2.0 | |||||||||||||||||
| Midwest | 1,095 | 1,069 | 26 | 26 | 953 | 14.9 | 1,057 | 3.6 | |||||||||||||||||
| Mountain | 211 | 208 | 3 | 3 | 180 | 17.2 | 211 | 0.0 | |||||||||||||||||
| Pacific | 298 | 297 | 1 | 1 | 262 | 13.7 | 324 | -8.0 | |||||||||||||||||
| South Central | 1,178 | 1,134 | 44 | 44 | 916 | 28.6 | 1,156 | 1.9 | |||||||||||||||||
| Salt | 293 | 268 | 25 | 25 | 232 | 26.3 | 317 | -7.6 | |||||||||||||||||
| Nonsalt | 885 | 866 | 19 | 19 | 685 | 29.2 | 840 | 5.4 | |||||||||||||||||
| Total | 3,695 | 3,606 | 89 | 89 | 3,136 | 17.8 | 3,643 | 1.4 | |||||||||||||||||
Totals may not equal sum of components because of independent rounding. | |||||||||||||||||||||||||
Working gas in storage was 3,695 Bcf as of Friday, October 25, 2019, according to EIA estimates. This represents a net increase of 89 Bcf from the previous week. Stocks were 559 Bcf higher than last year at this time and 52 Bcf above the five-year average of 3,643 Bcf. At 3,695 Bcf, total working gas is within the five-year historical range.
For information on sampling error in this report, see Estimated Measures of Sampling Variability table below.
Note: The shaded area indicates the range between the historical minimum and maximum values for the weekly series from 2014 through 2018. The dashed vertical lines indicate current and year-ago weekly periods.
EIA’s High Side 89 Bcf Storage Injection Sends December Natural Gas Prices Lower
11:26 AM
The Energy Information Administration (EIA) reported an 89 Bcf injection into natural gas storage inventories for the week ending Oct. 25, coming in on the...
Both the operational GFS and Ensemble came out mild in week 2. 3rd run in a row for the operational.
NG under selling pressure.
Key reversal down from early morning highs looks like it might be in play.
I was short from 2.646 and covered when we spiked to the lows just from using the warmer guidance but if I was smart, would stay short here.........looking to do that if we have a nice bounce.
Halloween weather from earlier:
https://www.marketforum.com/forum/topic/42123/
Overnight GFS operational model was incredibly milder and a stark outlier but appears to have possibly been ahead of the other models which have come in milder at 12z.
This is the pattern change that I've been expecting.......MUCH milder Pacific flow undercutting the cold coming down from Canada from the dominant northern stream that brought down this extreme cold.
The models have greatly underestimated the tenacity and strength of the northern stream over the last week(which is why we were adding copious HDD's to the forecast earlier this week and helping ng to spike higher).
With that being the case, we will watch for additional cold surprises or potential northern stream regaining control in week 2.
The 12z European ensemble, which comes out last, after 2pm was not as mild as the other models, so we had a bit of a bounce to 2.644.
Good place to be short if models continue mild, which would confirm todays huge downside reversal mentioned this morning.
Models can turn colder again though but if they don't we could visit Sunday Nights gap higher pretty quickly at the start of next weeks trading.
You will note that the NWS extended forecasts were still very cold thru the 8-14 day. Thy were based on colder overnight guidance and are often a couple of days behind the market reaction.
For instance, if this pattern change continues, it was first well recognized by market action this morning/early pm in natural gas. It might start showing up tomorrow on NWS maps, then be pretty obvious over the weekend with the cold exiting stage east and warmth arriving from the west.........again, this would only be if the last model runs don't turn colder again.......which might happen.
In that scenario, on Sunday NIght we might have some pretty mild maps and a gap lower open. However, don't use that as anything other than a prediction IF the pattern continues warming up because if it reverts to colder again, you won't want to be short.
metmike: The main factor was all the models getting milder in week 2.
With this last Ensemble mean....6z run being a bit colder again, we had a bounce from the very early morning lows.
Some of the guidance wants to take us back into this cold, northern steam driven regime at the end of the period.
NGI Friday morning:
Natural Gas Futures Called Lower as Models Shift Warmer
8:59 AM
metmike: That shift warmer actually happened Thursday morning but has not been added to.......in fact, the last 6z GFS ensemble was COLDER than the previous runs and caused strength in ng, to the point that we even traded higher for a short while on a couple of occasions.
There's a battle between the cold northern stream and mild southern stream going on is week 2 and the models are going back and forth on it.
Friday weather: https://www.marketforum.com/forum/topic/42184/
GFS is colder. Ensemble MUCH colder for that product after day 10.
NG is spiking much higher.
The much colder solutions the last 2 runs have us spiking high enough to negate yesterday's huge price reversal lower from warmer week 2 forecasts then.
NGI Friday close:
Natural Gas Futures Rally on Weather, But Model Disagreement Sets Up ‘Big Risks’ for Prices
Early-winter volatility continued in the natural gas futures market Friday as colder-trending weather data helped launch a swift midday rally. After trading as low as $2.575/MMBtu, the December Nymex contract went on to settle near the session’s high at $2.714, up 8.1 cents on the day. January picked up 7.0 cents to settle at $2.802