weather note: For those of us here in central IND this is THE driest April 5th to June 5th (60 days) on record dating back to 1871 by a decent bit too. 7th driest for Decatur IL. The next round of heat late week looks to bring mid-upper 90s esp. w/these soils. #ILwx #INwx #AGwxer note: Michael Clark@Met_mdclark
Glad you brought this up bcb. I knew it was pretty dry there but had not realized how dry. I drove thru the entire state of Indiana on Sunday. The crop, especially later planted is hurting bad for moisture in Central Indiana. The rest of it looks ok, while the southern 1/3rd looks wonderful from recent rains.
You can go to this link to see rain totals from recent time periods:
https://water.weather.gov/precip/
Go to precipitation, then scroll down to pick a time frame. Hit states to get the borders to see locations better. Under products, you can hit %normal.
You can see how big the dry pockets are right now. Since the crop ratings are near the best ever 78% GD/EX corn and 75% beans, clearly this dryness has not effected the condition of the overall crop yet.
bcb,
Let's use your post as the starting point for our weather thread. The models over the last 2 months have been woefully overforecasting rains.
Meteorologists like me that use the models for guidance have also forecast too much rain.................by a wide margin.
Am guessing that very warm air aloft that gets in drawn in here(from the S.Plains dome) along, with bone dry soils in that region cutting down on moisture available from that direction is suppressing rains up here ahead of weather systems that would otherwise produce huge rains.
Here is the last GFS forecast for rains the next 2 weeks. Note widespread massive rains. Will it verify this time?

Lots of rain the next 7 days in most places in the main belt. IA at the epicenter for heaviest totals.............and the market is looking ahead at this and wet week 2.
Hopeful for mcfarm.
http://www.wpc.ncep.noaa.gov/qpf/fill_94qwbg.gif?1526306199054
http://www.wpc.ncep.noaa.gov/qpf/day2.shtml
http://www.wpc.ncep.noaa.gov/qpf/day3.shtml
http://www.wpc.ncep.noaa.gov/qpf/95ep48iwbg_fill.gif?1526306162
http://www.wpc.ncep.noaa.gov/qpf/97ep48iwbg_fill.gif?1526306162
Total accumulation
http://www.wpc.ncep.noaa.gov/qpf/p168i.gif?1526397762
Just a slight risk of excessive rains in a few spots:
Excessive Rainfall Forecasts
Mesoscale Precipitation Discussions
Current Day 1 Forecast Valid 12Z 06/05/18 - 12Z 06/06/18 |
Day 1 Threat Area in Text Format
| Day 2 and Day 3 Forecasts |
Current Day 2 Forecast Valid 12Z 06/06/18 - 12Z 06/07/18 |
Day 2 Threat Area in Text Format
Current Day 3 Forecast Valid 12Z 06/07/18 - 12Z 06/08/18 |
Some of the storms could be severe:
When the storms pick up, some of them could be severe:
| Current Convective Outlooks | |
|---|---|
Current Day 1 Outlook | Forecaster: Edwards/Smith Issued: 01/1259Z Valid: 01/1300Z - 02/1200Z Forecast Risk of Severe Storms: Enhanced Risk |
Current Day 2 Outlook | Forecaster: Picca Issued: 01/0544Z Valid: 02/1200Z - 03/1200Z Forecast Risk of Severe Storms: Slight Risk |
Current Day 3 Outlook | Forecaster: Picca Issued: 01/0729Z Valid: 03/1200Z - 04/1200Z Forecast Risk of Severe Storms: Marginal Risk |
Current Day 4-8 Outlook | Forecaster: Picca Issued: 01/0830Z Valid: 04/1200Z - 08/1200Z Note: A severe weather area depicted in the Day 4-8 period indicates a 15%, 30% or higher probability for severe thunderstorms (e.g. a 15%, 30% chance that a severe |
The pattern look pretty wet to me in week 2(which is how the market has been seeing it). The models have been way to wet in week 2, so take the below maps for week 3 and 4 with a tiny grain of salt(or drop of water).
This is the CFS model. It shows the somewhat weakened heat ridge moving to the East and pumping in copious moisture and rains to the Cornbelt with deep layered moisture coming up from the Gulf of Mexico.
My personal feeling is that if the heat ridge is in this position, it is going to suppress rains in many areas underneath it............IF the heat ridge is in that location.
http://www.cpc.ncep.noaa.gov/products/people/mchen/CFSv2FCST/weekly/images/wk3.wk4_latest.NAsfcT.gif
TEMPS in week 3, first map below, then in week 4 on the map below that.

Rains in week 3 , first map below, then rains in week 4 below that.
Here is an outstanding source of information:
http://mrcc.isws.illinois.edu/cliwatch/drought/drought.jsp
Note the dryness below:

Conditions Relative to
4-Week Historical Normals
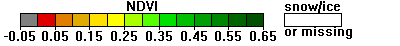
Vegetative health/greenness. Note the effects of the dry pocket that bcb was talking about in c.IL/IN/OH, where there is less greenness. I observed this on my drive thru the entire state of IN on Sunday.
Here is sw.IN the crop looks magnificent. Not so 200 miles to the north.
https://www.star.nesdis.noaa.gov/smcd/emb/vci/VH/vh_browseByCountry.php
United States, Greenness (No Noise NDVI) | |
 | |
Week 2 guidance continuing to get cooler and wetter..............which is what the market saw, starting on Sunday Night's open. It will be nearly impossible for the corn and beans to recover most of their losses until the extended forecasts take out rain and add heat again.
http://www.cpc.ncep.noaa.gov/products/predictions/814day/index.php
Temperature Probability | |
Precipitation Probability | |
https://radar.weather.gov/radar.php?rid=IND&product=NCR&overlay=11101111&loop=yes watch tis band come in a few minutes ago, turn red, take dead aim on our area, and then just disappear....Harley where are you?
mcfarm,
There isn't even supposed to be much chance for rain on your farms until, around the weekend but we know how rain chances in the forecast haven't done much in reality except settle the dust.
Rain tonight:
http://www.wpc.ncep.noaa.gov/qpf/fill_94qwbg.gif?1528241422756
Weekend rains:
http://www.wpc.ncep.noaa.gov/qpf/95ep48iwbg_fill.gif?1528241280
Below is the latest 2 week rain forecast from the 18Z GFS. The massive/widespread heavy rain totals are starting to turn into a joke because they have been too wet for something like 8 weeks in a row.
It would be one thing if they showed spotty rains the entire time and you got unlucky and missed them all. They HAVE showed spotty rains on some solutions last month but half of the solutions since mid April have showed excessive type rains, like this last one.
Back in April, when we were behind on planting I was concerned by these heavy rain solutions. Now, I am concerned because a heavy rain solution, even on numerous successive runs does not mean as much as it used to.
Not sure what is causing this. Maybe warm air aloft from the S.Plains dome is capping air masses farther northeast than expected at times and air masses coming in at the surface, have been lacking direct southerly flow from the GOM and deep layered moisture.
Your dew point right now is 51........dry air, which is being reinforced by the little front that caused the tiny rains.

Latest National Radar. The action will start focusing on the N.Plains/Upper Midwest tonight:

Go to: Most Recent Image
| National |
Mike, we have gone from likely on sat and sunday to a looks now to be a 20 to 30% chance of squat