National Radar Loop:

Go to: Most Recent Image
Rains the next 7 days, graph of totals. Iowa gets bombed. mcfarm still has good chances in the later periods.
Day 1:
http://www.wpc.ncep.noaa.gov/qpf/fill_94qwbg.gif?1526306199054
Day 2:
http://www.wpc.ncep.noaa.gov/qpf/fill_98qwbg.gif?1528293750112
Day 3:
http://www.wpc.ncep.noaa.gov/qpf/fill_99qwbg.gif?1528293842764
Days 4-5:
http://www.wpc.ncep.noaa.gov/qpf/95ep48iwbg_fill.gif?1526306162
Days 6-7:
http://www.wpc.ncep.noaa.gov/qpf/97ep48iwbg_fill.gif?1526306162
Total accumulation
http://www.wpc.ncep.noaa.gov/qpf/p168i.gif?1526397762
mcfarm's forecast from the NWS:
Today
Sunny, with a high near 78. East northeast wind 5 to 7 mph.
Tonight
Mostly clear, with a low around 57. Southeast wind 3 to 5 mph.
Thursday
A 20 percent chance of showers and thunderstorms after 2pm. Mostly sunny, with a high near 88. South southwest wind around 7 mph.
Thursday Night
A 10 percent chance of showers and thunderstorms before 8pm. Partly cloudy, with a low around 66. South wind 5 to 7 mph.
Friday
Partly sunny, with a high near 90. South wind 5 to 8 mph.
Friday Night
A 30 percent chance of showers and thunderstorms. Mostly cloudy, with a low around 69.
Saturday
A 40 percent chance of showers and thunderstorms. Partly sunny, with a high near 87.
Saturday Night
A 30 percent chance of showers and thunderstorms, mainly before 2am. Mostly cloudy, with a low around 67.
Sunday
A 30 percent chance of showers and thunderstorms, mainly between 8am and 2pm. Partly sunny, with a high near 83.
Sunday Night
A 20 percent chance of showers and thunderstorms before 2am. Mostly cloudy, with a low around 65.
Monday
A 20 percent chance of showers and thunderstorms. Mostly sunny, with a high near 84.
Monday Night
Partly cloudy, with a low around 66.
Tuesday
A 50 percent chance of showers and thunderstorms. Partly sunny, with a high near 84.
Severe Storm risk..........WCB today, farther west after that:
| Current Convective Outlooks | |
|---|---|
Current Day 1 Outlook | Forecaster: Edwards/Smith Issued: 01/1259Z Valid: 01/1300Z - 02/1200Z Forecast Risk of Severe Storms: Enhanced Risk |
Current Day 2 Outlook | Forecaster: Picca Issued: 01/0544Z Valid: 02/1200Z - 03/1200Z Forecast Risk of Severe Storms: Slight Risk |
Current Day 3 Outlook | Forecaster: Picca Issued: 01/0729Z Valid: 03/1200Z - 04/1200Z Forecast Risk of Severe Storms: Marginal Risk |
Current Day 4-8 Outlook | Forecaster: Picca Issued: 01/0830Z Valid: 04/1200Z - 08/1200Z Note: A severe weather area depicted in the Day 4-8 period indicates a 15%, 30% or higher probability for severe thunderstorms (e.g. a 15%, 30% chance that a severe |
It's been very dry in parts of the Cornbelt, especially IN/IL the past 60 days:
I drove thru the entire state of Indiana on Sunday. The crop, especially later planted is hurting bad for moisture in Central Indiana. The rest of it looks ok, while the southern 1/3rd looks wonderful from recent rains.
You can go to this link to see rain totals from recent time periods:
https://water.weather.gov/precip/
Go to precipitation, then scroll down to pick a time frame. Hit states to get the borders to see locations better. Under products, you can hit %normal.
You can see how big the dry pockets are right now. Since the crop ratings are near the best ever 78% GD/EX corn and 75% beans, clearly this dryness has not effected the condition of the overall crop yet.
After this weeks weather, crop ratings will likely drop a bit next Monday........from the dry places that don't get rains(which may come next week)
Note the dryness below based on rains compared to normal over the past 4 weeks:
http://mrcc.isws.illinois.edu/cliwatch/drought/drought.jsp

Conditions Relative to
4-Week Historical Normals
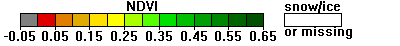
Vegetative health/greenness. Note the effects of the dry pocket in c.IL/IN/OH, where there is less greenness. I observed this on my drive thru the entire state of IN on Sunday.
Here is sw.IN the crop looks magnificent. Not so 200 miles to the north.
The measure of greenness on this graph is often very misleading. A later planted crop can make it look less green for instance than an earlier planted crop.
https://www.star.nesdis.noaa.gov/smcd/emb/vci/VH/vh_browseByCountry.php
United States, Greenness (No Noise NDVI) | |
 | |
Last week's drought monitor.....updated tomorrow. Definately look for an expansion of the drought area(long term moisture/sub soils) on tomorrows update.
http://droughtmonitor.unl.edu/

We haven't got rained on in 2 weeks in my neck of the woods. It has rained around me, Cleveland, Canton but it's getting dry in my little part of Akron.
Went golfing last night and starting to get that extra fairway distance because the ground is getting hard.
careful they will start calling you 300 yard Jim
All the models have been much too wet for the past 2 months. However, the pattern coming up is looking pretty extreme in week 2. It will feature an unusually strong jet stream and possibly a Bermuda High in the far Southeast pumping deep layered Gulf moisture in.
High confidence that if this pattern evolves that there will be a zone of extreme rains over several states, probably the far S. Midwest and/or points south. Take this latest 2 week total rain forecast with a grain of salt but take serious note of the amounts of rain now.
I am getting an excessive rain signal from this potentially extreme pattern. However, rain makes grain and we have been very dry over a large area and these huge rains can only be seen as bearish:
Forecast Hour: 384
Image URL: http://mag.ncep.noaa.gov/data/gfs/12/namer/precip_ptot/gfs_namer_384_precip_ptot.gif
The brightest pinks are 10+ inches of rain. IF the pattern develops like this, that can verify.

I copied an earlier discussion below since its relevant to the pattern.
+++++++++++++++++++++++++++++++++++++++++++++++++++++++++++++++++++++
As Larry and I discussed numerous times, operational model solutions 2 weeks from now, don't display a great deal of skill.....they are jumpy as Larry says.
However, the pattern coming up in week 2 should have one noteworthy feature with fairly high confidence............a powerful jet stream!
Powerful jet streams are more common in the cold months into Spring.
When you have a powerful jet in Summer, it means extreme weather. In fact, it doesn't happen usually unless you have record heat on one side and record type cold on the other side. In between, there is battle that often features extreme rains.
So lets show you the last, 12Z GFS run then comment more on the next page:
gfs_namer_384_200_wnd_ht | gfs_namer_384_500_vort_ht |
gfs_namer_384_1000_500_thick | gfs_namer_384_850_temp_ht |
For late June, thats an incredible jet stream.
Where is buckles will determine the place for a potentially very deep trough and down stream heat ridge.
At this time frame it looks like the trough will initially be in the middle of the country and deepen, and encompass much of the country. .....but notice the strongest jet segment is still upstream on this map, in the Gulf of Alaska area and will drive into the trough, likely to deepen it more.
If that happens in the West, then an upper level ridge builds in the East. We should note a very strong Bermuda High in the far Southeast to, into the Atlantic.
This would be pumped up and build back if the jet energy comes in farther west.
However, initially the jet stream in week 2 is going to focus on the Midwest and bring much cooler air.
My speculation is only with regards to AFTER week 2..............speculation!
Please note that the above discussion is based purely on IF the pattern verifies similar to the very uncertain GFS guidance.
When you have a powerful jet stream........which looks to be the defining element to the week 2 pattern, it can buckle in a completely different place and the extreme weather is the complete opposite in some places compared to its previous buckling location.
We should also note that because it looks so extreme, model to model runs can also show compete flip flops for some locations..........going from a heat ridge with no rain to record rains or from record rains to drier and near record cool temps
I copied some of the individual Canadian ensemble solutions below. The top one is the average. You can see the wide disparity in the individual solutions. Some are the complete opposite of others.
When you have this, you have great uncertainty. It will depend on where the powerful jet stream buckles.
The average usually is best but sometimes, when you have half the members saying one thing and the other half the opposite solution, the average represents something that almost none of the solutions show!
In the solution below, we can have the most confidence of a S.Plains dome continuing because this is a feature that almost all the ensemble members agree on.
384h GZ 500 forecast valid on Jun 22, 2018 12 UTC


Forecasts for the control (GEM 0)
Holy Cow!
The new 12Z European model is very bullish and completely different than its previous solution.............remember, it all depends on where the jet streat buckles and the European model has it happening in a different place now............so the pattern is completely different. WOW. This doesn't mean that its correct, just that, the best model on the planet now has a dome for next week, instead of cooler and wet.
1st map is the latest solution for mid/late next week. 2nd map is the previous solution.
I thought I would check back in to see what was happening. You are providing some really good information here, I see.
Just a note (that you will appreciate) - in a very long "discussion" over at ARS Technika some years back, I was having a disagreement with someone who was working on the climate models. He was adamant that the models were GOOD, because they were built the same way the weather models were built. And, everyone knew that the weather models were good!
Thanks for the analysis. I'll check back in after this.
Welcome back cfdr!
Long time no read. Great to read you. You might enjoy some of the new stuff in the NTR forum too.