National Radar Loop:
Rains in the Plains and WCB right now:
https://radar.weather.gov/Conus/index_loop.php

Go to: Most Recent Image
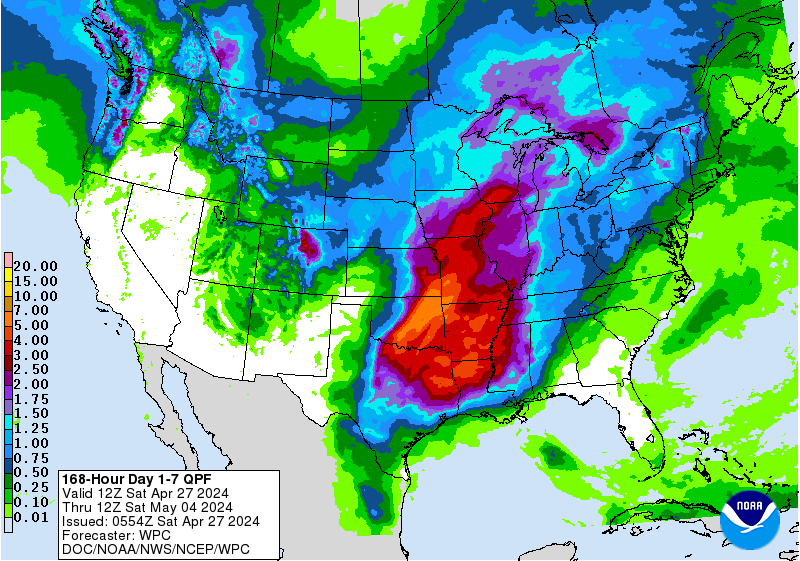
Rains the next 7 days, graph of totals. The I states get bombed(where it counts). mcfarm's farms have better chances.
Day 1:
http://www.wpc.ncep.noaa.gov/qpf/fill_94qwbg.gif?1526306199054
Day 2:
http://www.wpc.ncep.noaa.gov/qpf/fill_98qwbg.gif?1528293750112
Day 3:
http://www.wpc.ncep.noaa.gov/qpf/fill_99qwbg.gif?1528293842764
Days 4-5:
http://www.wpc.ncep.noaa.gov/qpf/95ep48iwbg_fill.gif?1526306162
Days 6-7:
http://www.wpc.ncep.noaa.gov/qpf/97ep48iwbg_fill.gif?1526306162
Total accumulation
http://www.wpc.ncep.noaa.gov/qpf/p168i.gif?1526397762

mcfarm's weather forecast:
Today
A 30 percent chance of showers and thunderstorms, mainly after 5pm. Mostly sunny, with a high near 88. South southwest wind around 9 mph.
Tonight
A 30 percent chance of showers and thunderstorms, mainly before 11pm. Mostly cloudy, with a low around 67. South southeast wind 3 to 6 mph.
Friday
A 30 percent chance of showers and thunderstorms. Partly sunny, with a high near 90. South southwest wind 5 to 7 mph.
Friday Night
A 30 percent chance of showers and thunderstorms. Mostly cloudy, with a low around 69. South wind 5 to 7 mph.
Saturday
A 50 percent chance of showers and thunderstorms. Mostly cloudy, with a high near 87. West southwest wind 6 to 9 mph. New rainfall amounts between a tenth and quarter of an inch, except higher amounts possible in thunderstorms.
Saturday Night
A 40 percent chance of showers and thunderstorms. Mostly cloudy, with a low around 67.
Sunday
A 30 percent chance of showers and thunderstorms, mainly after 2pm. Mostly cloudy, with a high near 84.
Sunday Night
A 40 percent chance of showers and thunderstorms. Mostly cloudy, with a low around 66.
Monday
A 40 percent chance of showers and thunderstorms, mainly before 2pm. Partly sunny, with a high near 85.
Monday Night
A 20 percent chance of showers and thunderstorms before 2am. Partly cloudy, with a low around 66.
Tuesday
A 40 percent chance of showers and thunderstorms. Partly sunny, with a high near 86.
Tuesday Night
A 30 percent chance of showers and thunderstorms. Partly cloudy, with a low around 68.
Wednesday
Mostly sunny, with a high near 85.
It's been very dry in parts of the Cornbelt, especially IN/IL the past 60 days. Upcoming rains will hit the driest spots!
I drove thru the entire state of Indiana on Sunday. The crop, especially later planted is hurting bad for moisture in Central Indiana. The rest of it looks ok, while the southern 1/3rd looks wonderful from recent rains.
You can go to this link to see rain totals from recent time periods:
https://water.weather.gov/precip/
Go to precipitation, then scroll down to pick a time frame. Hit states to get the borders to see locations better. Under products, you can hit %normal.
You can see how big the dry pockets are right now. Since the crop ratings are near the best ever 78% GD/EX corn and 75% beans, clearly this dryness has not effected the condition of the overall crop yet.
After this weeks weather, crop ratings will likely drop a bit next Monday........from the dry places that don't get rains(which may come next week)
Note the dryness below based on rains compared to normal over the past 4 weeks:
http://mrcc.isws.illinois.edu/cliwatch/drought/drought.jsp

As expected, the drought monitor, updated this morning has expanded the drought northeast into IL/IN...........but upcoming rains will shrink it...........after they fall.
http://droughtmonitor.unl.edu/
Comparing the last 2 weeks. Previous week, then this week. Yellows expand across the I states.


Our weather boys here in N. IL has tonight thru Sat. totals of .25 in to 1 in if your lucky. NOT heavy 3-4 in. rains.
Same as I look at Iowa. System moves east and seems lighter..NOT 3-4 in. rains in Iowa
Thanks bcb!
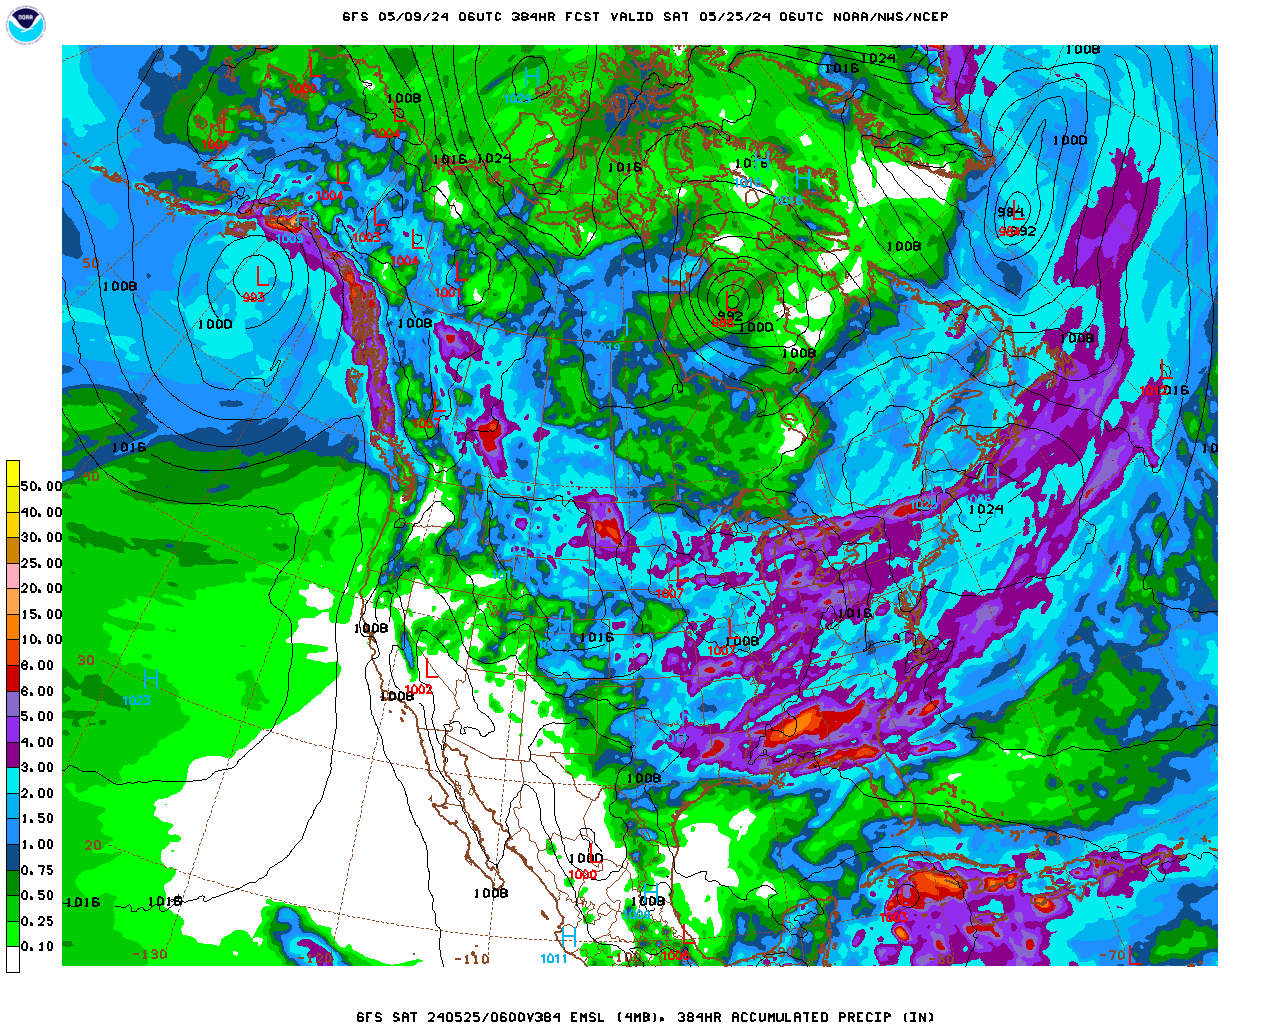
The market is trading the heavier rains. Here are the totals from the last GFS run. The GFS and forecasts have all been MUCH too wet the past 8 weeks.
Forecast Hour: 384
Image URL: http://mag.ncep.noaa.gov/data/gfs/06/namer/precip_ptot/gfs_namer_384_precip_ptot.gif

The longer range, CFS model still wants to build an impressive heat ridge in during week's 3 and 4.
The models struggle with the week 2 forecast, so take this with a grain of salt.
Temps for week 3 and 4

Precip for weeks 3 and 4

The 12Z European is more bullish than any other models again with the heat ridge. Not sure if this particular model, 12Z run is having a problem or seeing something the other models don't or vice versa.
Its not the megadome with 100+ heat like yesterday but is MUCH hotter at day 10.
Latest EURO below, follwed by previous one below that.
These are the 850 mb temperatures the weekend after this one.
100 degree heat from the S.Plains would be pushing into the Midwest, with the heat going to the East Coast after that.
Previous 0Z Euro had the East Coast MUCH cooler.
I should have repeated that along with the updated hotter European model.............TONS of rain before hand.
Also,The last GFS builds a heat ridge later in week 2 in this same area.
What do I think?
We should note that models have been much too wet for 2 months for almost every weather system. However, the set up is potentially different this time. We have a powerful jet stream by June standards creating powerful dynamics. Places that get rains could have huge rains.
Powerful jet streams in June, almost always feature a strong dome/heat ridge to the south.
Where will the heat ridge be?
Somewhere in the south for sure.
Where will the heavy to excessive rains be?
Somewhere along the periphery of the heat ridge.
Here is the unreliable day 15 map from the 12Z GFS that shows the big heat ridge from the S.Plains to Ohio Valley southward.
_namer_372_200_wnd_ht gfs_namer_372_500_vort_ht
 gfs_namer_372_1000_500_thick
 gfs_namer_372_850_temp_ht
NWS extended added some heat in many places vs yesterday's big cool down.
However, there is TONS of rain.
In June, hot/wet is very bearish grains. This will push the crop to grow fast in its vegetative stage.
In July, heat can hurt pollination, especially a few days of intense heat at the wrong time.
In August, heat ALWAYS hurts corn yields, no matter how much rain falls.
We call it heat fill. Heat accelerates the corn plants maturity pace which means it has much less time to fill kernels before maturity is over. This does not mean kernels fill that much faster, it means that they just don't fill for as much time........and don't get as plump.
The market learned this lesson in the hot/wet Summer of 2010. Expectations were for near record yields from all the rain.
Come harvest time, many places had yield reports that were 20-30 bushels less than expected based on how much rain fell.
Here is what tricked them. Crop ratings remained very high thru the Summer of 2010. All that rain, caused the crop to stay nice and green and healthy looking on the outside...............while hidden inside the ears, those kernels were not getting filled up as much as what everyone assumed.
The crop matured real fast/early and the plants never had enough time to fill the kernels............heat fill.
Also, very warm/humid nights are tough on corn plants.
Here's another way to put it when being more specific about the type of heat.
If the heat is very dry heat and features low humidity and good cooling at night, the corn plant does not need to res pirate as much and can rest at night, saving the sugars/energy that it made during the day from photosynthesis and use it for kernel filling.
http://ocj.com/2016/08/warm-nights-could-be-hurting-corn-yields/
http://www.cpc.ncep.noaa.gov/products/predictions/610day/
Temperature Probability | |
Precipitation Probability | |
http://www.cpc.ncep.noaa.gov/products/predictions/814day/index.php
ArchivesAnalogsLines-Only FormatGIS Data | |
Temperature Probability | |
Precipitation Probability | |
Areas with excessive rain potential the next 3 days. Some of this is the same areas that are very dry right now.
Excessive Rainfall Forecasts
Current Day 1 Forecast Valid 15Z 06/07/18 - 12Z 06/08/18 |
Day 1 Threat Area in Text Format
| Day 2 and Day 3 Forecasts |
Current Day 2 Forecast Valid 12Z 06/08/18 - 12Z 06/09/18 |
Day 2 Threat Area in Text Format
Current Day 3 Forecast Valid 12Z 06/09/18 - 12Z 06/10/18 |
Here is a new map for you:

The models have all predicted way too much rain for the past 2 months. Maybe that will happen again here. The last GFS is going bonkers with a large band of 10+ inches of rain in the WCB.
Will that happen?
It actually could if the heat ridge shifts farther east(that looks possible) and we finally get strong return flow from the Gulf of Mexico that has been lacking because the heat ridge was farther west(S.Plains) sending up hot dry air, with a west component.
But what causes excessive rains is often stalled fronts/systems and strong jet streams. The set up we have in week 2 may feature that.
We will have a pretty powerful jet stream by June standards racing in out of the Pacific. The model at the bottom is a combination of the GFS and Canadian ensembles and is very consistent(not jumpy, as Larry aptly refers to operational models).
Note the 104 knot wind max(which is around 125 mph) in the jet stream just off the West Coast on June 19th. This is not near a record but is up there and the actual peak winds will probably be a bit higher than that.
As it crosses the US, it will cause something, likely to be at the extreme end to happen.
The stronger the jet stream, the more the potential lift for rising air masses. Strong jet streams are also associated with strong temperature contrasts. The effect depends on the large scale features that they are traversing into or around.
A strong jet dropping into an upper level trough will deepen and strengthen it, resulting in a surface relflection. This set up is more familiar to severe and extreme weather followers, especially in the cold/cooler months/Spring.
One that is just crossing around the periphery of an upper level heat ridge, moving mostly zonally, however can still cause massive rains without the deep low forming.
In June, there is much more heat and moisture available from air masses coming up from the south then in most other(cooler) months. If you combine that with a pattern that features a strong jet stream, a heat ridge in the south/southeast but is NOT progressive...........in other words the large scale features continue in a similar place for several days, then you have the recipe for very heavy rains to repeat in the same places.
So the GFS can't pinpoint 10 inches of rain in week 2 this far out, especially to the exact place. In fact, the jet stream could buckle vs being zonal which happens when its strong and we could have a different pattern with a heat ridge instead of heavy rains but that is looking less and less likely
However, the model is picking up on a potential excessive rain signal based on the features described above..............if they would happen like the model thinks.
Forecast Hour: 384
Image URL: http://mag.ncep.noaa.gov/data/gfs/18/namer/precip_ptot/gfs_namer_384_precip_ptot.gif

