Runs of 12Z Sun vs 12Z Fri in HDDs:
GEFS: ~ wash
EPS: ~` -9
Thanks much for getting us started Larry!
Gap lower open likely. Will this serve as an exhaustion gap at some point?
Seems pretty far down for a break away gap. If it turns colder this week.......EXHAUSTION gap!
Gap lower, pause then massive spike down that must have hit tons of sell stops and featured panic selling from longs crying uncle.
Grant,
Getting out last week cut your losses from what they would be right now.....smart move.
Some of the best trading decisions one makes end up being those that cut losses.
I tried to buy 2 on the spike down to 1.830 but missed it by a couple of ticks on the way up.
1.830 could serve as THE low for this move.............as an exhaustion.
For sure prices can't stay that low for very long, no matter how warm the weather forecast is.
All the sell stops from here down to 1.830 have been taken out but I suppose in this extremely volatile environment, it would not be inconceivable to press it below 1.830 because we now suspect there may be a ton of sell stops below that.
WOW!
The last time that the price of ng was this low in January was a very, very long time ago.
I'll try to find out.
From my historical price chart books going back to 1985, it looks like the February 1999 contact dropped down to 1.700 just before expiration towards the end of January 1999...........20 years ago.
So this was the lowest January print in 20 years!
That extremely mild, El Nino Winter, the NG-G99 contract was trading as high as 2.6 in early November.........then we went into record warm weather and it collapsed during the last 3 weeks of November 1998. It gapped lower at the end of November 1998 over a weekend from just below 2.2 to below 2.1. It bounced around between 2.1 and 1.8 until January, then collapsed during January 1999 to 1.7
This was not unheard of back then.
In January 1995, the Feb ng traded as low as 1.3 in the middle of February, which was the lowest January price that I could find.
This was before a stretch of around a decade that featured much, much higher prices because of supplies struggling to keep up with increasing demand........then fracking tapped into massive supplies a decade ago and prices have been suppressed ever since.
On the spike lower tonight, down to 1.830. This is not really a shock. I wish I was faster in my buy order earlier but this is uncharted territory in, what I was going to say is thin volume but an amazing, almost 20,000 contracts have been traded in the first 2 hours of a holiday weekend Sunday Night.
https://www.marketforum.com/forum/topic/45380/
By metmike - Jan. 16, 2020, 7 p.m.
"If suddenly the models turned sharply colder overnight (which looks unlikely) this would be the perfect place for a reversal higher from new contract lows.
I'm saying this for 2 reasons.
1. It would be a potential home run entry point for me buying with somewhat limited downside risk.
2. It identifies what needs to happen to quickly bail you out.
Prices are the lowest for this time of year since? Not sure but they are cheap.
At what point does the price get low enough so that even really warm weather can't push it lower because its so far below fair value?
The problem with basing a trade on that is that as we get lower, even well below fair value we could get into some short term panic selling by longs or maybe hedges put on earlier that result in a huge short term spike lower below $2 and below what anybody expected..........that puts in a selling exhaustion low at some impossible to predict price which we don't return to for a very, very long time.
This is the downside risk and if the weather forecasts keep getting warmer, there's not telling how low.
One might guess that we would have interested buyers from a value standpoint at $2 but it would be the opposite...........we crack $2 and we have longs under water, crying uncle and all getting out with a series of stops being hit below $2 which cause the price to spike way lower"
Selling tonights open would have been a good trade on the bet that we could see this selling exhaustion take out panic selling longs but there is a strong case now, that this event has already happened.
But now, at least for me, I am looking at this mainly as a potential buying set up with tremendous risk.
We assume that the sell stops between here is the lows will not be anything like they were on the trip down earlier, so much less fuel to see another spike like that one.
I am sure that we will not see many traders selling at 1.830 and to put on a new short they intend to keep with the expectation of lower prices. That would be an insane strategy.
It is possible, that cash prices could plunge lower than this if it stays very mild thru the rest of the month and this could cause the front month to be pulled in that direction as we approach expiration. That seems to be the only way we can get much below 1.830 and stay there for more than a spike lower.
If you are somebody extraordinarily knowledgeable about cash price dynamics with front month expirations, you could use that to exploit this (and other similar situations).
We should note that funds have massive shorts on right now. It would be well worth knowing how many of those need to be bought back in the February contract before expiration.
They certainly have massive profits and with over a week to cover, a mild forecast, abundant storage, collapsing lower price and technicals in the toilet....and negative seasonals, may be able to do it without it affecting the price that much.
It's always interesting when a commodity is at the lowest price in 2 decades(for a Winter month).
Whether 1.830 holds as THE low in this move or not, it's extremely likely that we are putting in a low in this current time frame that will last for many months.
Funds will absolutely not be piling on shorts down here to add to their long term position, intending to hold indefinitely. The risk/reward that was so much in their favor at much higher prices and main incentive has gone the other way below 2.0.
The price of natural gas in May for instance is VERY likely to be higher than this, regardless of the weather.
This would actually be the area to accumulate long term longs and for commercials to step in and do as much hedging (buying) as possible to lock in some of the cheapest prices they will get. That would likely be in some of the farther out contracts...........as the front month will not feature hedging future production or demand transactions.
So additional selling and buying the next 10 days will come from other sources. Looks like Feb expiration is Jan 29th, which is next Wednesday.
For sure the potential for some price fireworks leading up to that.
I would expect to see a rebound, temporarily, as the funds dump/roll over their positions. If they haven't already. OI between feb and mar made the shift last week. But I agree that they will have to dump their shorts pretty soon, which will bring on a buying frenzy. With a gap down opening, and a deep spike shortly after, I would look at going long for the rebound, temporarily. Trading ENGH. I agree that the price is now well below market value and is unsustainable. Might have to look into other comparisons, such as currency valuations, in order to legitimize it. And if sustained, the price could drop a little lower before it turns around.
My initial spread is currently in the negative. However, I am adding another spread between ENGK/N. Don't think I can go wrong in it. Some may wonder why I don't involve the June contract in a spread, and the reason is OI. For some reason, the OI in the june contract is almost always much lower than it's neighbors. And the question of "why?" has endured through the years. If anyone has a theory on that, I would be grateful to hear it. Because my decisions on spreads take OI into consideration.
Natural Gas Intelligence Tuesday Morning:
Natural Gas Futures Crash Through $2/MMBtu as ‘Just No Cold Air’ in Pattern
8:57 AM
After further milder trends in the forecasts, and with January shaping up to be historically warm, natural gas futures crashed through the $2/MMBtu barrier over the long holiday weekend. At around 8:30 a.m. ET Tuesday, the February Nymex contract was trading at $1.944, off 5.9 cents from Friday’s settle
Weather Tuesday(ng collapsing lower from no signs of cold). Lowest price in January since 1999!
Last 12z EE has much more northern stream coming down from cross polar flow, thu W.Canada, aimed towards the US..........at the end of the 2 week period.
This has given ng a big bounce off the lows.
This is too far out to consider reliable but if this trend continues, then the lows are in.
Some options maybe? Sit back and wait?
I closed my NGG0 position today for a small loss. Glad I repositioned last week or I would have been down a lot. I have puts on NGH0 and NGJ0 with a call in NGH0 as well. I feel much better about selling puts and calls and I will stil to that.
Thanks Grant.
Sometimes the best trading decisions(certainly the toughest) relate to cutting losses that would have ended up being much greater vs deciding when to take profits on a winner.
Covering a long ng position last week avoided a much bigger drawdown and likely bigger loss than one would be facing right now.
I'm thinking that the forecasts have been so extremely mild for so long, that a sharp change to colder would give us a low risk buying opportunity down here.
OK, never mind the low risk part. What could happen is that, even if we have colder maps, the market might still do a surprise spike lower to fake us out before surging higher for good.(early this pm, the spike lower with some models getting colder at the end of week 2 might have already been that happening and now we can go higher).
Low risk and natural gas trading don't go together (-:
Regardless, most of the models are suggesting a pattern change to colder at the end of 2 weeks.............when model skill is not very good.
Closing comments from NGI:
Weather, ‘As Bearish As It Can Get,’ Sends Natural Gas Prices Plummeting Further
5:28 PM
Buckling under the weight of a near-relentless run of warmer-than-normal temperatures in the peak of the winter heating season, natural gas prices -- both cash and futures -- plunged from coast to coast Tuesday. The February Nymex contract unequivocally broke below the $2/MMBtu barrier, dropping 10.8 cents to settle at $1.895. March settled at $1.889, down 9.6 cents on the day.
I like the trend towards the first week of Feb. The EURO ensembles 500mb wind flow would favor and intrusion of cold air. The EURO control has the jet buckling north into Alaska which would favor even colder air. The GFS is colder at the beginning of Feb than the EURO and based on the EURO control and mean 500mb wind flow I think colder would be likely. I am neutral to slightly long right now. Waiting patiently.
for week ending January 10, 2020 | Released: January 16, 2020 at 10:30 a.m. | Next Release: January 23, 2020
-109 Bullish!
| Working gas in underground storage, Lower 48 states Summary textCSVJSN | |||||||||||||||||||||||||
|---|---|---|---|---|---|---|---|---|---|---|---|---|---|---|---|---|---|---|---|---|---|---|---|---|---|
| Historical Comparisons | |||||||||||||||||||||||||
| Stocks billion cubic feet (Bcf) | Year ago (01/10/19) | 5-year average (2015-19) | |||||||||||||||||||||||
| Region | 01/10/20 | 01/03/20 | net change | implied flow | Bcf | % change | Bcf | % change | |||||||||||||||||
| East | 716 | 756 | -40 | -40 | 624 | 14.7 | 677 | 5.8 | |||||||||||||||||
| Midwest | 851 | 885 | -34 | -34 | 734 | 15.9 | 796 | 6.9 | |||||||||||||||||
| Mountain | 161 | 166 | -5 | -5 | 128 | 25.8 | 159 | 1.3 | |||||||||||||||||
| Pacific | 235 | 244 | -9 | -9 | 197 | 19.3 | 256 | -8.2 | |||||||||||||||||
| South Central | 1,076 | 1,097 | -21 | -21 | 862 | 24.8 | 1,002 | 7.4 | |||||||||||||||||
| Salt | 320 | 323 | -3 | -3 | 303 | 5.6 | 297 | 7.7 | |||||||||||||||||
| Nonsalt | 756 | 774 | -18 | -18 | 558 | 35.5 | 705 | 7.2 | |||||||||||||||||
| Total | 3,039 | 3,148 | -109 | -109 | 2,545 | 19.4 | 2,890 | 5.2 | |||||||||||||||||
Totals may not equal sum of components because of independent rounding. | |||||||||||||||||||||||||
Working gas in storage was 3,039 Bcf as of Friday, January 10, 2020, according to EIA estimates. This represents a net decrease of 109 Bcf from the previous week. Stocks were 494 Bcf higher than last year at this time and 149 Bcf above the five-year average of 2,890 Bcf. At 3,039 Bcf, total working gas is within the five-year historical range.
For information on sampling error in this report, see Estimated Measures of Sampling Variability table below.

Note: The shaded area indicates the range between the historical minimum and maximum values for the weekly series from 2015 through 2019. The dashed vertical lines indicate current and ye
https://www.investing.com/economic-calendar/natural-gas-storage-386
Latest Release Jan 16, 2020 Actual-109B Forecast-95B Previous-44B
U.S. Natural Gas Storage
| Release Date | Time | Actual | Forecast | Previous | |
|---|---|---|---|---|---|
| Jan 23, 2020 | 10:30 | -109B | |||
| Jan 16, 2020 | 10:30 | -109B | -95B | -44B | |
| Jan 09, 2020 | 10:30 | -44B | -53B | -58B | |
| Jan 03, 2020 | 10:30 | -58B | -57B | -161B | |
| Dec 27, 2019 | 10:30 | -161B | -148B | -107B | |
| Dec 19, 2019 | 10:30 | -107B | -90B | -73B |
7 day temperatures for that period above on last weeks report. VERY MILD.
7 Day temperatures, ending last Friday for this Thursdays report:
Cold Northern Plains/Rockies(where very few people live and use NG) with record to near record warmth in the Southeast to Northeast(where plenty of people live).
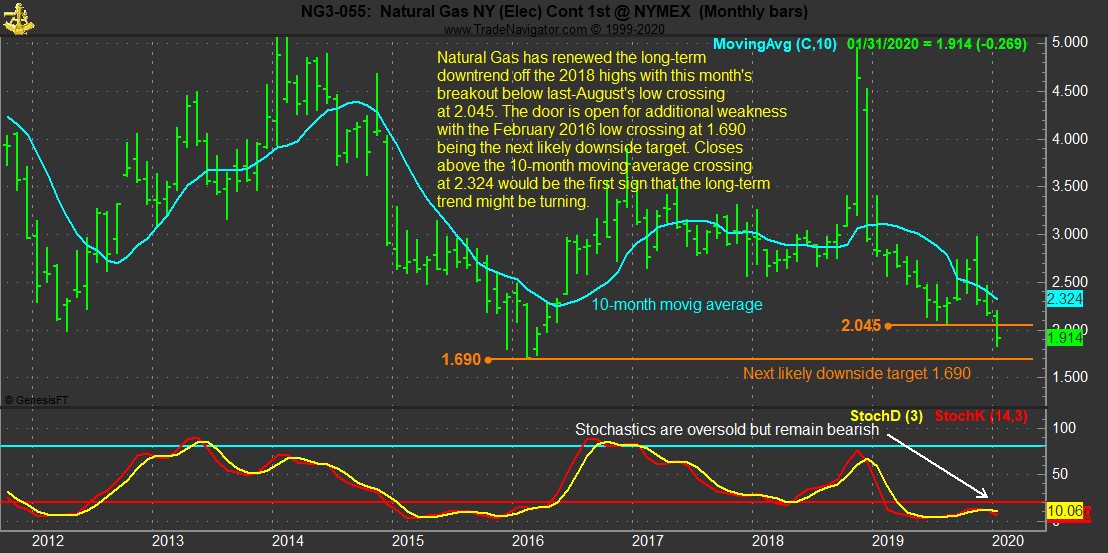
January 21: Seasonals are lower and getting tremendous help from mild weather with prices dropping to the lowest during January since 1999! If it turns much colder in early February and February is cold, the lows for the year should be in, with the seasonal bottom occurring just a bit earlier than usual(but it varies from year to year).
January 5th: Seasonals are lower now, until mid/late February, when they turn up with the strongest upward price movement seasonal signal of the years from then to mid June.
Dec. 25th:
Regarding seasonality, price strength often seen in early/mid Dec. fades in late December and seasonals are actually lower/weaker from late December thru mid February, when prices often start their very reliable seasonal increase in the Spring. Temperatures will matter more than these historical tendencies during January.
Dec. 16th:
I'm repeating my comments from last week below because they explain some of the recent strength in NG prices, despite the lack of bitter cold:
Dec. 9th:
The main thing about the seasonal graph below to know is that prices in late November ALWAYS go down when its mild and almost always go down with average temperatures.......this happened in 2019.
In early/mid December, however, seasonals turn positive, which is lending some support here(along with extremely low prices and lots of warm dialed in)
This seasonal price chart below is for 2 decades, ending back in 2009.
 Seasonal Chart")
The price chart below is for the front month February but its wrong.
We spiked to a high above 2.9 in mid September and record heat and record cooling demand for AC us in some key, high demand locations for that late/time of year, then again to just above 2.9 at the start of November on record cold and record heating demand in some key locations for so early in the heating season.
The last price is good and is the lowest price during the month of January for the front month of Natural Gas since 1999!!
I think it was down to 1.700 that month but back in the 1990's. prices below $2 were not that unusual. In January 1995, the price got as low as 1.300!
After 1999, we had a decade of prices averaging double to triple the 1990's for almost a decade from increasingdemand exceeding supplies and the need for much higher prices to inspire investment in the natural gas industry.
Then fracking hit the scene and massive supplies from all sorts of places outside of the GOM have kept a lid on prices, even during times with record demand from weather(with modest spikes compared to the past).
Speaking of supplies:
The previous week, at 119 was the lowest number since early December 2016, over 3 years ago.
https://ycharts.com/indicators/us_gas_rotary_rigs
120.00 for Wk of Jan 17 2020
| Data for this Date Range | |
|---|---|
| Jan. 10, 2020 | 119.00 |
| Jan. 3, 2020 | 123.00 |
| Dec. 27, 2019 | 125.00 |
| Dec. 20, 2019 | 125.00 |
| Dec. 13, 2019 | 129.00 |
| Dec. 6, 2019 | 133.00 |
| Nov. 27, 2019 | 131.00 |
| Nov. 22, 2019 | 129.00 |
| Nov. 15, 2019 | 129.00 |
| Nov. 8, 2019 | 130.00 |
| Nov. 1, 2019 | 130.00 |
| Oct. 25, 2019 | 133.00 |
| Oct. 18, 2019 | 137.00 |
| Oct. 11, 2019 | 143.00 |
| Oct. 4, 2019 | 144.00 |
| Sept. 27, 2019 | 146.00 |
| Sept. 20, 2019 | 148.00 |
| Sept. 13, 2019 | 153.00 |
| Sept. 6, 2019 | 160.00 |
| Aug. 30, 2019 | 162.00 |
| Aug. 23, 2019 | 162.00 |
| Aug. 16, 2019 | 165.00 |
| Aug. 9, 2019 | 169.00 |
| Aug. 2, 2019 | 171.00 |
| July 26, 2019 | 169.00 |
| July 19, 2019 | 174.00 |
| July 12, 2019 | 172.00 |
| July 3, 2019 | 174.00 |
| June 28, 2019 | 173.00 |
| June 21, 2019 | 177.00 |
| June 14, 2019 | 181.00 |
| June 7, 2019 | 186.00 |
| May 31, 2019 | 184.00 |
| May 24, 2019 | 186.00 |
| May 17, 2019 | 185.00 |
| May 10, 2019 | 183.00 |
| May 3, 2019 | 183.00 |
| April 26, 2019 | 186.00 |
| April 18, 2019 | 187.00 |
| April 12, 2019 | 189.00 |
| April 5, 2019 | 194.00 |
| March 29, 2019 | 190.00 |
| March 22, 2019 | 192.00 |
| March 15, 2019 | 193.00 |
| March 8, 2019 | 193.00 |
| March 1, 2019 | 195.00 |
| Feb. 22, 2019 | 194.00 |
| Feb. 15, 2019 | 194.00 |
| Feb. 8, 2019 | 195.00 |
| Feb. 1, 2019 | 198.00 |
![]()
for week ending January 17, 2020 | Released: January 23, 2020 at 10:30 a.m. | Next Release: January 30, 2020
-92 BCF Neutral?
Slight bounce on the release, into the gap(not filled) then down a bit. the first few minutes.
Much colder late week 2 forecasts today are more important.
| Working gas in underground storage, Lower 48 states Summary text CSV JSN | |||||||||||||||||||||||||
|---|---|---|---|---|---|---|---|---|---|---|---|---|---|---|---|---|---|---|---|---|---|---|---|---|---|
| Historical Comparisons | |||||||||||||||||||||||||
| Stocks billion cubic feet (Bcf) | Year ago (01/17/19) | 5-year average (2015-19) | |||||||||||||||||||||||
| Region | 01/17/20 | 01/10/20 | net change | implied flow | Bcf | % change | Bcf | % change | |||||||||||||||||
| East | 696 | 716 | -20 | -20 | 574 | 21.3 | 625 | 11.4 | |||||||||||||||||
| Midwest | 815 | 851 | -36 | -36 | 681 | 19.7 | 736 | 10.7 | |||||||||||||||||
| Mountain | 151 | 161 | -10 | -10 | 122 | 23.8 | 150 | 0.7 | |||||||||||||||||
| Pacific | 220 | 235 | -15 | -15 | 187 | 17.6 | 244 | -9.8 | |||||||||||||||||
| South Central | 1,065 | 1,076 | -11 | -11 | 828 | 28.6 | 940 | 13.3 | |||||||||||||||||
| Salt | 328 | 320 | 8 | 8 | 296 | 10.8 | 276 | 18.8 | |||||||||||||||||
| Nonsalt | 737 | 756 | -19 | -19 | 532 | 38.5 | 664 | 11.0 | |||||||||||||||||
| Total | 2,947 | 3,039 | -92 | -92 | 2,393 | 23.2 | 2,696 | 9.3 | |||||||||||||||||
Totals may not equal sum of components because of independent rounding. | |||||||||||||||||||||||||
Working gas in storage was 2,947 Bcf as of Friday, January 17, 2020, according to EIA estimates. This represents a net decrease of 92 Bcf from the previous week. Stocks were 554 Bcf higher than last year at this time and 251 Bcf above the five-year average of 2,696 Bcf. At 2,947 Bcf, total working gas is within the five-year historical range.
For information on sampling error in this report, see Estimated Measures of Sampling Variability table below.
Note: The shaded area indicates the range between the historical minimum and maximum values for the weekly series from 2015 through 2019. The dashed vertical lines indicate current and year-ago weekly periods.
Thursday weather: Most of the models are turning colder late week 2, with the Canadian, as usual the coldest by far and the first(been advertising this for days. However, the models, especially the Canadian have been too cold for the past month that the AO is forecast to remain positive which reduces the risk of major cold(instead, more like Pacific air masses mixed with Canadian air that is not that cold).
My forecast for late week 2 has been leaning cold this week but with skepticism.
Natural Gas Bulls Not Enthused by EIA Storage Data as Prices Pull Back
11:17 AM
The 12z GFS ensemble continues to look colder (on some runs, including this one) late in week 2. The market had a small bounce on that but has drifted down a bit.
The market usually gets good trading fuel from the EE that comes out after 1pm.......if it shows something much different.
My guess is that with mild near term weather, more than half of Winter over and massive gains in storage for numerous weeks vs previous years/averages, the market doesn't need to worry about the potential for colder, like it would if storage was low or if this was early Winter.
NGG expires early next week. Funds have had record shorts and maybe some covering of that still needs to be done in the front month?
Feb has been up much more than March, though the front month usually leads most moves.
Earlier this morning, than for a few seconds after the EIA report, ng traded at the highs and ate into the bottom of the gap lower from THIS LAST Sunday Night's open..........but could not fill it and in fact, this induced heavy selling pressure.
So the gap is still considered a downside break away gap until its filled.
I believe that it will be filled and thus, be considered an exhaustion(of the selling) gap especially if February turns colder.
Interesting that the Feb contract this morning got into the gap, but the much weaker March contract was not able to get up that high.
CFSv2 shows most of February very cold across the eastern half of the U.S. I know it is very experimental but it seems to like up with the Climate Prediction Center's monthly outlook.
Grant,
The extended maps have been showing this cold coming the past couple of days but they have been too cold over the last month, especially the Canadian model.
The front month of ng was up the most all day, maybe from funds covering shorts ahead of next Wednesdays expiration.
NG is going lower here after the 0z GFS ensemble was not that cold.
NGI after the close Thursday:
Small Rally for Front Month as Depressed Natural Gas Futures Market Waiting on Weather
5:20 PM
After recent heavy selling, signs of colder temperatures returning near the end of the 15-day outlook provided enough impetus for a modest natural gas futures rally Thursday; however, an on-target inventory report saw prices pull back a few cents. The February Nymex contract went on to settle 2.1 cents higher at $1.926/MMBtu after trading as high as $1.980. March settled at $1.904, up 0.4 cents.
With such conflicting reports in weather, and actual over abundace in storage, how can prices reflect otherwise?
EE and Canadian model incredibly milder at the end of week 2 is hitting ng price! Actually GfS ensemble was milder too.
With those mild solutions we could have new lows!
6z gfs ensemble actually colder than previous one.
Thanks very much tallpine. I had been thinking the lows were in at the 1.830 panic selling, spike low at the start of this week but if it stays warm in Feb instead of turning cold, we could drop even lower.
NGI Friday morning:
Natural Gas Futures Probing Lower Early as Market Parses ‘Model Chaos’
As mentioned overnight. Most models went much milder, all of them at 0z and we plunged, then the 6z GFS ensemble came back a bit colder again.
Regardless, the overall picture is MUCH milder for February based on a compilation of everything right now.
Interestingly, the AO has a few members being a bit negative today vs yesterday when, to me it made the biggest case of NOT getting frigid in February.
Regardless, we usually need a -AO to confidently increase risks of sustained cold in February............and its not been there for a month.
I really would not want to have any position over this weekend. Sunday Night, we could gap higher or lower, no matter where we close this afternoon.
There is a massive battle between how the models want to handle the northern stream vs the southern stream right now. There is officially no El Nino because temps are not quite warm enough in the tropical Pacific but the atmosphere is behaving like an El Nino driven atmosphere and the models are not catching on...........allowing too much northern stream influence and too much cold the past month(this is speculation for the reason by me)
The front month continues to be stronger much of the time, even on the down moves which may be the huge fund shorts still exiting before expiration next Wednesday.
The could be rolling over to March too.
I don't know this, just speculating.
Weather Friday........MUCHO MILDER!!!
Weather Saturday: Models not sure on February.........going back and forth:
Last, 12z run is colder.
Best. Winter. Ever
Is it just me or is the drought area expanding ever so slightly?
Jim. Climate change is not a static thing. Even in my own lifetime. In the 70's, there was the threat of the next ice age. But now there is the threat of massive drought and crop/forest erosion.
What's next?
"Is it just me or is the drought area expanding ever so slightly?"
It's just you. Soils are full of moisture. The market may be more concerned about it being too wet again this Spring, like last year vs drought.
Weather Sunday(colder yesterday/milder overnight) ; https://www.marketforum.com/forum/topic/46407/
@MarkB. I’m old Mark. I was in High School in the 70s. I remember getting over a week off from school in 76 I believe, due to what seemed like 2 feet of snow and bitter cold.
Mark,
Were you in high school in 1978?
What city did you live in at the time?
| Category 5 "Extreme" (RSI: 39.07) | |
 Surface map on the morning of January 26, 1978. Surface map on the morning of January 26, 1978. | |
| Type | Extratropical cyclone Nor'easter Blizzard Winter storm |
|---|---|
| Formed | January 24, 1978 |
| Dissipated | January 29, 1978 |
| Lowest pressure | 955.5 mb (28.22 inHg) |
| Maximum snowfall or ice accretion | 52 in (130 cm) Muskegon, Michigan |
| Damage | $73 Million |
| Casualties | At least 71 fatalities |
| Areas affected | Central United States, Eastern United States, Eastern Canada |
A couple of weeks later, a new blizzard hit farther east: Northeastern United States blizzard of 1978https://en.wikipedia.org/wiki/Northeastern_United_States_blizzard_of_1978 | |
I like it when Larry opens up the new natural gas thread on Sunday.
Hopefully, he's around.
Yesterday at this time, I would have thought a higher open.
After the milder overnight models, I would have guessed lower.
Now the 12z guidance has come in colder again.
Colder but not extending that colder at the end of 2 weeks into a new colder and colder pattern..........more of a colder shot just before then, followed by moderation.