Comparison of HDDs 12Z Sun vs 12Z Fri:
GEFS: 0
EPS +6
Comparison of HDDs 12Z Sun vs 0Z Fri:
GEFS: +8
EPS: +15
The most significant thing may be that for a change, these two models didn't trend warmer like they so often have due to cold bias, especially GEFS.
Thanks much Larry.
I noted that overnight, the 0z runs did turn milder, especially the European model but the 12z runs went back to colder.
However, the colder is from a shot of cold coming sooner in the week 2 forecast, then moderating vs previous solutions that showed the pattern getting gradually colder with time.......and the coldest maps being at the end of the period vs now, where the cold is moderating at the end of week 2.
It's certainly not ammo for a gap higher/lower open.
The front month, Feb expires on Wednesday and that ought to be good for some fireworks with prices at the lowest in 21 years for the month of January and storage having made massive gains over the past month(are there big shorts that need to cover Feb still?)
An approaching expiration spike can happen in either direction and it could go opposite the weather forecast on that day.
I'll guess that the open is higher but not a gap higher.
I note the bids/offers right now suggest higher for Feb but lower for Mar..........that will change as it always does in the last minute........ok, higher for both now.
We did open modestly higher, dropped a tad then went straight up with sustained hit the offer type bids...........taking out Fridays highs quickly but failing to quite test Thursdays highs which were below the gap lower from a week ago.
Pretty strong action early.
If models continue colder overnight, one can guess that the gap lower from a week ago will get filled and we can call that a selling exhaustion gap lower formation technically, which is what I have speculated it might end up being...........with a gap this far down at the end of a long drop lower and prices at 21 year January lows.
However, milder maps overnight will make it hard to make new highs and get above last weeks highs.
The 18z GFS Ensemble was colder yet and is bullish ammo.
Mike et al,
My take is that, regardless of the timing of when the models had the coldest air, the higher opening was expected because of a decent increase in HDDs on today's 12Z EPS vs the already colder 12Z Fri run vs 0Z Fri along with today's 12Z GEFS not being warmer vs the already colder Fri 12 run vs fri at 0Z when considering that it often has been trending warmer due to recent cold bias, especially vs a colder run. So, the comparison to 0Z Fri, a day when NG dropped several cents instead of rising, was even more bullish. It seems, based on how the market was still down on Fri even in the face of a colder GEFS and EPS at 12Z Fri vs 0Z Fri that a lot of folks were betting on either similarly bearish or warmer 2 week forecasts today vs Fri. However, the forecast I follow was colder days 1-10 by a decent amount largely based on models and about the same in the 11-13. It also mentioned more colder risks today in the 11-15. In addition, the 11-15 day map looks colder than it did on Fri because of progression. When combined with not only Fri's drop in the face of colder models and NG being so cheap, it is no surprise that it opened ~4 cents higher.
Then the 18Z GEFS came out a good bit colder (in week 2) as you said and that gave NG an extra boost to session highs even though the coldest of the run is on days 10-11, not at or near the end though it remained colder than normal through the end.
An expected large draw on this week's EIA probably doesn't hurt the bullish psychology although that should already be dialed in.
That's my take fwiw.
Outstanding analysis and not just because it lines up exactly with my thoughts.
Thank you.
So we are getting close to filling the gap lower from the open of a week ago.
It was not only a daily gap lower but a weekly gap lower.
Technically, having any gap like that means that market sentiment has shifted so strongly in one direction(for price expectations) that it completely jumps over or UNDER a band of prices between the previous days low(in this case) and the new days high.
The value of that commodity(or stock) has been repriced into a new range lower based on some powerful shift that quickly (over night or over a weekend) changed the mindsets of traders doing the pricing.
This big new change is often powerful enough so that its superimposed on the pricing structure and overwhelms everything else that existed before.
Something that powerful, usually sticks around for awhile and this is especially obvious when a gap like that marks a break away gap.............is followed by prices that continue in the direction of the gap(lower in this case).
As long as this imposing force continues to hang over the market, the price is unable to resist it/go against the heavy pressure that its imposing(warm temperatures in this case that have been reducing demand).
But sometimes, break away gaps or any gaps turn into exhaustion gaps. This happens, when the imposing, price pressuring force weakens and especially if it reverses.
Technically, when we see the price filling the gap and getting back into the higher price range above the gap(before the gap) the market is telling us that the overwhelming price pressuring force is no longer affecting traders mindset enough to cause them to think the value is at an entirely new lower level anymore.
We can always guess about what we think the strength of the force is or should be but the markets reaction around the gap tells us exactly what its affect is, in the only way that counts.........how its affecting the trading behavior of traders.
If they change their frame of mind and become willing to pay the higher prices that were in affect before the gap once again............which causes prices to rise thru the gap and completely fill the gap, then we know the pressure from the gap causing force is no longer great enough, in combination with other factors to keep the price down.
This has profound meaning because it means the previous aggressive selling and buyers drying up has exhausted itself. Often, this will have previously featured panic selling which peaks below gaps lower because of longs under water crying uncle.
Also, when this happens at very low prices, especially at the end of a long move lower, the price gets too low and below fair value. This attracts buying from those looking at value but also, you lose big selling speculators that realize the downside is limited compared to a few months earlier.
You've heard that the cure for low prices is..............low prices. Whether that is kicking in now or whether it will in a month, there is no way the price of natural gas will stay down here for very long. Supplies will start dropping off and EIA reports will start giving us bullish numbers because you can't make money in the ng industry with prices this low.
Or, we will have much colder weather in February increase demand which has the same affect from the other side of the equation...........to eat into a storage surplus and increase the value of natural gas based on what the market thinks.
Last Sunday night's gap lower, featured a HUGE spike MUCH lower for a couple of minutes down to 1.830 in the NGG, then came back to trade higher than that the rest of the week(but not fill the gap lower yet). This strongly suggested an extreme exhaustion in the selling that was already underway with the potential exhaustion gap lower.
That doesn't mean we still can't get lower than that but it would take even more extreme mild weather continuing in February.
Since its going the other way and we are approaching the bottom of the gap lower from 7 days ago, I am having fun discussing the psychology and technical formation/meaning of this yet to be filled gap.
On Wed/Wed Night last week, the models were looking pretty cold and the Feb Natural gas actually ate into the bottom of the gap(early Thu).(March did not make it that high). I think if they had continued even colder, we would have filled the gap and could officially call it an exhaustion gap.............but then the forecasts turned much milder again.
But now the models are quite a bit colder again and we are back up close to the bottom of the gap again.
This area to the bottom of the gap is some pretty strong resistence that will probably hold if models turn milder overnight.
If we get MUCH colder, than it would be shocking to NOT fill the gap.
But we can get MUCH colder, fill the gap then turn warmer again later this week and come back lower. There are no rules to tell us whats coming next unforunetely, other than......the market will likely respond in the direction of what the latest weather forecast change suggests for ng demand expectations.
And nobody knows what the models will be showing in 2 days, especially with the battle going on right now, which after a month of the updates often being milder(from models too cold) may have turned the tide as an earlier period in week 2 actually got colder vs it always being the last few days on the maps that got colder.........then, when they moved up in the forecast, turned warmer.
GFS ens came out pretty cold and gave us a tiny bounce that couldn't get close to the earlier highs and failed as the European model stuff has been coming out MUCH milder, like it did last night.
With the EE this warm thru 276 hours, no way will we be getting back close to the gap the rest of the night.............unless it turns sharply colder the last few maps and the GFS ens comes out shockingly colder in several hours.
The price has dropped close to the level of the open.
Weather Monday: European model has turned MUCH milder the last 2 runs!!!
https://www.marketforum.com/forum/topic/46470/
From Natural Gas Intelligence earlier:
Natural Gas Futures Called Higher as Forecasters Note Model Uncertainty
8:56 AM
NGI after the close Monday:
Natural Gas Futures Bounce as Bulls Hope Latest Weather Forecast Not ‘False Alarm’
5:11 PM
Natural gas futures staged a modest recovery Monday as long-range weather outlooks once again hinted at cold returning. With model volatility picking up in recent runs, however, the February gas futures contract climbed just 0.09 cents to $1.092. March climbed eight-tenths of a cent to $1.878.
metmike: The cold was peaking in forecasts on Sunday Evening, so the price spike higher. Overnight, the 0z EE turned much milder, then early this afternoon, it was abit milder yet.
NGG, the front month expires on Wednesday so just 2 trading days left. A huge spike higher or lower is always a much higher risk in a situation like this.
I got out of my positions during that spike for a small gain. Not enough to cover the loss last week but it helped a lot. I just don't like the overall trend of models flip flopping so much from cold to warm. The NAO and AO are are hinting going negative around the 4th of Feb but will they? If the models trend warmer again and it drops closer to 1.700 I may get back in or if there is a significant trend change. I would short it but in my mind it's too low. So am sitting out until there is a better signal.
Thanks Grant.
Also, the front month Feb expires on Wednesday so the next 2 days have alot of extra risk.
This split flow between the northern stream and southern stream is not being handled consistently by the models.
Good for traders that jump in and out based on model changes if you can get the timing just right..........potentially bad for other trades that want to have confidence in the the upcoming weather pattern to use for a good position.
I got clobbered bad last Wednesday, when I got convinced the models getting colder were on to something and the market was ready to take off.
I was loading up near the highs in the morning before some of the guidance came out, thinking it would come out colder and I didn't want to wait to pay up even more.
Then it came out milder and I ended up getting out with a massive loss.
Then, the 12z EE came out much colder and I got back in to recoup a portion of the loss but my confidence was so messed up that I put in a stop too close and got taken out before ng really shot up overnight.
In this environment, waiting to see whats on the latest model is the best idea for this kind of trading.........which is what I did very early this morning when the EE came out much milder for a small profit today.
The biggest problem in doing this is trying to get in before the market has done most of its knee jerk reacting to a particular model. There are clearly some people that have guidance that comes in a couple of minutes faster than the service that I pay alot of money for.
The market reaction tell me this for sure.
So the risk, is that you are looking at maps that they traded 2 minutes ago and knocked the price down on and though it may have more downside(warmer maps) you are selling at a lower to even much lower price than the ideal price(exactly when they sold before the news was out there).
If the maps turn colder in the later portion of the forecast after you sold and others have the colder maps before you, then a surge of new buying can take the price above your level before you see the colder maps.
NGI Tuesday Morning: Natural Gas Futures Called Slightly Higher as Overnight Data Mixed
metmike: EE came in a bit colder overnight.
Tuesday weather: https://www.marketforum.com/forum/topic/46523/
*Colder European model overnight-higher early.
*Milder 12z GFS Ensemble-brief spike down around 11am.
*NGG expires Wednesday..........potential volatility.
Both the 12Z GEFS and EPS lost ~12 HDD vs their respective 0Z runs. NG did come back down some but it held up pretty well considering this rather significant warming. My guess as to the reasons for holding up pretty well: combo of NG still being relatively cheap, expiration tomorrow with so many spec shorts, an expected large EIA draw this week (possible slight psychological factor), and maybe also because the very end of the EPS was the coldest of that run and actually colder than 0Z after almost the entire run was warmer vs 0Z (I think that tempered the drop that was occurring near and just after pit close as it then bounced back decently).
Larry,
I noticed the exact same thing with the 12z EE. As the much milder maps came out, we sold off. Then the last several maps came out pretty cold and we came back.
I suppose that considering the 12z ensembles were so much milder, finishing higher is a victory for the bulls.
However, it's not like we don't have the lowest January price in 21 years, funds are already short and there is still the threat of colder weather in February. .............at a time of year that is getting close to when a seasonal bottom is put in.
If Feb turned out record warm, I could see the price getting down to something like 1.7 or lower briefly......maybe but no way would it stay down there for long with very strong seasons from March-May.
A forecast change to milder from 12z models, like todays back in November or even December (at those prices) would have resulted in more downside...... don't you think?
It looks to me like the models are trying to revert back to the pattern that we had a month ago.......with more ridging in the Southeast and the frigid weather, with cross polar flow hitting Alaska and coming down thru Western Canada into the US.
I have no idea if thats what will happen as the week 2 forecast is up for grabs.
Mike,
I think so, too.
I know you're undecided, but do you think the southeast ridge will go back to dominating in early Feb like the recent models have been showing? Also, do you have any thoughts about mid to late Feb in the E US? My educated guess is that a cold dominated 2-3 weeks will appear there for the first time this winter within 2/20-3/20 based on analogs/history. We'll see if the major indices look to be changing to favorable for cold in the week 2 forecast starting with the runs near 2/10. I follow the PNA, AO, NAO, and MJO on a regular basis among others. None look favorable right now as you know. Bur they're not in the commode like they were in mid January, either.
Thanks Larry,
The thing that looks most likely in week 2 is a cross polar flow feeding frigid air into Canada. This means that a frigid air mass, of Siberian origin will not have far to travel to affect the US, especially areas closest to the Canadian border(with upper level ridging and warmth becoming more likely in the Southeast).
So the risk of much colder than average is almost as great as for colder than average, if that makes sense.
When Canada is mild, even if a we get a strong push behind a cold front, temps will still just be below average because the source region of the air is not cold enough for much below.
In week 2, even without a strong push deeply into the US, the Siberian air mass will be cold enough to drop temperatures much below normal along the northern tier.
But if you really want some nationwide bullish, elevated HDD"S that cause big drawdowns, we need better penetration of the cold into the East and South where alot of people live. It the upper level ridge there is tenacious and impedes the ability of the frigid air to spread southeast, then it will lessen the full impact of any frigid air masses pushing southeast.
Exactly like you said too. When the AO is positive, the sustained push of cold from high to mid latitudes does not have favorable dynamics that can last very long. A brief surge from an impulse/wave that tugs down the southern edge of a blob of cold will happene but it will be destined to recede.....or at lose the push and moderate greatly when the AO stays solidly positive.
The NAO also needs to be negative to keep the cold coming south in the East.
I have not been monitoring the MJO this Winter. It would be great if you have insight on the latest there to share with us.
Speaking of which, I am going to add the latest discussions on the MJO, ENSO, AO and Polar Vortex at the end of the weather page in a few minutes and the CFS weeks 3-4 forecast from yesterday?
After viewing all this stuff, I would say that the risk of major cold in the NorthCentral US for week 3 is quite elevated right now. .............but to REALLY be bullish, it needs to plunge deeply into the Southeast, which looks unlikely because of the building upper level ridge there.
So I added a bunch of new products at the end of the Tuesday Weather page and based on everything, will predict a very cold NorthCentral US for week 3(Minneapolis and, Chicagofor instance) but the cold struggles to penetrate deeply into the Southeast.
Be on your toes if you are trading NG. Expiration on the day before the report, can be very conflicting. The funds have made their shift. Even with conflicting weather prognostications in week 2, supply says we are very well prepared. I can only see a continuation of the range that has been set forth. At least for the short term.
Thanks Mark!
Volume in the expiring Feb was less than 10% of the March(5,000 vs 60,000) and now dropped down to a fraction.
It's possible some big, last minute orders could spike it with such low volume now.
metmike: All the models were milder overnight.
From NGI early:
Another Large Warmer Shift’ From Models Sends Natural Gas Futures Lower Early
8:48 AM
A large drop in heating demand expectations overnight kept the pressure on an already-depressed natural gas futures market in early trading Wednesday. The expiring February Nymex contract was trading 3.0 cents lower at $1.904/MMBtu at around 8:30 a.m. ET. March was trading 1.9 cents lower at $1.889.
Last Thursdays report:
![]()
for week ending January 17, 2020 | Released: January 23, 2020 at 10:30 a.m. | Next Release: January 30, 2020
-92 BCF Neutral? vs market expectations(bearish by Janurary standards.
Slight bounce on the release, into the gap(not filled) then down a bit. the first few minutes.
| Working gas in underground storage, Lower 48 states Summary textCSVJSN | |||||||||||||||||||||||||
|---|---|---|---|---|---|---|---|---|---|---|---|---|---|---|---|---|---|---|---|---|---|---|---|---|---|
| Historical Comparisons | |||||||||||||||||||||||||
| Stocks billion cubic feet (Bcf) | Year ago (01/17/19) | 5-year average (2015-19) | |||||||||||||||||||||||
| Region | 01/17/20 | 01/10/20 | net change | implied flow | Bcf | % change | Bcf | % change | |||||||||||||||||
| East | 696 | 716 | -20 | -20 | 574 | 21.3 | 625 | 11.4 | |||||||||||||||||
| Midwest | 815 | 851 | -36 | -36 | 681 | 19.7 | 736 | 10.7 | |||||||||||||||||
| Mountain | 151 | 161 | -10 | -10 | 122 | 23.8 | 150 | 0.7 | |||||||||||||||||
| Pacific | 220 | 235 | -15 | -15 | 187 | 17.6 | 244 | -9.8 | |||||||||||||||||
| South Central | 1,065 | 1,076 | -11 | -11 | 828 | 28.6 | 940 | 13.3 | |||||||||||||||||
| Salt | 328 | 320 | 8 | 8 | 296 | 10.8 | 276 | 18.8 | |||||||||||||||||
| Nonsalt | 737 | 756 | -19 | -19 | 532 | 38.5 | 664 | 11.0 | |||||||||||||||||
| Total | 2,947 | 3,039 | -92 | -92 | 2,393 | 23.2 | 2,696 | 9.3 | |||||||||||||||||
Totals may not equal sum of components because of independent rounding. | |||||||||||||||||||||||||
Working gas in storage was 2,947 Bcf as of Friday, January 17, 2020, according to EIA estimates. This represents a net decrease of 92 Bcf from the previous week. Stocks were 554 Bcf higher than last year at this time and 251 Bcf above the five-year average of 2,696 Bcf. At 2,947 Bcf, total working gas is within the five-year historical range.
For information on sampling error in this report, see Estimated Measures of Sampling Variability table below.

Note: The shaded area indicates the range between the historical minimum and maximum values for the weekly series from 2015 through 2019. The dashed vertical lines indicate current and year-ago weekly periods.
7 Day temperatures, ending the previous Friday for that report:
Cold Northern Plains/Rockies(where very few people live and use NG) with record to near record warmth in the Southeast to Northeast(where plenty of people live).
Temps ending last Friday for this Thursdays report. Not as mild, so a decent triple digit drawdown closer to the 5 year average?
Storage is in great shape for this time of year.
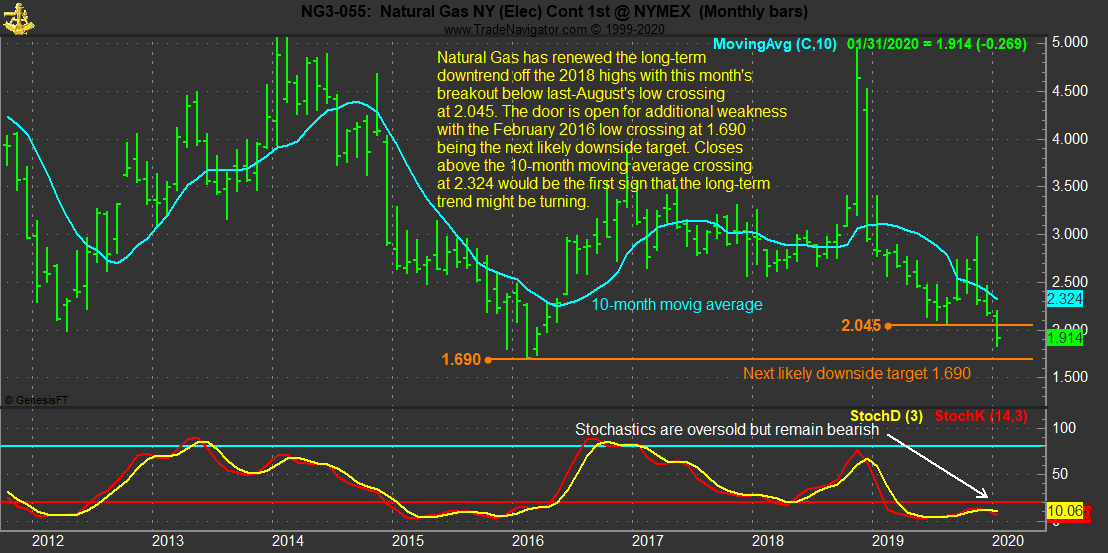
January 28: The lower seasonals are running out of time. We are in a time frame where a seasonal, even yearly significant bottom is often made........followed by several months of strong price action. The bottoms somtimes dont occur until the end of Feb but usually are before that. Each year is different.
January 21: Seasonals are lower and getting tremendous help from mild weather with prices dropping to the lowest during January since 1999! If it turns much colder in early February and February is cold, the lows for the year should be in, with the seasonal bottom occurring just a bit earlier than usual(but it varies from year to year).
January 5th: Seasonals are lower now, until mid/late February, when they turn up with the strongest upward price movement seasonal signal of the years from then to mid June.
Dec. 25th:
Regarding seasonality, price strength often seen in early/mid Dec. fades in late December and seasonals are actually lower/weaker from late December thru mid February, when prices often start their very reliable seasonal increase in the Spring. Temperatures will matter more than these historical tendencies during January.
Dec. 16th:
I'm repeating my comments from last week below because they explain some of the recent strength in NG prices, despite the lack of bitter cold:
Dec. 9th:
The main thing about the seasonal graph below to know is that prices in late November ALWAYS go down when its mild and almost always go down with average temperatures.......this happened in 2019.
In early/mid December, however, seasonals turn positive, which is lending some support here(along with extremely low prices and lots of warm dialed in)
This seasonal price chart below is for 2 decades, ending back in 2009.
 Seasonal Chart")
https://ycharts.com/indicators/us_gas_rotary_rigs
115.00 for Wk of Jan 24 2020
| Data for this Date Range |
| ||||||
|---|---|---|---|---|---|---|---|
| Jan. 10, 2020 | 119.00 | ||||||
| Jan. 3, 2020 | 123.00 | ||||||
| Dec. 27, 2019 | 125.00 | ||||||
| Dec. 20, 2019 | 125.00 | ||||||
| Dec. 13, 2019 | 129.00 | ||||||
| Dec. 6, 2019 | 133.00 | ||||||
| Nov. 27, 2019 | 131.00 | ||||||
| Nov. 22, 2019 | 129.00 | ||||||
| Nov. 15, 2019 | 129.00 | ||||||
| Nov. 8, 2019 | 130.00 | ||||||
| Nov. 1, 2019 | 130.00 | ||||||
| Oct. 25, 2019 | 133.00 | ||||||
| Oct. 18, 2019 | 137.00 | ||||||
| Oct. 11, 2019 | 143.00 | ||||||
| Oct. 4, 2019 | 144.00 | ||||||
| Sept. 27, 2019 | 146.00 | ||||||
| Sept. 20, 2019 | 148.00 | ||||||
| Sept. 13, 2019 | 153.00 | ||||||
| Sept. 6, 2019 | 160.00 | ||||||
| Aug. 30, 2019 | 162.00 | ||||||
| Aug. 23, 2019 | 162.00 | ||||||
| Aug. 16, 2019 | 165.00 | ||||||
| Aug. 9, 2019 | 169.00 | ||||||
| Aug. 2, 2019 | 171.00 | ||||||
| July 26, 2019 | 169.00 |
| July 19, 2019 | 174.00 |
| July 12, 2019 | 172.00 |
| July 3, 2019 | 174.00 |
| June 28, 2019 | 173.00 |
| June 21, 2019 | 177.00 |
| June 14, 2019 | 181.00 |
| June 7, 2019 | 186.00 |
| May 31, 2019 | 184.00 |
| May 24, 2019 | 186.00 |
| May 17, 2019 | 185.00 |
| May 10, 2019 | 183.00 |
| May 3, 2019 | 183.00 |
| April 26, 2019 | 186.00 |
| April 18, 2019 | 187.00 |
| April 12, 2019 | 189.00 |
| April 5, 2019 | 194.00 |
| March 29, 2019 | 190.00 |
| March 22, 2019 | 192.00 |
| March 15, 2019 | 193.00 |
| March 8, 2019 | 193.00 |
| March 1, 2019 | 195.00 |
| Feb. 22, 2019 | 194.00 |
| Feb. 15, 2019 | 194.00 |
| Feb. 8, 2019 | 195.00 |
| Feb. 1, 2019 | 198.00 |
NGI after the close Wednesday:
February Natural Gas Sells Off Into Expiry as Warmth Dominates Weather Outlook
metmike: Much warmer models late Tue and Tuesday Night pressured ng most of the day Wednesday. The NWS extended maps showed these changes ........much warmer in the East/Southeast.....I agree with that based on the 0z models.
The 12z models, however came out colder. After the weak expiration, a colder EE gave ng a bid for a bounce before the 4pm close.
The 18z GFS stuff also came out colder(especially late week 2-ensemble) than Tue/Tue Night models. The jumpy GFS operational model at 18z was extreme with the cold.
I am actually wondering here if modestly colder might fail to inspire the bulls as much as expected with storage so high in the 2nd half of WInter?
Not saying that it won't but just trying to look for unexpected reactions..........if the forecast turns colder and the market decides to ignore it.
The gap lower is still between 1.977 and 1.963 on the March contract, which is now the front month. That's almost $1,000 higher. The Contract low set right after that gap lower opening from panic selling and stops being hit was 1.826.
Considering that we are at 1.879 right now, new contract lows could easily be set if the forecast stays mild. This is the lowest price in January since 1999.
Speaking of the forecast, The temp gradient between bone chilling cold coming down thru W. Canada, compliments of cross polar flow feeding across the Arctic into Alaska/W.Canada and very mild temps in the Southeast from a ridge building will be enormous.
So a shift in the features and boundary between the air masses will make a massive difference to temp forecasts.
Mike,
My take is that the increase in HDD over the GEFS full runs has been too negligible to get much of a rise. But it still did rise 1.5 cents between 10:45 and 11:45 due I assume mainly to the colder 12Z GEFS. Then the 12Z Euro suite came out at about the same HDDs as their prior run. So there was not much reason to rise on those. And then the 18Z GEFS had about the same HDDs as 12Z. The crazy cold 18Z GFS was largely ignored because it came out at the quiet time of 18Z and the market trusts the extended gfs very little or not at all.
Agree with all of that Larry!
And that outlier cold 18z operational GFS became an outlier warm 0z GFS!
Models overnight turned warmer(GFS ens) to much warmer (Euro) but the Canadian model was actually colder.
With the AO going very strongly positive, at least the forecast and models being too cold forever, the warmer forecasts make more sense right now.
But how much lower can NG go down here????
A warm FEB will cause a glut/over supply in NG as we head towards the injection season in the Spring but prices almost always have a seasonal bottom around late Winter.
NGI early Thursday:
Euro Model Drops Cold as Natural Gas Futures Called Lower; EIA Pull Seen Near 200 Bcf
for week ending January 24, 2020 | Released: January 30, 2020 at 10:30 a.m. | Next Release: February 6, 2020
-201 BCF.
Wow, that's pretty big but the market expected it.
| Working gas in underground storage, Lower 48 states Summary text CSV JSN | |||||||||||||||||||||||||
|---|---|---|---|---|---|---|---|---|---|---|---|---|---|---|---|---|---|---|---|---|---|---|---|---|---|
| Historical Comparisons | |||||||||||||||||||||||||
| Stocks billion cubic feet (Bcf) | Year ago (01/24/19) | 5-year average (2015-19) | |||||||||||||||||||||||
| Region | 01/24/20 | 01/17/20 | net change | implied flow | Bcf | % change | Bcf | % change | |||||||||||||||||
| East | 638 | 696 | -58 | -58 | 533 | 19.7 | 583 | 9.4 | |||||||||||||||||
| Midwest | 761 | 815 | -54 | -54 | 616 | 23.5 | 687 | 10.8 | |||||||||||||||||
| Mountain | 143 | 151 | -8 | -8 | 115 | 24.3 | 144 | -0.7 | |||||||||||||||||
| Pacific | 210 | 220 | -10 | -10 | 179 | 17.3 | 235 | -10.6 | |||||||||||||||||
| South Central | 995 | 1,065 | -70 | -70 | 778 | 27.9 | 904 | 10.1 | |||||||||||||||||
| Salt | 297 | 328 | -31 | -31 | 280 | 6.1 | 270 | 10.0 | |||||||||||||||||
| Nonsalt | 698 | 737 | -39 | -39 | 498 | 40.2 | 634 | 10.1 | |||||||||||||||||
| Total | 2,746 | 2,947 | -201 | -201 | 2,222 | 23.6 | 2,553 | 7.6 | |||||||||||||||||
Totals may not equal sum of components because of independent rounding. | |||||||||||||||||||||||||
Working gas in storage was 2,746 Bcf as of Friday, January 24, 2020, according to EIA estimates. This represents a net decrease of 201 Bcf from the previous week. Stocks were 524 Bcf higher than last year at this time and 193 Bcf above the five-year average of 2,553 Bcf. At 2,746 Bcf, total working gas is within the five-year historical range.
For information on sampling error in this report, see Estimated Measures of Sampling Variability table below.
Note: The shaded area indicates the range between the historical minimum and maximum values for the weekly series from 2015 through 2019. The dashed vertical lines indicate current and year-ago weekly periods.
NGI:
EIA Storage Pull Exceeds 200 Bcf, but Natural Gas Futures Slide
Weather forecasts are just too warm.
NGH is setting life of contract lows today, 1.815 the lowest so far.
Will this hold?
At some point, prices will no longer able to go lower,even with the most bearish weather forecast.
When an extremely bearish market, that has been dropping for many months is no longer able to react to very bearish news..............the lows are probably in.
Today, so far is not that day...........unless we would reverse and close much higher than this, suggesting that we have run out of sellers at a price this low.
European model run is awaiting.
Thursday Weather:
Teleconnections still point to an above average temperature pattern eastern U.S. The Pacific/North American Pattern (PNA) turns negative which typically send bellow average temperatures in to the upper Plains and Western U.S, which both the EURO and GFS Ensemble show. The 12Z GEFS seems way too cold in the eastern U.S. based on the AO NAO being so positive. Interesting point about how low NG can go. If more rigs go off line I would think the price would head up again. Looking at the Commitment of Traders, there looks to be a lot of money managers short NG so if it does start going up I would think there is a short squeeze possible. I am staying out until the trend is more bullish and I don't have the guts to sell short this low.
I agree and made all those points too in the weather thread.
Almost a +++AO with the +NAO and -PNA is the recipe for mild weather in the East and any cold intrusions to be short lived, with sustained air flow from high to mid latitudes not favorable when those indices are like that.
So how much lower can we go at this price?
I have no idea.
If we stopped going lower, even with forecasts getting milder right here and this was the low......it would not surprise me.
If we had another wave of selling that took us down to 1.7 or lower(because of such mild weather).......it would not surprise me either.
This is probably an area that people in the actual business could predict better than me. They might have a handle on how long the market will tolerate prices this low before it shuts down so much production(with the market seeing that months ahead of time) that the cure for low prices kicks in ..............the actual occurrence of low prices.
It looks like even June ng has slipped a couple of ticks below $2 as of right now.........new lows life of contract lows for all the contracts of every month probably all the way out with this move.
For June of 2021 its 2.230 the last price.
For June of 2023 it looks like 2.295.
It seems like prices that low would not turn a profit and those in the business that make profits selling their supplies would change that, while big end users/commercials see this as incredible value and would be locking in/hedging as much as they can to assure their needs are covered for a very long time.
Those dynamics, a weather trader cannot identify with a precise nature that could know enough to tell us when low becomes too low for the market, no matter how bearish the weather.
EIA’s 200 Bcf-Plus Pull Can’t Rescue Sagging Natural Gas Futures
5:40 PM
A sizable storage withdrawal reported by the Energy Information Administration (EIA) Thursday couldn’t rescue a floundering natural gas futures market from the maw of persistently underwhelming winter weather. The March Nymex contract slipped 3.6 cents to settle at $1.829/MMBtu; April settled at $1.872, down 3.7 cents
The GFS ensembles were warmer again...which is no surprise with the +++AO, +NAO and -PNA regime.
When you superimpose those values of the indices on the pattern that the model solutions give us, you can almost assume there's a good chance they will be too cold......and updates warm things up as they get closer to reality.
Don't you agree?
And the amount of being too cold with solutions, then always turning warmer to much warmer over the last month seems almost unprecedented based on just my memory.
I might guess that the near El Nino conditions in the Tropical Pacific are not being handled well and for some reason, they keep seeing the northern stream as much too strong and far south than it should be.
The Canadian model has been the worst by a mile. if its day 14 forecast had verified all Winter, temperatures would have been below to much below average for much of the Central part of the country most of the time.
Why is this happening do you think?
Not sure if the GFS update had any thing to do with this. As far as I know there was not a recent update to the EURO and it continues to do it as well, but not as much as the GFS in my mind. As you said the Canadian has been cold week two all winter. All I can think of is there is bad data input somewhere that is throwing off the week two and beyond forecast. The 12Z GEFS really made no sense. Well below average temperatures for most of the country with the AO and NAO being so positive. The 12Z EPS makes much more sense with above average temps across the eastern 1/3 of the U.S.
The continuous flip flopping is why I am staying out now. I really feel this is a great buying set up with it being so low however, it keeps dropping. I'll sit back and try to learn from what happens.
NGI Friday Morning:
Balances Tight as Natural Gas Futures Slightly Higher Early; Forecasts Little Changed
8:59 AM
With only minor adjustments to the latest weather outlook, and with analysts pointing to tightness in the underlying supply/demand balance, natural gas futures managed to claw back a penny or so in early trading Friday. The March Nymex contract was up 1.7 cents to $1.846/MMBtu at around 8:45 a.m. ET.
Commodity trading is a complex of historical standards, chart indications, current fundamental influences, phsychological understanding, and gut instinct. This couldn't be truer than what we are experiencing in NG right now.
Climate change is a given. Even if it is somewhat stagnant for a time. It never really stops. And we have to constantly adjust. Even with the drop in producing rig count, which is bullish, it's not enough. Production still outweighs demand, due to a warmer winter climate. Mixed thoughts with traders. Nothing new. But most aren't convinced of a bullish outlook. When that changes, so will the trend.