Happy day to be alive! Keep giving thanks to be living in the best time of human history!
Scroll down and enjoy the latest comprehensive weather to the max...... occurring because of the natural physical laws in our atmosphere as life on this greening planet continues to enjoy the best weather/climate in at least 1,000 years(the last time that it was this warm) with the added bonus of extra beneficial CO2.
Will February turn colder? I'm on the fence. The mild pattern is tenacious and acting like we have an El Nino( with the tropical Pacific on the warm side of neutral and not quite El Nino right now) but the models keep insisting it will turn colder.
For sure it will turn "colder" but how cold is that.
We need a -AO in the forecast to have confidence of sustained Feb. cold but its not there now.
Models going back and forth on the amount of cold. They were all pretty cold on Sunday with ng up sharply but the European model turned much milder overnight............with ng prices coming back down on Monday. This same model was colder overnight Monday which has ng prices to go higher on Tuesday.
Then the models all turned warmer Tuesday Night and pushed ng lower.
The 12 GFS ensemble late morning is now a bit colder again.
NEW: Reasons to be thankful here in 2020!
https://www.marketforum.com/forum/topic/45623/
Winter Weather Forecasts
Sorry about not updating the previous snow headlines the last couple of days.
https://www.wpc.ncep.noaa.gov/wwd/winter_wx.shtml
Snowfall the next 7 days below.
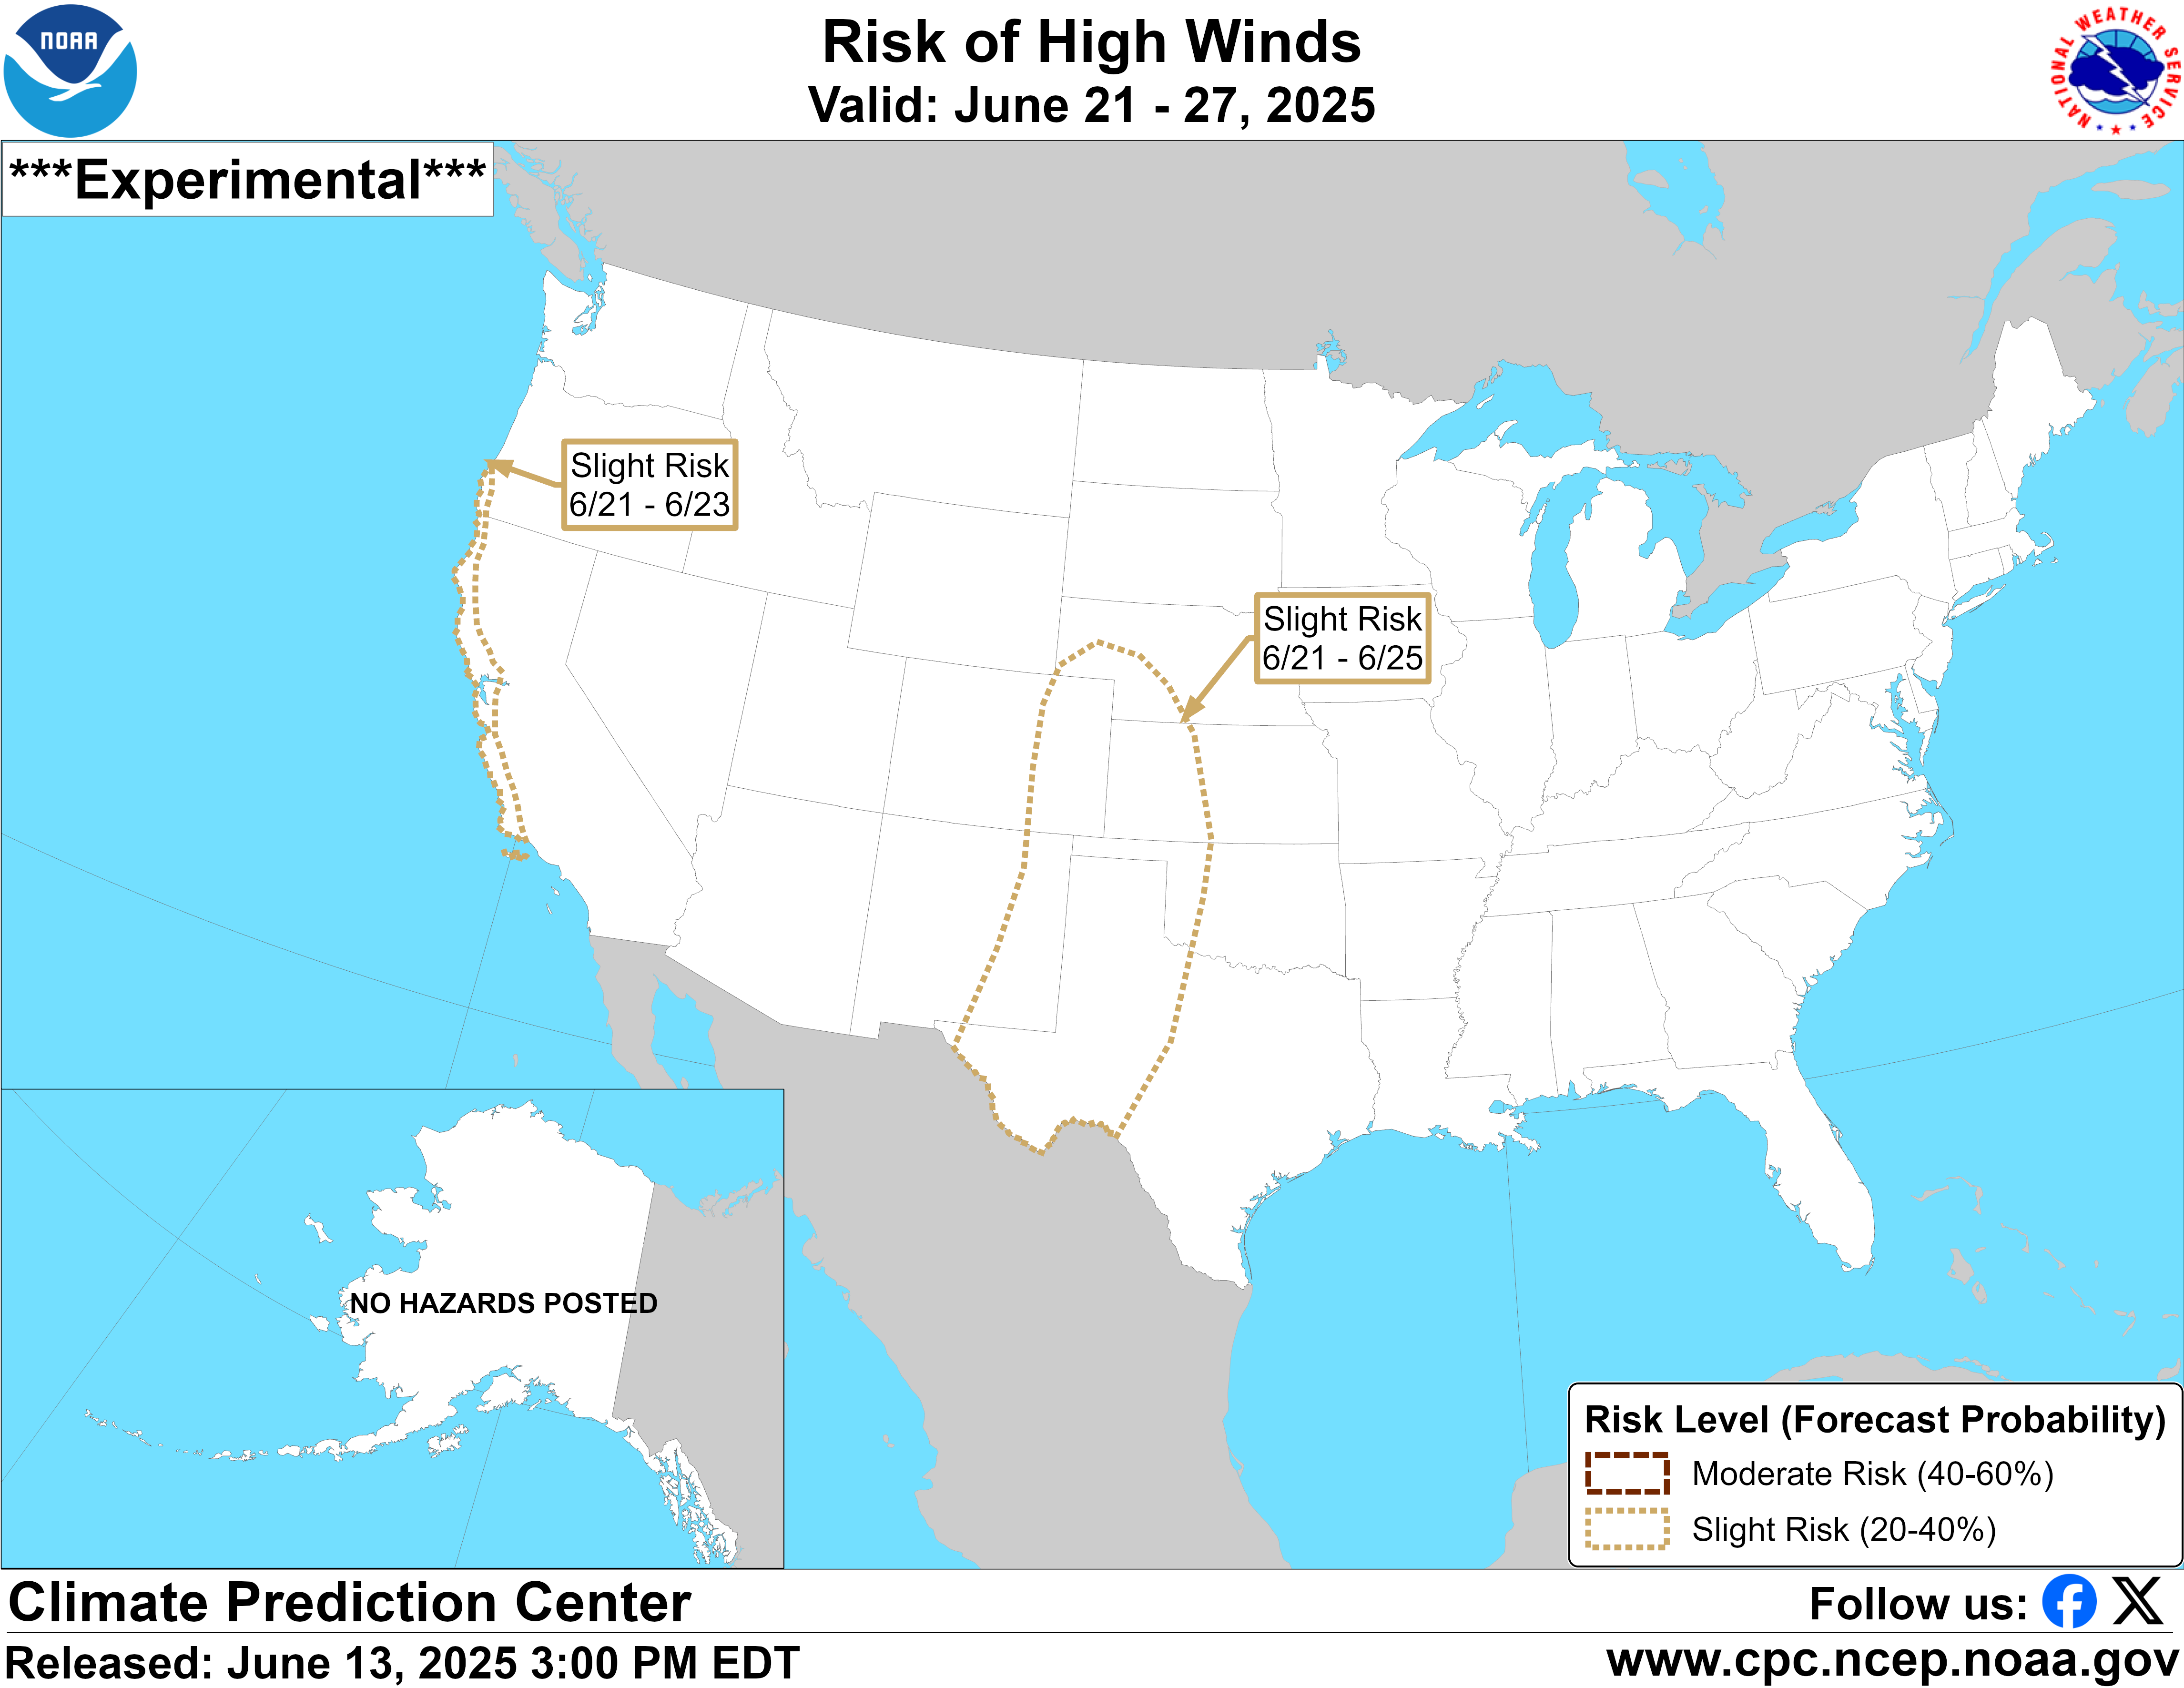
Here are the latest hazards across the country.
 |
Purple/Pink/blue on land is cold/Winter weather. Brown is wind, Green is flooding. Gray is fog. Reddish is a red flag advisory.
Go to the link below, then hit the location/county on the map for details.
https://www.spc.noaa.gov/ Go to "hazards"
https://www.mesonet.org/index.php/weather/map/us_air_temperature/air_temperature

https://www.mesonet.org/index.php/weather/map/wind_chill_heat_index1/air_temperature

Current Weather Map
| NCEP Days 0-7 Forecast Loop | NCEP Short-Range Model Discussion | NCEP Day 3-7 Discussion |


Current Jet Stream

| Low Temperatures Tomorrow Morning |

Highs today and tomorrow.


Highs for days 3-7:
No real cold anywhere. Mild for mid-Winter the next few days, with a warm surge to end it!
But that will change, starting late in this period with a cold shot of mostly seasonal cold!


Temperatures vs average for days 3-7.
MUCH above average. A sea of red, shifting east now.............the magnitude of which will be weakening greatly as much colder air invades during the later time frame of this period. Eventually, the reds will morph to blues............along the northern tier first and mostly seasonal cold at first too.
https://www.wpc.ncep.noaa.gov/medr/medr_mean.shtml


Surface Weather features day 3-7:
No major cold air in sight or major weather systems.......quiet, especially for January. A couple of mild Pacific origin cold fronts.
Big colder changes beginning at the end of this period, very early next week but not as cold looking as yesterday..........mostly seasonal cold comes in at first!

Liquid equivalent precip forecasts for the next 7 days are below.
Heavy precip Northwest US.
Day 1 below:
http://www.wpc.ncep.noaa.gov/qpf/fill_94qwbg.gif?1526306199054

Day 2 below:
http://www.wpc.ncep.noaa.gov/qpf/fill_98qwbg.gif?1528293750112

Day 3 below
http://www.wpc.ncep.noaa.gov/qpf/fill_99qwbg.gif?1528293842764

Days 4-5 below:
http://www.wpc.ncep.noaa.gov/qpf/95ep48iwbg_fill.gif?1526306162

Days 6-7 below:
http://www.wpc.ncep.noaa.gov/qpf/97ep48iwbg_fill.gif?1526306162

7 Day Total precipitation below:
https://www.wpc.ncep.noaa.gov/qpf/p168i.gif?1566925971

Last 24 hour precip top map
Last 7 day precip below that
https://www.wunderground.com/maps/precipitation/daily


Current Dew Points

Latest radar loop
http://www.nws.noaa.gov/radar_tab.php


| (3400x1700 pixels - 2.2mb) Go to: Most Recent Image |

Go to: Most Recent Image
You can go to this link to see precipitation totals from recent time periods:
https://water.weather.gov/precip/
Go to precipitation, then scroll down to pick a time frame. Hit states to get the borders to see locations better. Under products, you can hit "observed" or "Percent of normal"
Soilmoisture anomaly:
These maps sometimes take a day to catch up to incorporate the latest data(the bottom map is only updated once a week).
https://www.cpc.ncep.noaa.gov/products/Soilmst_Monitoring/US/Soilmst/Soilmst.shtml#
![]()


Drought Monitor maps:
Latest: The first map below is the latest. The 2nd one is from last week.
January 15 : DROUGHT the last 3 months has really shrunk. It's GONE in the Southeast! One area to watch is sw Kansas and the S.Plains for the Winter wheat crop but it's dormant right now.
The maps below are updated on Thursdays.
https://droughtmonitor.unl.edu/


The top map is the Canadian ensemble average, the maps below are the individual members that make up the average at the end of week 2.
+++++++++++++++++++++++++++++++++++++++++
Each member is like the parent, Canadian model operational model.......with a slight tweek/variation in parameters. Since we know the equations to represent the physics of the atmosphere in the models are not perfect, its useful to vary some of the equations that are uncertain(can make a difference) to see if it effects the outcome and how.
The average of all these variations(ensembles) often yields a better tool for forecasting. It's always more consistent. The individual operational model, like each individual ensemble member can vary greatly from run to run.........and represent an extreme end of the spectrum at times. The ensemble average of all the members, because it averages the extremes.............from opposite ends of the spectrum.........changes much less from run to run.
End of week 2....................0z Canadian ensembles:
Updated 12z maps available this late...........turning colder late week 2 vs previous solutions. Potential for another polar vortex incursion south...on some solutions, mainly this particular model!
Starting with last week below:
Monday: Definitely less amplified at higher latitudes today, which suggests more zonal flow and Arctic air completely cut off from moving south. However, pronounced ridge SWest to West and downstream trough couplet suggests cool weather in the Southcentral to South(very mild north). A minority still want to bring in northern stream action/cold but the Canadian model has tried to do this repeatedly in recent days and mostly been wrong.
Tuesday: More amplified than Monday and a tad colder but not a great deal of northern stream influence on most solutions(minority do have a significant northern stream) just a ridge/west, cooler trough downstream couplet in the southern stream....without frigid air to tap. This model has been too cold for the last month.
Thursday: Canadian model continues to be the coldest model and is a bit cold overnight......but the other models have been moving towards the Canadian model, especially the European model late in week 2. All the models have been too cold the past month, so there is reason to be skeptical of the cold, while still wanting to believe the models trends moving in that direction. Wednesday and Wed Night. Regardless, the pattern below is for the northern jet stream to shift very far south and the Polar vortex to also accompany that/in concert as it drops to SouthCentral to Southeast Canada. There is some decent upper level ridging along the West Coast that might assist that.
Friday: 12z run. HUGE changes for an ensemble. MUCH milder, zonal, Pacific, west to east flow spreading across the country.
Saturday: Milder than a couple of days ago still with more zonal flow but still uncertain with a potential weakness/trough south of the Canadian border that cold air can drop into.
Sunday: We really have a battle going on here with all the models going back and forth each day/run on how much cold to bring down in week 2 based on whether the northern stream can make in roads south into the recently dominant southern stream binging Pacific air masses in here. We were colder midweek, then turned much milder Friday. Colder again Saturday afternoon, then milder again Saturday Night. A few solutions are bitter cold which is causing the average to be pretty cold even though the majority are not that cold. Confidence is low.
Monday: Both the northern and southern streams are stronger, so the gradient between them is more packed. Much more cross polar flow today so Canada is MUCH colder. Any air masses that make it south of the Canadian border will have some frigid air. This, while a modest ridge tries to build in the far Southeast will milder air. This is the recipe for an enormous temperature contrast from very cold in the NorthCentral to warm in the southeast. Maybe an 80 degree temperature differential at times? Small changes in the location of the main features and boundary between the contrasting air masses is causing huge model to model shifts in temperatures.
Tuesday: Cross polar flow and polar vortex in Canada..........frigid! Modest ridge trying to build in the far Southeast US.........mild! How deeply south will the frigid air be able to penetrate? Models are going back and forth on every run. For sure there will be a huge temperature gradient from northwest to southeast and the coldest anomalies will be in the NorthCentral US...to northern Rockies.
Wednesday: More ridging in the Southeast for sure. This mean more resistance to the cold air as it tries to push southeast. Trough is also farther west which lines up with that and for the coldest air to be farther west today. Still cross polar flow and mighty cold air filling up Canada so cold fronts will be loaded with frigid air in week 2.
360h GZ 500 forecast valid on Feb 13, 2020 12 UTC


Forecasts for the control (GEM 0) and the 20 ensemble members (global model not available)
Individual GFS ensemble solutions for the latest 0z run:

GFS Ensemble mean(average of all the individual solutions above). The first map is a mid/upper level map. The 2nd one is a temperatures map at around 1 mile above the surface. These are anomalies(difference compared to average).
NCEP Ensemble t = 360 hour forecast
Last Tuesday: Same as recently. Ridge Northeast Pacific. Trough(not as deep today) Pac Northwest, Ridge along the East Coast. Not favorable for lasting cold in the East.
Thursday: The long lived pattern is finally show strong signs of weakening, if not ending. The biggest chance is the extreme negative anomaly in the Northwest is going bye bye......which might allow cold air masses to the east to penetrate deeper. However, the ridge in the East from the southern stream does not want to give up. So there will be a huge battle between the northern and southern streams. Cross polar flow here means the source region for cold coming from Canada may have air from Siberia.
Friday: Big positive anomaly in Alaska connects downsteam with a negative anomaly shifting east, into the middle of the country(with the negative in the NWest filling in). Still a positive anomaly along the East Coast but this will weaken and turn negative........possibly. The biggest deal is the cross polar flow from the ridge in Alaska. Air masses from Siberia will be dumped into Canada, then be transported south, feeding into the downstream trough in the US.
Sunday: Progressing as expected. Powerful positive anomaly in Alaska and downstream negative anomaly in the Northeast is textbook couplet for cold air delivery from Canada south into the US. The source r
Tuesday: Numerous anomalies, without any one being powerful enough to key off of. The dominant pattern leading up to this period, however is mild Pacific flow and modest ridging along the West Coast in mid latitudes. One thing that does stand out with the maps below is cross polar flow into Alaska and NW Canada. Some of that could leak farther south if the zonal flow in the US allows it.
Thursday: Unusual configuration. At the mid latitudes, a favorable ridge/West, trough east couplet for warm West and cold East. Just the opposite at higher latitudes with a trough/West and Ridge/East. This probably means the real frigid air will stay locked up around Alaska/N.Canada, while the cold air delivery farther south in the US is good at times(in the East), the fronts will most often have Pacific air masses that are mild with the major cold much too far north to get entrained into most/all of these fronts. If the pattern amplified like the Canadian model(or what some other model runs have done at times-and most been too cold) then the bitter cold could be tapped.but not with the anomalies below.
Friday: Anomaly magnitudes pretty weak and NOT favorable for cold air moving south from higher latitudes. Sure, there will be "cold" fronts in the East with this type of pattern but they will lack a frigid punch and not be sustained.
Saturday: Unstable anomaly centers. A new big one popping up in the N.Atlantic. Could this turn into a Greenland block with a -NAO developing and cold East? Negative anomalies in Alaska and NW Canada will keep coldest air up there until this changes.
Sunday: Models struggling with how much cold comes in week 2. Anomalies below are not ideal for sustained cold to penetrate deeply into the US.
Monday: Anomalies continue to move around and be weak in North America. Cold now looking more likely in the West and especially the N.Plains than it did and warmth in the Southeast.
Tuesday: Anomalies are more favorable for cold now. Modest ridge off the West Coast/far East Pacific and downstream trough in SouthCentral Canada with trough into the US. Nice couplet for air to travel from north to south between them and into the trough. The origin of the air masses in Canada will be frigid with cross polar flow from N.Siberia feeding into Canada.
Wednesday: Building positive anomaly in the Southeast from an upper level ridge that will block the coldest air from getting deeply into the Southeast. This has warmed forecasts overnight for the East(less HDD's). Cold will still be able to get across the Canadian border with ease. W. Canada and Alaska are bone chilling cold from cross polar flow, so the cold just south of the Canadian border will be major cold. .........as in N.Plains/Rockies.

Latest, updated graph/forecast for AO and NAO here, including an explanation of how to interpret them...............mainly where they stand at the end of 2 weeks.
Previous analysis, with the latest day at the bottom for late week 2 period.
https://www.marketforum.com/forum/t
Discussions, starting with the oldest.
Last Monday: AO now is forecast to STAY POSITIVE for the duration, which lessens risk for major cold outbreaks. NAO drops to near 0, while the PNA becomes positive for the first time in ages. This suggests mild temps over much of the country, especially West and North but chilly with respect to average in parts of the south.
Tuesday: AO stays positive............lessens chances for bitter cold to get into the US. NAO close to 0. PNA slightly positive to near 0.
Thursday: The biggest case for NOT turning much colder continues to be the AO staying positive for the duration. This weakens air flow from high latitudes towards mid latitudes.......keeping the cold air locked up in the north. The NAO and PNA are pretty close to 0 and not a big consideration in leaning in any direction from those indice values.
Friday: Again, the +AO suggests the models will be too cold and sure enough, they all turned MUCH milder the past 24 hours. However, there were a few members that suggested an AO dropping to below zero late week 2 but all the models have been too cold, especially the Canadian model for the last month, so the milder shifts are in line with the model performance(poor recently). PNA a slight + that favors warmer west vs slightly cooler east. NAO close to 0 or just above, also not a value that makes us think it will get and stay cold for very long............but the pattern may be unstable with a battle between the southern and northern stream unresolved. Yesterday, the northern stream was predicted to win in February. Today, it's the southern stream.
Saturday: +AO still but some members a bit negative. Ideally would prefer a -AO to go with a cold February. NAO close to 0. PNA a bit positive with mild temps in the West.
Sunday: Still the +AO makes major, sustained cold less likely but huge spread with a couple negatives making it uncertain. NAO and PNA not far from 0.
Monday: Still +AO but one member at -4, which seems crazy. NAO near 0. PNA drifting lower may starts favoring more cold in the West again.
Tuesday: Still +AO makes it tough to get too bullish on sustained cold even though there will be FRIGID air in Canada and some will likely get into the US. NAO and PNA not far from 0.
Wednesday: Holy Cow on the AO. Extremely wide spread here with uncertainty and a few just above 0 but several at record +++++AO, at the top of the chart. While that seems overdone, one can't be bullish at all about cold from higher latitudes pushing deeply into the mid latitudes for any sustained period of time. This is clearly bearish for ng with the average around ++AO. NAO also is a bit positive(not favorable for cold penetrating south) and PNA around 0 to tad negative.
National Weather Service 6-10 day, 8-14 day outlooks.
Updated daily just after 2pm Central.
Temperature Probability
 Precipitation Probability

| the 8-14 day outlooks ArchivesAnalogsLines-Only FormatGIS Data | |
Temperature Probability | |
 | |
Previous comments:
By Jim_M - Jan. 17, 2020, 4:02 p.m.
I hate the cold and as far as I'm concerned for NE Ohio, this has been a great winter so far. Looking t the week3-4 map and the cold, winter is past the half way point.
My concern is usually cold winters kill off bugs. Could be a miserable summer for insects.
++++++++++++++++++++++++++++++++++
Re: Re: Re: Re: Weather Friday
By metmike - Jan. 18, 2020, 8:18 a.m.
Thank Jim.
Yes, we are past the halfway point of Winter weather. Mild Winters do allow more living things to survive, including bugs. Cold is what kills most life prematurely on this planet.
+++++++++++++++++++++++++++++++++++++++++++++++++++++
By WxFollower - Jan. 18, 2020, 7:06 p.m.
Mike said: "Saturday: Change from Friday! Half the members greatly amplify the northern stream and are VERY cold. Even some cross polar flow on a few. The other half are very mild. The average has the ridge/west, trough east more amplified. Canadian model is by far the coldest model this morning. Other models are milder."
--------------------------------------------------------------------------------------
Mike,
The CDN ensemble cold bias has been awful. Actually, all models have averaged too cold recently with the GFS ens being bad and even the Euro ens having some cold bias though the least of the three. But again, the CDN has been THE worst. You probably already realize this. I don't think the NG market takes it seriously, especially when it is cold on its own.
++++++++++++++++++++++++++++++++++++++
metmike: I agree with that strongly Larry and glad you pointed it out so that I can mention it in my analysis.
+++++++++++++++++++++++++++++++
By bear - Jan. 20, 2020, 4:49 p.m.
weather here is low 70's, nice, calm, overcast.
a beautiful day to be outside, doing that home maintenance (which never seems to end).
++++++++++++++++++++++++++++++++++++++
By metmike - Jan. 20, 2020, 5:39 p.m.
Thanks bear!
++++++++++++++++++++++++++++++++++++++++++++
The climate prediction center's new
By wxgrant - Jan. 24, 2020, 4:42 p.m.
week 3-4 prediction is much warmer than the previous. Thinking they may also be cautious on the cold bias the models have shown all winter.
+++++++++++++++++++++++
Re: Re: Re: Re: Weather Friday
By metmike - Jan. 24, 2020, 8:46 p.m.
That makes sense Grant, great point. In fact, they allude to that in their technical discussion:
https://www.cpc.ncep.noaa.gov/products/predictions/WK34/
" Although many of the tools including the Sub-X MME continue to indicate a colder outcome across the central and eastern CONUS, forecast confidence is reduced by recent poor model consistency and the likelihood for above-normal temperatures persisting through Week-2."
++++++++++++++++++++++++++++++++++++
By MarkB - Jan. 25, 2020, 11:50 a.m.
When I was a young boy, in the 60's and early 70's, an old man was my mentor. In the year that I was to turn 16, he died two weeks before his 105th birthday. But I have always remembered his observation about winter. "If we have a mild winter before Christmas, then after Christmas would be extreme." At the time, he wasn't wrong. For I experienced many a winter that played out just like he had observed.
But things are different now.
++++++++++++++++++++++
By metmike - Jan. 25, 2020, 2:01 p.m.
Wow! That guy must have had loads of wisdom to share.
105 years old back then must have been 1 of the oldest people in the world!
I don't know of any scientific correlation that would support his observation but often, old timers will remember things that repeat enough to identify things that scientists don't think or know about based on their book knowledge.
++++++++++++++++++++++++++++++++++
By metmike - Jan. 25, 2020, 6:42 p.m.
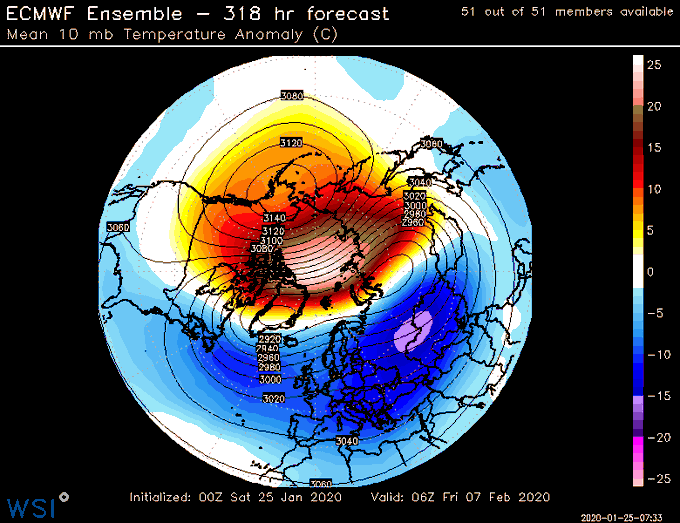
The Stratospheric Polar Vortex is going to take a hit here in the medium-range under a displacement event off the North Pole. This is the most vulnerable we've seen the vortex so far this Winter. To be seen on how this evolves and what impacts it has on the pattern.
+++++++++++++++++++++++++++++++++++
By WxFollower - Jan. 25, 2020, 6:57 p.m.
As of 12Z today, model HDDs are colder than 12Z yesterday by the following:
EPS: ~6
GEFS:~3
++++++++++++++++++++++++++
By metmike - Jan. 25, 2020, 8:16 p.m.
Thanks Larry,
I also noted the big swing colder today in the late period.
If that continues and actually happens, the lows should be in for natural gas and we should open higher Sunday Night.
As always, the open will be subject to the potential of being of a greater magnitude higher or lower than one might guess based on just the change in weather.
I will guess that we might have traders that positioned the wrong side on Friday and want out or traders that want in..........period, at the market vs waiting to price.
It makes sense too that after being closed 2 days, pent up buying/selling can get lopsided to one side and come out all at once, quickly on and shortly after the open.
On your HDD's. Am I imagining it or don't you usually have a + sign when there are more heading degree days(colder)?
+++++++++++++++++++++++++++
By WxFollower - Jan. 25, 2020, 11:01 p.m.
Mike,
Yes, but I prefaced it by saying colder than. There’s an implied + sign. I put the ~ with each because they’re approximate.
++++++++++++++++++++++++++
By metmike - Jan. 25, 2020, 11:33 p.m.
I thought that was the case and am not questioning it other than wondering if it was my imagination or not(I get confused on stuff and didn't want to be confused).
It's always terrific to have your comments here but on natural gas and weather, it's terrific to the 3rd power (-:
++++++++++++++++++++++++
By metmike - Jan. 25, 2020, 11:40 p.m.
On the EPS, the 12z run went to 303 HDD's vs the previous 0z run at 290 HDD's.
That's a massive increase +13 HDD's for an ensemble in just 12 hours.
++++++++++++++++++++++++++++++
By metmike - Jan. 27, 2020, 2:28 p.m.
·
GFS long range snow forecast have been like a kindergartener coloring book. Myabe if I make fun of the 18z run it will actually try to happen
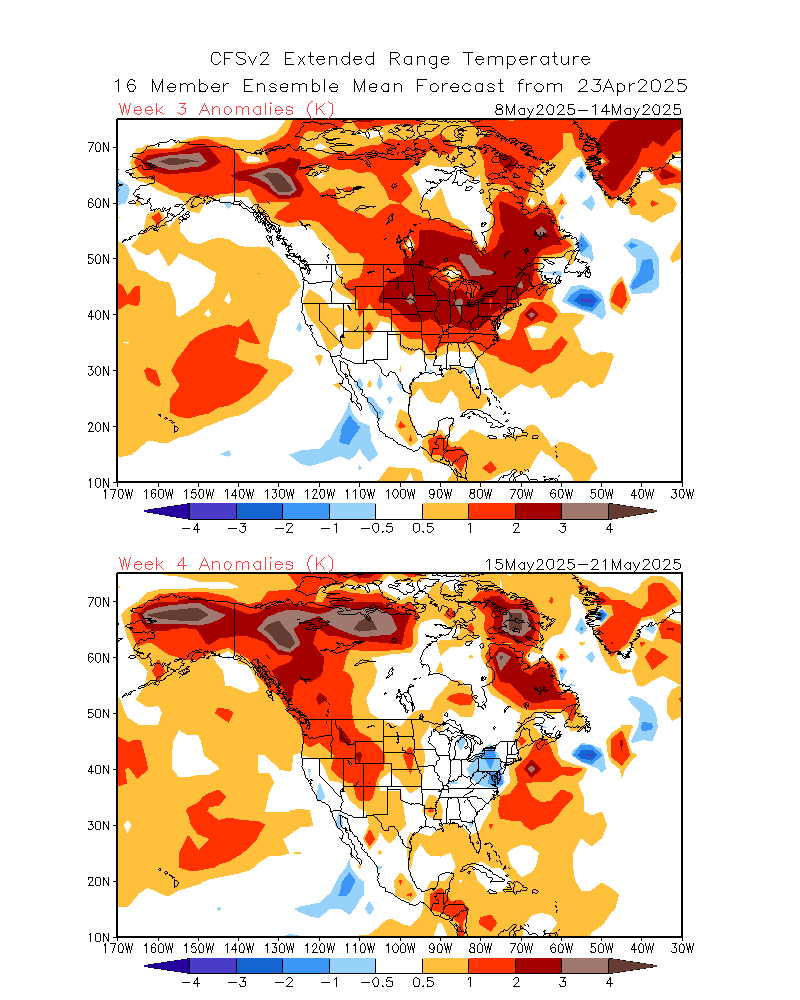
Temps for weeks 3 and 4 from yesterdays CFS model run. Frigid air across Canada(high confidence of that) surges into the NorthCentral US week 3(low/moderate confidence), then modifies but still cold week 4.
Mild Southeast from an upper level ridge..........impedes/blocks the cold
Latest El Nino/ENSO discussion:
ENSO: Recent Evolution, Current Status and Prediction
Madden-Julian Oscillation: Recent Evolution, Current Status and Predictions Update prepared by the Climate Prediction Center Climate Prediction Center / NCEP 27 January 2020
https://www.cpc.ncep.noaa.gov/products/precip/CWlink/MJO/mjoupdate.pdf
•Following a robust MJO event during most of January, the MJO has since weakened and become disorganized in late January.•Dynamical and statistical model guidance suggests possible reemergence of the MJO late into Week-2. Models favor the persistence of suppressed convection across the Maritime Continent into early FebruaryIt is likely that the MJO plays little to no role in the circulation pattern over North America during the next two weeks.

January 27, 2020
The latest EE really builds the upper level ridge in Alaska/NW Canada. This is going to help maximize the amount/intensity of cold that drops thru W.Canada and from cross polar flow, aimed at the N. USA.
However, it also build the upper ridge in the Southeast, which will try to impede the amount of cold tracking very far southeast.
This is the recipe for a massive temperature differential. I would not be surprized to see a close to 100 degree temp contrast for a time with FL in the 80's' and the N.Rockies well below 0 deg F.


