APRIL 1, 2020: The previous coronavirus thread was getting excessively long, so we've started a new one here in the new month.
Note: A month ago, with almost no test results, I guessed that total March cases would be around 10,000..............19 times too low! Sorry about that! By 2 weeks later, after the data showed the big increases, I quickly adjusted that to 200,000 total cases by the end of March. We ended the month with 190,000 total cases. So tracking the data closely the past 2 weeks is giving us more and more information to hone in our predictive skills.
There is still tremendous uncertainty but its becoming less every day. Every day is one day closer to good news outweighing bad news by an increasing margin. I'm confident that will happen faster than most people think. The daily data is advertising that right now!!
+++++++++++++++++++++++++++++++++++++++++++
Sunday 4- 12-20: Another drop lower. Some of it could be from it being Sunday/Easter.
++++++++++++++++++++++++++++
Monday: Ready now to adjust the estimate downward if numbers for new cases drop this week. How about 1,100,000 new cases at the end of April and deaths around 43,000 then. Don't take that too serious. Still 2 weeks of data to make current estimates wrong............but the spread/range in estimates is shrinking as well as confidence as each day passes.
++++++++++++++++++++++++++++++++++++++++++++
Tuesday: New infection rate/positive tests peaked last week (4-4, 4-9, 4-10 triple top)being confirmed right now. Death rate,most lagging indicator is peaking this week. New high of 2,387 today.
+++++++++++++++++++++++++++++++++++++++++++++++=
Wednesday: Today was a bit higher than the last few days but the highs are still in for the daily new infection numbers. Would be a surprise to see new highs here. New high for deaths, the longest lagging indicator......2,557 is expected.
+++++++++++++++
Thursday: Did the cold, very dry air cause us to go higher here? Deaths were revised to 53,000........I've not been paying attention to this and been too low.https://www.marketforum.com/forum/topic/49391/
+++++++++++++++++++++++++++++++++++++++++++++++++++
Friday: Staying elevated but below the highs.
++++++++++++++++++++++++++++++++++++++++++++++++
Saturday: WTHeck: They just increased the deaths on Tuesday from 2,557 to 5,977! That can't be right! The day before was 1,718-Mon and day after-Wed was 2,795, then 2,110-Thu.
++++++++++++++
Sunday: Lowest daily increase in new cases since March 30th. However, Sunday's in the past have a tendency to report low numbers.
++++++++++++++++++++++++++++++++++++++++++++++++++++++++++++++
Previous thread below:
https://www.marketforum.com/forum/topic/48892/
*Tracking the Coronavirus-TUE#'s at the bottom-rate slowing down a bit?
41 responses |
Started by metmike - March 14, 2020, 11:49 a.m.
Last 2 posts from the previous thread to pick up from on this new thread:
Re: *Tracking the Coronavirus-THU numbers show increasing rate still
By metmike - March 31, 2020, 11:53 a.m.
TUESDAYS UPDATE BELOW.
The first number is the increase compared to the previous day. Clearly, that number is soaring higher.
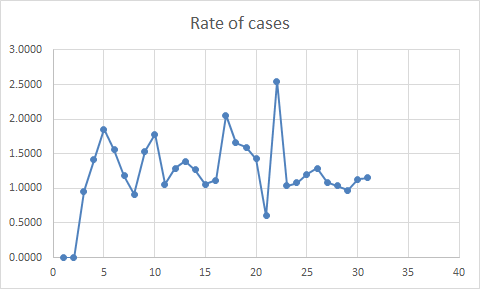
The 2nd number is the increase compared to the previous day's increase...........a key metric in determining when we will be seeing the inflection point. When this 2nd number is consistently not going higher and especially if the 2nd number can put in numerous days of actually being lower, then we might be topping out for the RATE of transmission.
New daily cases will still be going up when we start to see a deceleration.............but just not as fast. This happens first, before daily cases go down which is what we obviously want to see but seeing the RATE of increase, losing momentum will give us the first clue of it topping in the US.
Since the daily numbers are pretty volatile, we need numerous data points to have any confidence of a reliable signal. We are still going in the wrong direction right now, so this will probably not happen in the next week.
Each day, ends at Midnight CDT.
https://coronavirus.1point3acres.com/en
Date New Cases+/-change in new cases vs yesterday %change in new cases
3-3 21
3-4 31+10
3-5 75+46
3-6 99+24
3-7 116+17
3-8 121+5
3-9 179+58
3-10 290+111
3-11 247-43
3-12 425+178
3-13 528+103
3-14 732+204
3-15 710-22
% Increase in daily rate vs previous day this week(with increased testing-this number will go lower as first indicator of slow down)
3-16 968+264 +37%
3-17 1,451+483 +50%
3-18 2,566+1,112 +77%
3-19 5,424+2858 +111%
3-20 5,490+65 +1%
3-21 7,160+1,670 +30%
3-22 8,324+1164 +16%
3-23 9,723+1,399 +17% previous 11,045+2,711 +33%
3-24 10,494 +771 +8% previous 9,216 -2,029 -18%
3-25 13,931 +3,437 +33% previous 13,993 +4,777 +52%
3-26 16,768 +2,839 +21%
3-27 18,888 +2,106 +12%
3-28 19,789 +1,001+4%
3-29 17,944 -1,845 -9% -odd update previous 19,324 -444 -2%
3-30 21,851 +3,907 +22%
3-31 25,412-11pm- +3,561 +16%
Total cases 189,791 (previous estimate 200,000 for the end of March)
SUNDAY:
They made some big changes again to past data on Friday. This time decreasing 3-23 and increasing 3-24 by over 1,200.
4 days in a row with % of new case numbers slowing down. Too early to say FOR SURE that we're turning the corner...........need several more days like this to confirm but this is what turning the corner will look like in its earliest stage and its possible it's starting to happen.
The huge changes they have made to past data on a couple of occasions, makes me skeptical regarding how reliable this data is but if these numbers/this data is accurate, then the rate of increase IS slowing down.
Monday: Still possible to see the rate go back up faster this week.
Final comment Monday: Odd that they dropped yesterdays already lower number by more than 1,300 but Monday was higher. Though the rate over the last 5 days has slowed down.
Tuesday: The rate of increase has slowed down a bit the past 6 days vs the previous 6 days. Numbers are still increasing but considering that part of it is still from catching up on the testing, mitigation is definitely making a difference. Keep up the good work for a few more weeks. Things will be looking much better soon.
++++++++++++++++++++++++++++++++++
Re: *Tracking the Coronavirus-THU numbers show increasing rate still
By cutworm - April 1, 2020, 6:31 a.m.
Info For these charts gleaned from https://www.worldometers.info/coronavirus/country/us/
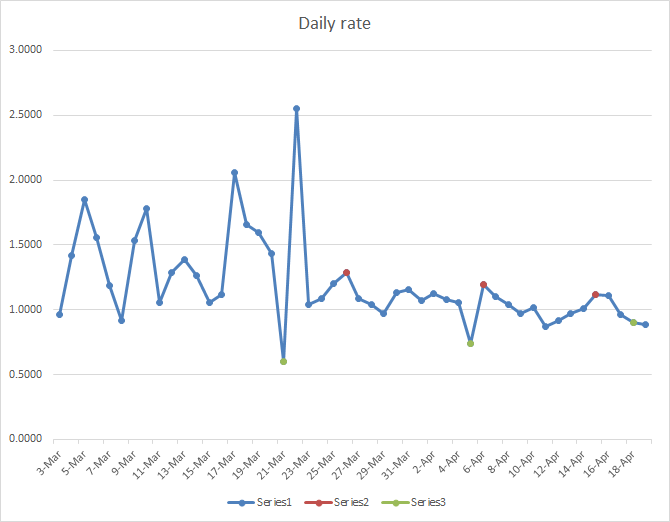
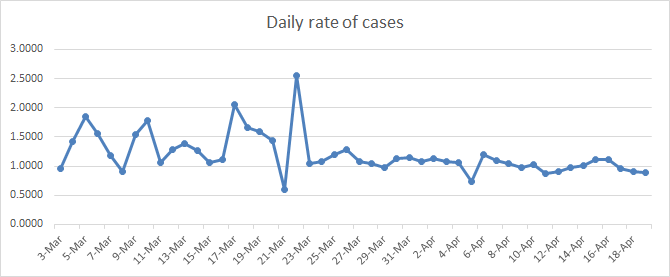
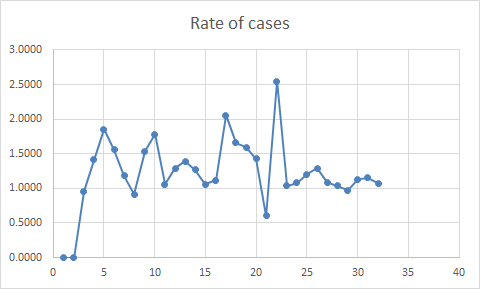
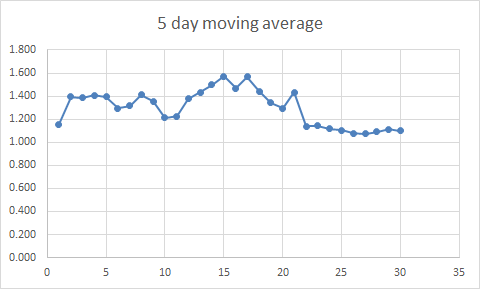
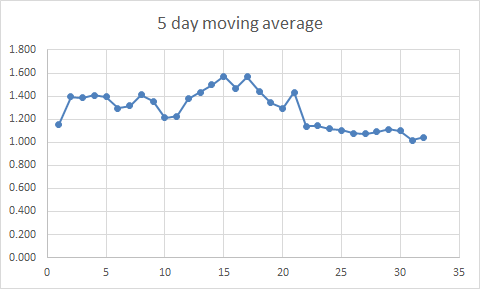
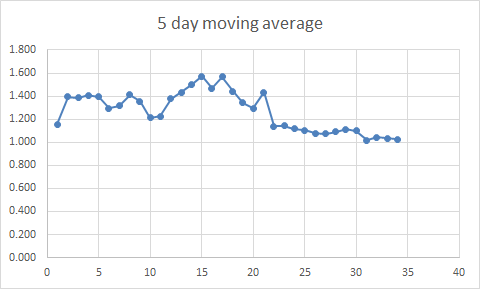
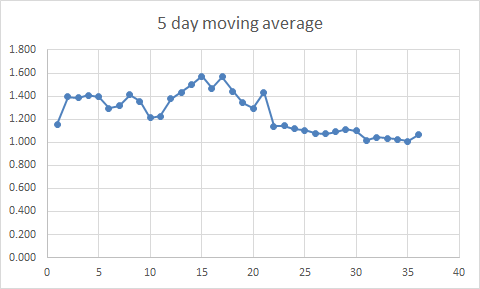
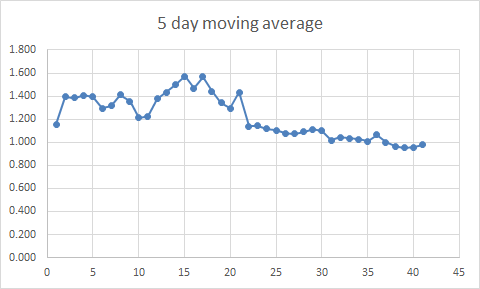
Cutworm: We still haven't broken1 which would be the inflection point. We have slowed the rate of increase from about 1.3-1.4 down to about 1.15ish
note: several things can affect the input data. We can only work with what we have.
Thank you VERY VERY much cutworm!
WEDNESDAY update below:
https://coronavirus.1point3acres.com/en
Date New Cases+/-change in new cases vs yesterday %change in new cases
3-3 21
3-4 31+10
3-5 75+46
3-6 99+24
3-7 116+17
3-8 121+5
3-9 179+58
3-10 290+111
3-11 247-43
3-12 425+178
3-13 528+103
3-14 732+204
3-15 710-22
% Increase in daily rate vs previous day this week(with increased testing-this number will go lower as first indicator of slow down)
3-16 968+264 +37%
3-17 1,451+483 +50%
3-18 2,566+1,112 +77%
3-19 5,424+2858 +111%
3-20 5,490+65 +1%
3-21 7,160+1,670 +30%
3-22 8,324+1164 +16%
3-23 9,723+1,399 +17% previous 11,045+2,711 +33%
3-24 10,494 +771 +8% previous 9,216 -2,029 -18%
3-25 13,931 +3,437 +33% previous 13,993 +4,777 +52%
3-26 16,768 +2,839 +21%
3-27 18,888 +2,106 +12%
3-28 19,789 +1,001+4%
3-29 17,944 -1,845 -9% -odd update previous 19,324 -444 -2%
3-30 21,851 +3,907 +22%
3-31 25,678- +3,827 +17%
4-1 26,770 +1,092 +4%
Total cases 216,692 (previous estimate 200,000 for the end of March)
SUNDAY:
They made some big changes again to past data on Friday. This time decreasing 3-23 and increasing 3-24 by over 1,200.
4 days in a row with % of new case numbers slowing down. Too early to say FOR SURE that we're turning the corner...........need several more days like this to confirm but this is what turning the corner will look like in its earliest stage and its possible it's starting to happen.
The huge changes they have made to past data on a couple of occasions, makes me skeptical regarding how reliable this data is but if these numbers/this data is accurate, then the rate of increase IS slowing down.
Monday: Still possible to see the rate go back up faster this week.
Final comment Monday: Odd that they dropped yesterdays already lower number by more than 1,300 but Monday was higher. Though the rate over the last 5 days has slowed down.
Tuesday: The rate of increase has slowed down a bit the past 6 days vs the previous 6 days. Numbers are still increasing but considering that part of it is still from catching up on the testing, mitigation is definitely making a difference. Keep up the good work for a few more weeks. Things will be looking much better soon.
Wednesday: The RATE of increase has likely peaked and will soon be headed down slowly. Still need a couple more days to confirm that. The data is the data and every additional point improves our predictive skill.
We have a reliable leading indicator that is often 2 weeks ahead of the daily infection reports which is providing powerful evidence that the current rate of new numbers of people with the flu/coronavirus.....measured in real time has been falling for awhile now(even as new cases and delayed test results have continued to show an increase because they are LAGGING indicators).
Info For these charts gleaned from https://www.worldometers.info/coronavirus/country/us/
The end date is 4-1
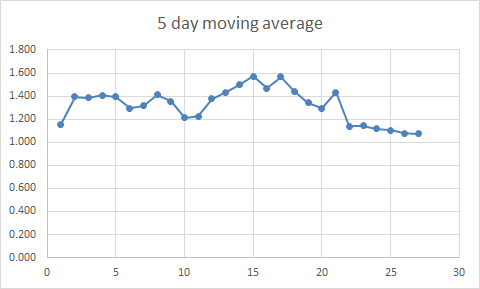
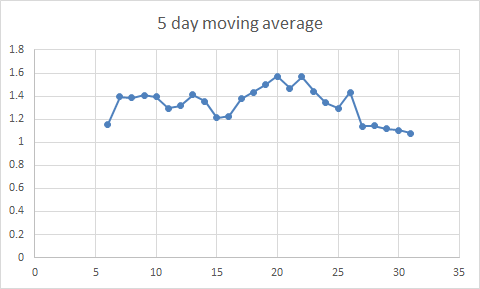
Cutworm: We have a good downward trend . We have also lowered 5 day average to the lowest yet at 1.0724. Getting close! As Mike said earlier this is a lagging indicator.
Thank you again VERY VERY much cutworm!
Thursday: It took just less than 8 days to double the number of new cases to today's total.
https://coronavirus.1point3acres.com/en
Date New Cases+/-change in new cases vs yesterday %change in new cases
3-3 21
3-4 31+10
3-5 75+46
3-6 99+24
3-7 116+17
3-8 121+5
3-9 179+58
3-10 290+111
3-11 247-43
3-12 425+178
3-13 528+103
3-14 732+204
3-15 710-22
% Increase in daily rate vs previous day this week(with increased testing-this number will go lower as first indicator of slow down)
3-16 968+264 +37%
3-17 1,451+483 +50%
3-18 2,566+1,112 +77%
3-19 5,424+2858 +111%
3-20 5,489+65 +1%
3-21 7,172+1,683 +30%
3-22 8,337+1165 +16%
3-23 9,740+1,403+17% previous 11,045+2,711 +33%
3-24 10,523 +783 +8% previous 9,216 -2,029 -18%
3-25 13,892 +3,369 +33% previous 13,993 +4,777 +52%
3-26 16,755 +2,863 +21%
3-27 18,756 +2,101 +12%
3-28 19,795 +1,039+4%
3-29 17,942 -1,853 -9% -odd update previous 19,324 -444 -2%
3-30 21,834 +3,896 +22%
3-31 25,608- +3,774 +17%
4-1 26,419 +811 +3%
4-2 29,211 +2,792 +11%
Total cases 245,587 (previous estimate 200,000 for the end of March-was 190,000)
Let's wild guess 1,200,000 total infections for the end of April and 25,000 deaths.
SUNDAY:
They made some big changes again to past data on Friday. This time decreasing 3-23 and increasing 3-24 by over 1,200.
4 days in a row with % of new case numbers slowing down. Too early to say FOR SURE that we're turning the corner...........need several more days like this to confirm but this is what turning the corner will look like in its earliest stage and its possible it's starting to happen.
The huge changes they have made to past data on a couple of occasions, makes me skeptical regarding how reliable this data is but if these numbers/this data is accurate, then the rate of increase IS slowing down.
Monday: Still possible to see the rate go back up faster this week.
Final comment Monday: Odd that they dropped yesterdays already lower number by more than 1,300 but Monday was higher. Though the rate over the last 5 days has slowed down.
Tuesday: The rate of increase has slowed down a bit the past 6 days vs the previous 6 days. Numbers are still increasing but considering that part of it is still from catching up on the testing, mitigation is definitely making a difference. Keep up the good work for a few more weeks. Things will be looking much better soon.
Wednesday: The RATE of increase has likely peaked and will soon be headed down slowly. Still need a couple more days to confirm that. The data is the data and every additional point improves our predictive skill.
Thursday: Maintaining close to the recent average. It took just less than 8 days to double the number of new cases to today's total.
We have a reliable leading indicator that is often 2 weeks ahead of the daily infection reports which is providing powerful evidence that the current rate of new numbers of people with the flu/coronavirus.....measured in real time has been falling for awhile even as new cases and delayed test results have continued to show an increase because they are LAGGING indicators).
https://www.marketforum.com/forum/topic/49867/
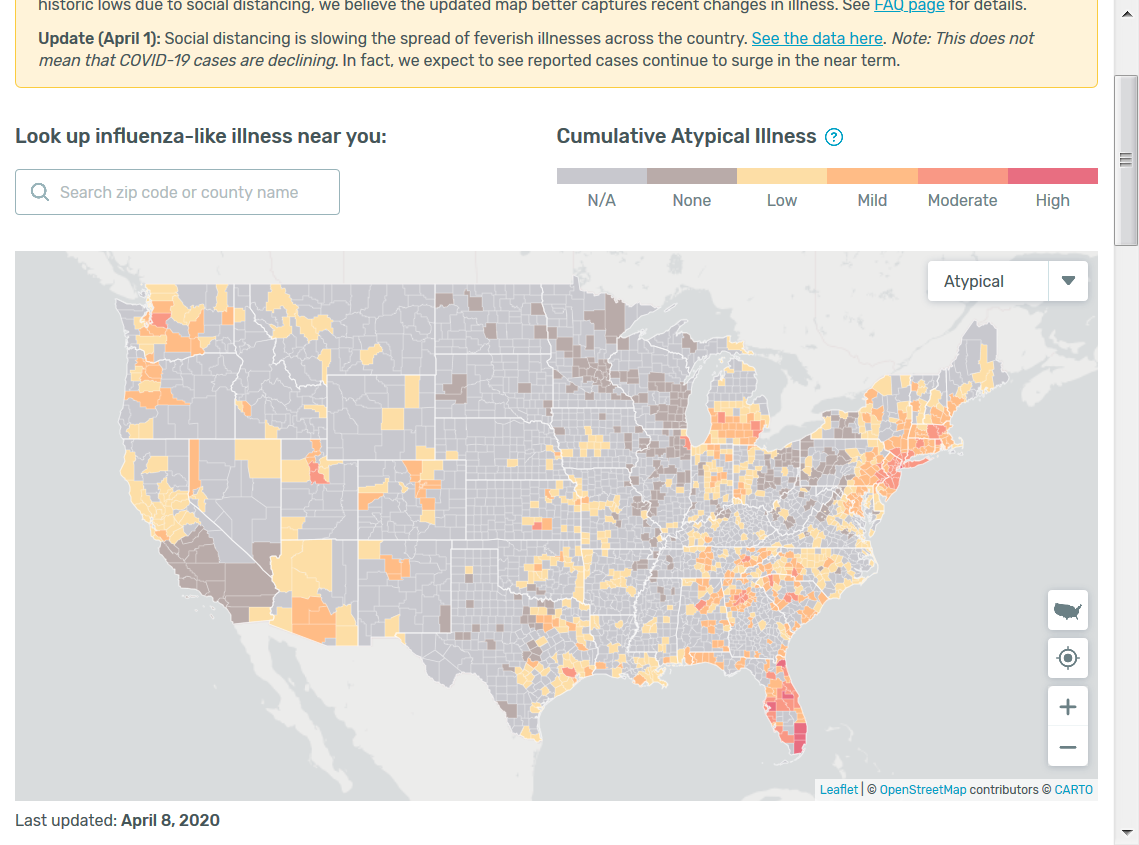
metmike:
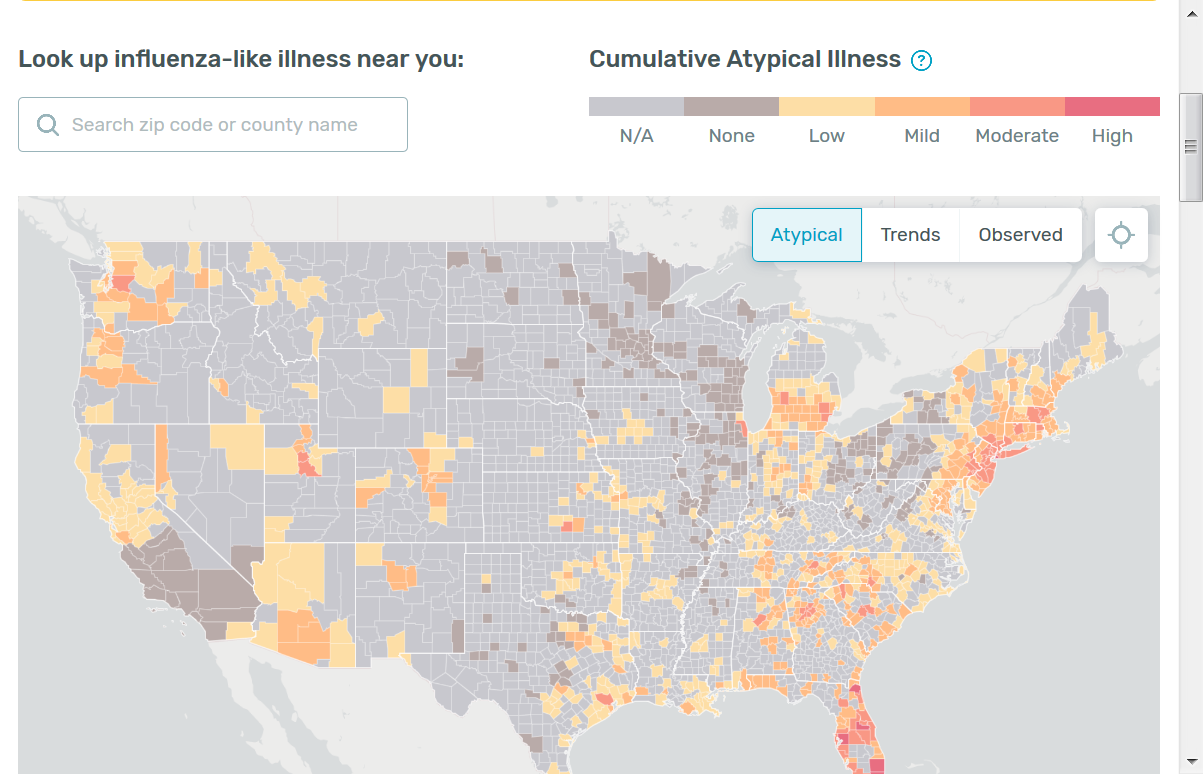
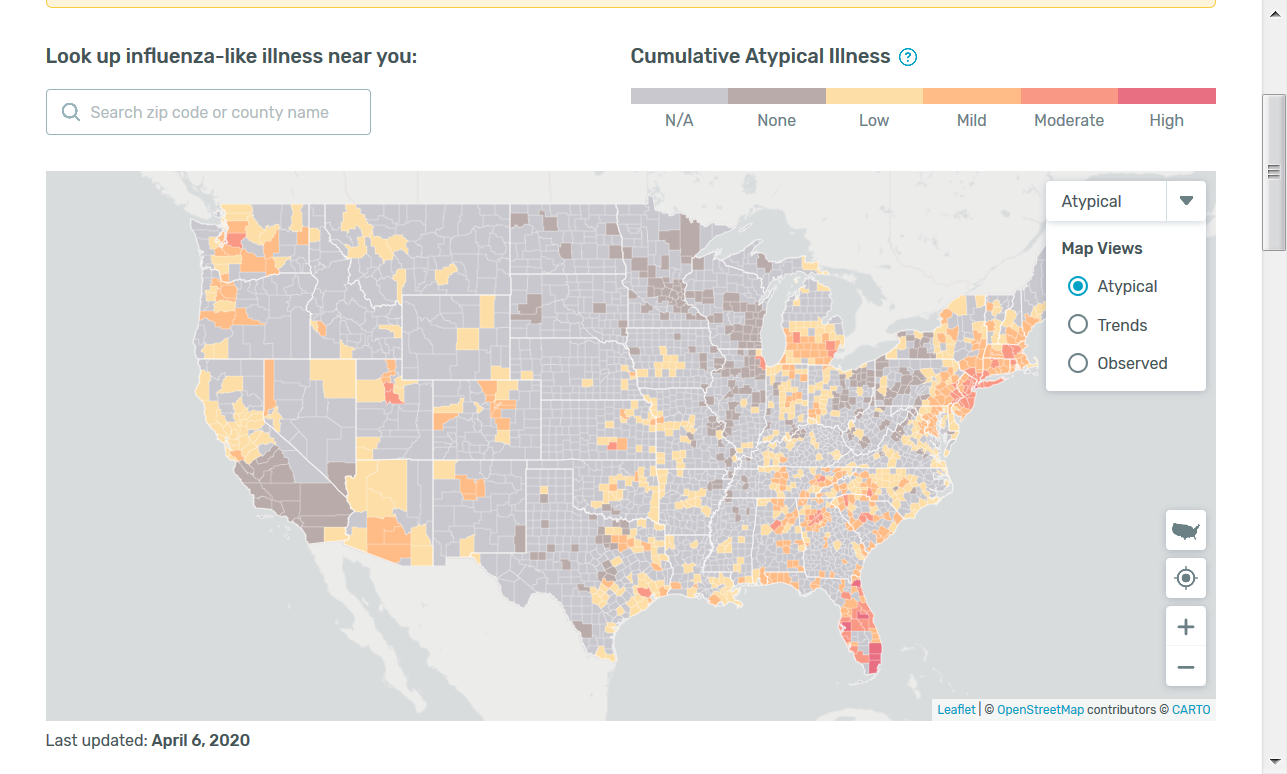
The top map shows the current conditions compared to average for this date. It clearly identifies the red hot spots where a lot of people are sick from the flu or COVID-19.
The 2nd map shows the trend for the last 7 days.
Blues on the map below show DECREASING fevers........for all illnesses.
In the previous 4 years, this tracked closely with and accurately with the flu(and other illnesses with a fever). In 2020, it shows a combination of fevers from the flu, coronvirus and other illnesses. They have all been plunging lower during the 2nd half of March...............even while new CONFIRMED BY TEST cases of coronavirus are still going up.
This is because fevers are a LEADING indicator. People have a fever for a couple of days BEFORE they get medical attention. After they sought medical attention(before tests were widely available recently), they then could be tested. The test results sometimes took over a week to come back. So their fevers were first reported on the maps below, in many cases well over a week before they showed up as a new coronavirus case.
https://healthweather.us/?mode=Trends
.png)
.png)
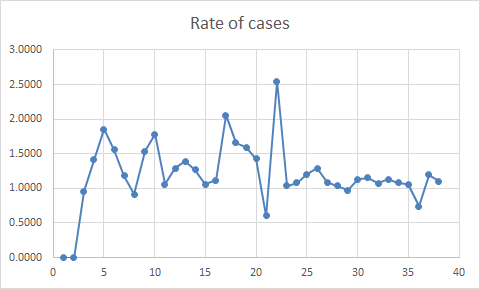
Info For these charts gleaned from https://www.worldometers.info/coronavirus/country/us/
The end date is 4-2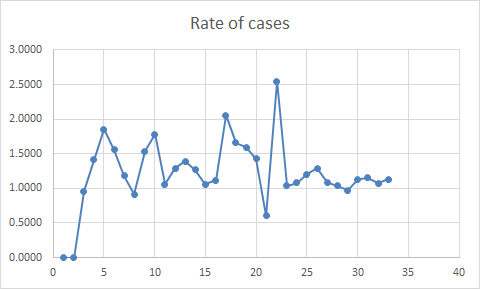
Looks like the 5 day MA has crept up a tic or 2.
Thank you again VERY VERY much cutworm!
Tim, I agree but the leading indicator..........fevers, is telling us it should drop soon.
Thursday: It took just less than 8 days to double the number of new cases to today's total.
https://coronavirus.1point3acres.com/en
Date New Cases+/-change in new cases vs yesterday %change in new cases
3-3 21
3-4 31+10
3-5 75+46
3-6 99+24
3-7 116+17
3-8 121+5
3-9 179+58
3-10 290+111
3-11 247-43
3-12 425+178
3-13 528+103
3-14 732+204
3-15 710-22
% Increase in daily rate vs previous day this week(with increased testing-this number will go lower as first indicator of slow down)
3-16 968+264 +37%
3-17 1,451+483 +50%
3-18 2,566+1,112 +77%
3-19 5,424+2858 +111%
3-20 5,489+65 +1%
3-21 7,172+1,683 +30%
3-22 8,337+1165 +16%
3-23 9,740+1,403+17% previous 11,045+2,711 +33%
3-24 10,523 +783 +8% previous 9,216 -2,029 -18%
3-25 13,892 +3,369 +33% previous 13,993 +4,777 +52%
3-26 16,755 +2,863 +21%
3-27 18,756 +2,101 +12%
3-28 19,795 +1,039+4%
3-29 17,942 -1,853 -9% -odd update previous 19,324 -444 -2%
3-30 21,811 +3,790 +22%
3-31 25,601- +3,774 +17%
4-1 26,438 +837 +3%
4-2 29,510 +3,072 +12%
4-3 32,234 +2,724 +9%
Total cases 277,999 (previous estimate 200,000 for the end of March-ended up being 190,000)
Let's wild guess 1,200,000 total infections for the end of April and 30,000 deaths. I increased the deaths because the rate of increase in deaths has NOT slowed down yet, which I should have anticipated earlier since its the most lagging indicator. Deaths on Friday are spiking higher to support that but its just 1 data point.
SUNDAY:
They made some big changes again to past data on Friday. This time decreasing 3-23 and increasing 3-24 by over 1,200.
4 days in a row with % of new case numbers slowing down. Too early to say FOR SURE that we're turning the corner...........need several more days like this to confirm but this is what turning the corner will look like in its earliest stage and its possible it's starting to happen.
The huge changes they have made to past data on a couple of occasions, makes me skeptical regarding how reliable this data is but if these numbers/this data is accurate, then the rate of increase IS slowing down.
Monday: Still possible to see the rate go back up faster this week.
Final comment Monday: Odd that they dropped yesterdays already lower number by more than 1,300 but Monday was higher. Though the rate over the last 5 days has slowed down.
Tuesday: The rate of increase has slowed down a bit the past 6 days vs the previous 6 days. Numbers are still increasing but considering that part of it is still from catching up on the testing, mitigation is definitely making a difference. Keep up the good work for a few more weeks. Things will be looking much better soon.
Wednesday: The RATE of increase has likely peaked and will soon be headed down slowly. Still need a couple more days to confirm that. The data is the data and every additional point improves our predictive skill.
Thursday: Maintaining close to the recent average. It took around 5 days to double the number of new cases to today's total. I mistakenly stated 8 days previously.
Friday: Close to the same rate this week which is a bit less than last weeks rate.
We have a reliable leading indicator that is often 2 weeks ahead of the daily infection reports which is providing powerful evidence that the current rate of new numbers of people with the flu/coronavirus.....measured in real time has been falling for awhile even as new cases and delayed test results have continued to show an increase because they are LAGGING indicators).
Info For these charts gleaned from https://www.worldometers.info/coronavirus/country/us/
The end date is 4-3
Cutworm: Current rate 1.0807
Thank you again VERY VERY much cutworm!
Saturday. The doubling rate is around 5.6 days right now.
https://coronavirus.1point3acres.com/en
Date New Cases+/-change in new cases vs yesterday %change in new cases
3-3 21
3-4 31+10
3-5 75+46
3-6 99+24
3-7 116+17
3-8 121+5
3-9 179+58
3-10 290+111
3-11 247-43
3-12 425+178
3-13 528+103
3-14 732+204
3-15 710-22
% Increase in daily rate vs previous day this week(with increased testing-this number will go lower as first indicator of slow down)
3-16 968+264 +37%
3-17 1,451+483 +50%
3-18 2,566+1,112 +77%
3-19 5,424+2858 +111%
3-20 5,489+65 +1%
3-21 7,172+1,683 +30%
3-22 8,337+1165 +16%
3-23 9,740+1,403+17% previous 11,045+2,711 +33%
3-24 10,523 +783 +8% previous 9,216 -2,029 -18%
3-25 13,892 +3,369 +33% previous 13,993 +4,777 +52%
3-26 16,755 +2,863 +21%
3-27 18,747 +2,101 +12%
3-28 19,723 +1,039+4%
3-29 17,941 -1,853 -9% -odd update previous 19,324 -444 -2%
3-30 21,809 +3,790 +22%
3-31 25,602- +3,774 +17%
4-1 26,433 +837 +3%
4-2 29,517 +3,072 +12%
4-3 32,420 +2,723 +9%
4-4 34,285 +1,865 +6%
Total cases 312,481 It took 5.6 days to double to this cumulative total. The previous doubling took around 3.5 days. The doubling prior to that took 3 days. .............a clear slowing in the rate of increase.
Let's wild guess 1,200,000 total infections for the end of April and 30,000 deaths.
Thursday: Maintaining close to the recent average. It took around 5 days to double the number of new cases to today's total.
Friday: Close to the same rate this week which is a bit less than last weeks rate.
Saturday: We slowed down just before this week, then have been stalled out. The next move will be LOWER.......starting anytime. The blues on the 2nd map below are a leading indicator and tell us that will happen with certainty.....and soon.
Cutworm : the current rate is 1.0592
Info For these charts gleaned from https://www.worldometers.info/coronavirus/country/us/
The end date is 4-4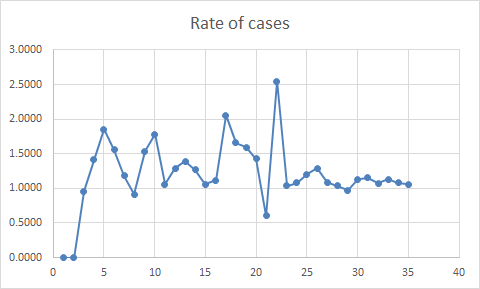
I posted last month that if the doubling continued at the then rate of every 3 days ( a little conservative, it's my nature) that we could have 76,800 cases on 3-31. https://marketforum.com/forum/topic/48953/ At the time a seemingly high number. We had 163,844. So the doubling was less than 3 days.
Now as Mike says, " It took 5.6 days to double to this cumulative total.* The previous doubling took around 3.5 days. The doubling prior to that took 3 days. .............a clear slowing in the rate of increase.
foot note:* ( the last doubling as of 4-4)
The doubling info for 3 day doubling starting 3-1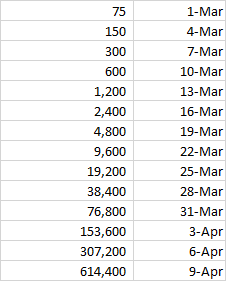
Thank you again VERY VERY much cutworm!
Sunday: The doubling rate is around 5.6 days right now. Massive drop today. Last Sunday featured a drop too, so it might be related to being Sunday. I look for an adjustment this week but the writing is on the wall.........daily infections numbers will be going down with increasing frequency for the rest of the month(not every day but we've turned the corner.
https://coronavirus.1point3acres.com/en
Date New Cases+/-change in new cases vs yesterday %change in new cases
3-3 21
3-4 31+10
3-5 75+46
3-6 99+24
3-7 116+17
3-8 121+5
3-9 179+58
3-10 290+111
3-11 247-43
3-12 425+178
3-13 528+103
3-14 732+204
3-15 710-22
% Increase in daily rate vs previous day this week(with increased testing-this number will go lower as first indicator of slow down)
3-16 968+264 +37%
3-17 1,451+483 +50%
3-18 2,566+1,112 +77%
3-19 5,424+2858 +111%
3-20 5,489+65 +1%
3-21 7,172+1,683 +30%
3-22 8,337+1165 +16%
3-23 9,740+1,403+17% previous 11,045+2,711 +33%
3-24 10,523 +783 +8% previous 9,216 -2,029 -18%
3-25 13,892 +3,369 +33% previous 13,993 +4,777 +52%
3-26 16,755 +2,863 +21%
3-27 18,747 +2,101 +12%
3-28 19,723 +1,039+4%
3-29 17,941 -1,853 -9% -odd update previous 19,324 -444 -2%
3-30 21,809 +3,790 +22%
3-31 25,602- +3,774 +17%
4-1 26,433 +837 +3%
4-2 29,517 +3,072 +12%
4-3 32,420 +2,723 +9%
4-4 34,135 +1,865 +6%
4-5 25,630 -8,505 -25%
Total cases 337,938 It took 5.6 days to double to this cumulative total. The previous doubling took around 3.5 days. The doubling prior to that took 3 days. .............a clear slowing in the rate of increase.
Let's wild guess 1,200,000 total infections for the end of April and 30,000 deaths.
Thursday: Maintaining close to the recent average. It took around 5 days to double the number of new cases to today's total.
Friday: Close to the same rate this week which is a bit less than last weeks rate.
Saturday: We slowed down just before this week, then have been stalled out. The next move will be LOWER.......starting anytime. The blues on the 2nd map below are a leading indicator and tell us that will happen with certainty.....and soon.
Sunday: Rate today looks lower. May be the start of drops ahead and better news.
We have a reliable leading indicator that is often 2 weeks ahead of the daily infection reports which is providing powerful evidence that the current rate of new numbers of people with the flu/coronavirus.....measured in real time has been falling for awhile even as new cases and delayed test results have continued to show an increase because they are LAGGING indicators).
https://www.marketforum.com/forum/topic/49867/
Cutworm: Finally we have a day below 1with a rate of .7403 and the moving avg of 1.016. Social Dis. is starting to have an effect.

Info For these charts gleaned from https://www.worldometers.info/coronavirus/country/us/
The end date is 4-5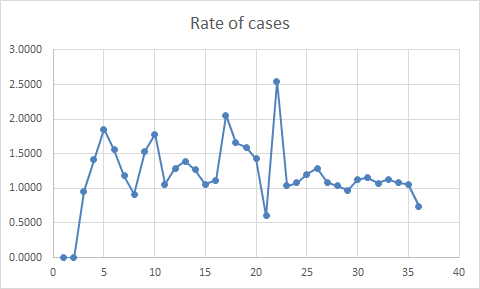
Thank you again VERY VERY much cutworm!
Sunday: The doubling rate is around 5.6 days right now. Massive drop today. Last Sunday featured a drop too, so it might be related to being Sunday. I look for an adjustment this week but the writing is on the wall.........daily infections numbers will be going down with increasing frequency for the rest of the month(not every day but we've turned the corner.
Monday: I would not be surprised if we had a couple of modest up days compared to the previous day this week but we are not just decelerating with our rate of increase, we are now going to see the daily rates LOWER than the peak and falling much of the time thru the rest of the month. Yesterday, being a Sunday makes the data suspect as being too low...........so we let the next few days confirm it.
https://coronavirus.1point3acres.com/en
Date New Cases+/-change in new cases vs yesterday %change in new cases
3-3 21
3-4 31+10
3-5 75+46
3-6 99+24
3-7 116+17
3-8 121+5
3-9 179+58
3-10 290+111
3-11 247-43
3-12 425+178
3-13 528+103
3-14 732+204
3-15 710-22
% Increase in daily rate vs previous day this week(with increased testing-this number will go lower as first indicator of slow down)
3-16 968+264 +37%
3-17 1,451+483 +50%
3-18 2,566+1,112 +77%
3-19 5,424+2858 +111%
3-20 5,489+65 +1%
3-21 7,172+1,683 +30%
3-22 8,337+1165 +16%
3-23 9,740+1,403+17% previous 11,045+2,711 +33%
3-24 10,523 +783 +8% previous 9,216 -2,029 -18%
3-25 13,892 +3,369 +33% previous 13,993 +4,777 +52%
3-26 16,755 +2,863 +21%
3-27 18,747 +2,101 +12%
3-28 19,723 +1,039+4%
3-29 17,941 -1,853 -9% -odd update previous 19,324 -444 -2%
3-30 21,809 +3,790 +22%
3-31 25,602- +3,774 +17%
4-1 26,433 +837 +3%
4-2 29,517 +3,072 +12%
4-3 32,420 +2,723 +9%
4-4 34,135 +1,865 +6%
4-5 25,715 -8,505 -25%
4-6 30,324 +4,694 +18% A bounce higher like this was predicted because the Sun number was too low. Still below Sat and Fri increases though. We can't surge above 35,000 the next couple of days or it will negate my interpretation of the top being in for daily infection rates.
Total cases 347,016 The doubling rate is now over 6 days. The previous doubling took around 3.5 days. The doubling prior to that took 3 days. .............a clear slowing that has shifted to a falling.
Monday, Let's get ready to adjust downward, the wild guess 1,200,000 total infections for the end of April and 30,000 deaths. We've hit the peak but lets wait for a couple more data points after Sunday's drop exceeded even my expectations and was possibly excessive based on data chaos(and Sunday).
last Thursday: Maintaining close to the recent average. It took around 5 days to double the number of new cases to today's total.
Friday: Close to the same rate this week which is a bit less than last weeks rate.
Saturday: We slowed down just before this week, then have been stalled out. The next move will be LOWER.......starting anytime. The blues on the 2nd map below are a leading indicator and tell us that will happen with certainty.....and soon.
Sunday: Rate today looks lower. May be the start of drops ahead and better news.
We have a reliable leading indicator that is often 2 weeks ahead of the daily infection reports which is providing powerful evidence that the current rate of new numbers of people with the flu/coronavirus.....measured in real time has been falling for awhile even as new cases and delayed test results have continued to show an increase because they are LAGGING indicators).
https://www.marketforum.com/forum/topic/49867/
metmike:
The top map shows the current conditions compared to average for this date. It clearly identifies the red hot spots where a lot of people are sick from the flu or COVID-19.
The 2nd map shows the trend for the last 7 days.
Blues on the map below show DECREASING fevers........for all illnesses.
In the previous 4 years, this tracked closely with and accurately with the flu(and other illnesses with a fever). In 2020, it shows a combination of fevers from the flu, coronvirus and other illnesses. They have all been plunging lower during the 2nd half of March...............even while new CONFIRMED BY TEST cases of coronavirus are still going up.
This is because fevers are a LEADING indicator. People have a fever for a couple of days BEFORE they get medical attention. After they sought medical attention(before tests were widely available recently), they then could be tested. The test results sometimes took over a week to come back. So their fevers were first reported on the maps below, in many cases well over a week before they showed up as a new coronavirus case.
https://healthweather.us/?mode=Trends
.png)
_Ydt8hr0.png)
.png)
Info For these charts gleaned from https://www.worldometers.info/coronavirus/country/us/
The end date is 4-6
Cutworm : It appears that Mike is right that Sundays #'s have a reporting glitch. The #'s are higher for Monday But if you average Monday and Sunday together we get a rate of .9692 below the magic number of 1. The 5 day average still not below 1 and is at 1.041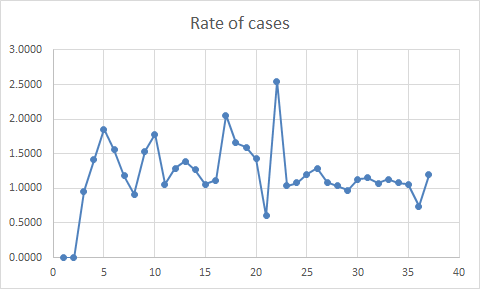
Thank you again VERY VERY much cutworm!
Tuesday 4-7-: We suspected Sunday's number was much too low and Monday would not be as low. That happened. The key number was the top put in on Saturday, 34,000. If we have numbers exceeding that, then we have not topped.........but what would cause that? The leading indicator shows fevers have been plunging for 3 weeks. We are shut in and practicing social distancing. The tests are almost caught up. Seasonals, if a factor are negative for the virus. There is NOTHING to suggest that we will go higher(other than talking heads on tv) and everything to suggest we will go lower.
https://coronavirus.1point3acres.com/en
Date New Cases+/-change in new cases vs yesterday %change in new cases
3-3 21
3-4 31+10
3-5 75+46
3-6 99+24
3-7 116+17
3-8 121+5
3-9 179+58
3-10 290+111
3-11 247-43
3-12 425+178
3-13 528+103
3-14 732+204
3-15 710-22
% Increase in daily rate vs previous day this week(with increased testing-this number will go lower as first indicator of slow down)
3-16 965+258 +37%
3-17 1,454+489 +51%
3-18 2,645+1,191 +82%
3-19 5,437+2858 +108%
3-20 5,529+65 +1%
3-21 7,165+1,683 +23%
3-22 8,361+1165 +16%
3-23 9,828 +1,403 +17% previous 11,045+2,711 +33%
3-24 10,590 +783 +8% previous 9,216 -2,029 -18%
3-25 13,984 +3,369 +32% previous 13,993 +4,777 +52%
3-26 16,905 +2,863 +20%
3-27 18,780 +2,101 +12%
3-28 20,028 +1,039 +5%
3-29 17,989 -1,853 -9% -odd update previous 19,324 -444 -2%
3-30 21,844 +3,790 +21%
3-31 25,747- +3,774 +17%
4-1 26,555 +837 +3%
4-2 29,709 +3,072 +12%
4-3 32,577 +2,723 +9%
4-4 34,129 +1,865 +6%
4-5 25,713 -8,505 -25%
4-6 31,219 +4,694 +18%
4-7 31,517 +298 +1%
Total cases 402,347 The doubling rate will be around 6 days tomorrow.
Sunday am: Rate today looks lower. May be the start of drops ahead and better news. Saturday was likely the top.
++++++++++++++++++++++++++++++++++
Monday: Let's get ready to adjust downward, the wild guess 1,200,000 total infections for the end of April and 30,000 deaths. We've hit the peak but lets wait for a couple more data points after Sunday's drop exceeded even my expectations and was possibly excessive based on data chaos(and Sunday). ++++++++++++++++++++++++++++++++++++++++++++++++
Tuesday: Still looks like Saturday was the top/peak for positive tests. We can't surge above 35,000 the next couple of days or it will negate my interpretation of the top being in for daily infection rates. Deaths spiked to 1,906 today, a new high. This was exactly as expected for the longest lagging/end of the line indicator that has not quite topped yet.
+++++++++++++++++++++++++++++++++++++++++++++++++++++++++++++++
We have a reliable leading indicator that is often 2 weeks ahead of the daily infection reports which is providing powerful evidence that the current rate of new numbers of people with the flu/coronavirus.....measured in real time has been falling for awhile even as new cases and delayed test results have continued to show an increase because they are LAGGING indicators).
https://www.marketforum.com/forum/topic/49867/
metmike:
The top map shows the current conditions compared to average for this date. It clearly identifies the red hot spots where a lot of people are sick from the flu or COVID-19.
The 2nd map shows the trend for the last 7 days.
Blues on the map below show DECREASING fevers........for all illnesses.
In the previous 4 years, this tracked closely with and accurately with the flu(and other illnesses with a fever). In 2020, it shows a combination of fevers from the flu, coronvirus and other illnesses. They have all been plunging lower during the 2nd half of March...............even while new CONFIRMED BY TEST cases of coronavirus are still going up.
This is because fevers are a LEADING indicator. People have a fever for a couple of days BEFORE they get medical attention. After they sought medical attention(before tests were widely available recently), they then could be tested. The test results sometimes took over a week to come back. So their fevers were first reported on the maps below, in many cases well over a week before they showed up as a new coronavirus case.
https://healthweather.us/?mode=Trends
.png)
.png)
Info For these charts gleaned from https://www.worldometers.info/coronavirus/country/us/
The end date is 4-7.
Current rate 1.0996

Thank you again VERY VERY much cutworm!
Tuesday 4-7-: We suspected Sunday's number was much too low and Monday would not be as low. That happened. The key number was the top put in on Saturday, 34,000. If we have numbers exceeding that, then we have not topped.........but what would cause that? The leading indicator shows fevers have been plunging for 3 weeks. We are shut in and practicing social distancing. The tests are almost caught up. Seasonals, if a factor are negative for the virus. There is NOTHING to suggest that we will go higher(other than talking heads on tv) and everything to suggest we will go lower.
https://coronavirus.1point3acres.com/en
Date New Cases+/-change in new cases vs yesterday %change in new cases
3-3 21
3-4 31+10
3-5 75+46
3-6 99+24
3-7 116+17
3-8 121+5
3-9 179+58
3-10 290+111
3-11 247-43
3-12 425+178
3-13 528+103
3-14 732+204
3-15 710-22
% Increase in daily rate vs previous day this week(with increased testing-this number will go lower as first indicator of slow down)
3-16 965+258 +37%
3-17 1,454+489 +51%
3-18 2,645+1,191 +82%
3-19 5,437+2858 +108%
3-20 5,529+65 +1%
3-21 7,165+1,683 +23%
3-22 8,361+1165 +16%
3-23 9,828 +1,403 +17% previous 11,045+2,711 +33%
3-24 10,590 +783 +8% previous 9,216 -2,029 -18%
3-25 13,984 +3,369 +32% previous 13,993 +4,777 +52%
3-26 16,905 +2,863 +20%
3-27 18,780 +2,101 +12%
3-28 20,028 +1,039 +5%
3-29 17,989 -1,853 -9% -odd update previous 19,324 -444 -2%
3-30 21,844 +3,790 +21%
3-31 25,747- +3,774 +17%
4-1 26,555 +837 +3%
4-2 29,709 +3,072 +12%
4-3 32,577 +2,723 +9%
4-4 34,129 +1,865 +6%
4-5 25,713 -8,505 -25%
4-6 31,219 +4,694 +18%
4-7 31,517 +298 +1%
4-8 32,890 +1,373 +4%
Total cases 435,553 The doubling rate is around 6 days.
Sunday am: Rate today looks lower. May be the start of drops ahead and better news. Saturday was likely the top.
++++++++++++++++++++++++++++++++++
Monday: Let's get ready to adjust downward, the wild guess 1,200,000 total infections for the end of April and 30,000 deaths. We've hit the peak but lets wait for a couple more data points after Sunday's drop exceeded even my expectations and was possibly excessive based on data chaos(and Sunday). ++++++++++++++++++++++++++++++++++++++++++++++++
Tuesday: Still looks like Saturday was the top/peak for positive tests. We can't surge above 35,000 the next couple of days or it will negate my interpretation of the top being in for daily infection rates. Deaths spiked to 1,906 today, a new high. This was exactly as expected for the longest lagging/end of the line indicator that has not quite topped yet.
+++++++++++++++++++++++++++++++++++++++++++++
Wednesday: still below the highs on Saturday but remaining elevated.
++++++++++++++++
We have a reliable leading indicator that is often 2 weeks ahead of the daily infection reports which is providing powerful evidence that the current rate of new numbers of people with the flu/coronavirus.....measured in real time has been falling for awhile even as new cases and delayed test results have continued to show an increase because they are LAGGING indicators).
https://www.marketforum.com/forum/topic/49867/
Info For these charts gleaned from https://www.worldometers.info/coronavirus/country/us/
The end date is 4-8.
Current rate 1.0366 5 day moving average 1.027 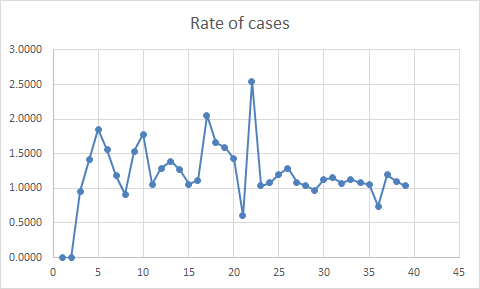
Thank you again VERY VERY much cutworm!
Tuesday 4-7-: We suspected Sunday's number was much too low and Monday would not be as low. That happened. The key number was the top put in on Saturday, 34,000. If we have numbers exceeding that, then we have not topped.........but what would cause that? The leading indicator shows fevers have been plunging for 3 weeks. We are shut in and practicing social distancing. The tests are almost caught up. Seasonals, if a factor are negative for the virus. There is NOTHING to suggest that we will go higher(other than talking heads on tv) and everything to suggest we will go lower.
https://coronavirus.1point3acres.com/en
Date New Cases+/-change in new cases vs yesterday %change in new cases
3-3 21
3-4 31+10
3-5 75+46
3-6 99+24
3-7 116+17
3-8 121+5
3-9 179+58
3-10 290+111
3-11 247-43
3-12 425+178
3-13 528+103
3-14 732+204
3-15 710-22
% Increase in daily rate vs previous day this week(with increased testing-this number will go lower as first indicator of slow down)
3-16 965+258 +37%
3-17 1,454+489 +51%
3-18 2,645+1,191 +82%
3-19 5,437+2858 +108%
3-20 5,529+65 +1%
3-21 7,165+1,683 +23%
3-22 8,361+1165 +16%
3-23 9,828 +1,403 +17% previous 11,045+2,711 +33%
3-24 10,590 +783 +8% previous 9,216 -2,029 -18%
3-25 13,984 +3,369 +32% previous 13,993 +4,777 +52%
3-26 16,905 +2,863 +20%
3-27 18,780 +2,101 +12%
3-28 20,028 +1,039 +5%
3-29 17,989 -1,853 -9% -odd update previous 19,324 -444 -2%
3-30 21,844 +3,790 +21%
3-31 25,747- +3,774 +17%
4-1 26,555 +837 +3%
4-2 29,709 +3,072 +12%
4-3 32,577 +2,723 +9%
4-4 34,129 +1,865 +6%
4-5 25,713 -8,505 -25%
4-6 31,219 +4,694 +18%
4-7 31,517 +298 +1%
4-8 32,890 +1,373 +4%
4-9 33,658 +768 +2%
Total cases 469,727 The doubling rate is more than 7 days and getting longer every day. Deaths yesterday at 1,934 might have peaked.
Sunday am: Rate today looks lower. May be the start of drops ahead and better news. Saturday was likely the top.
++++++++++++++++++++++++++++++++++
Monday: Let's get ready to adjust downward, the wild guess 1,200,000 total infections for the end of April and 30,000 deaths. We've hit the peak but lets wait for a couple more data points after Sunday's drop exceeded even my expectations and was possibly excessive based on data chaos(and Sunday). ++++++++++++++++++++++++++++++++++++++++++++++++
Tuesday: Still looks like Saturday was the top/peak for positive tests. We can't surge above 35,000 the next couple of days or it will negate my interpretation of the top being in for daily infection rates. Deaths spiked to 1,906 today, a new high. This was exactly as expected for the longest lagging/end of the line indicator that has not quite topped yet.
+++++++++++++++++++++++++++++++++++++++++++++
Wednesday: still below the highs on Saturday but remaining elevated.
++++++++++++++++
Thursday: Highs are still in.
+++++++++++++++++++++++++++++++++++++++++
We have a reliable leading indicator that is often 2 weeks ahead of the daily infection reports which is providing powerful evidence that the current rate of new numbers of people with the flu/coronavirus.....measured in real time has been falling for awhile even as new cases and delayed test results WERE showing an increase because they are LAGGING indicators).
https://www.marketforum.com/forum/topic/49867/
metmike:
The top map shows the current conditions compared to average for this date. It clearly identifies the red hot spots where a lot of people are sick from the flu or COVID-19.
The 2nd map shows the trend for the last 7 days.
Blues on the map below show DECREASING fevers........for all illnesses.
In the previous 4 years, this tracked closely with and accurately with the flu(and other illnesses with a fever). In 2020, it shows a combination of fevers from the flu, coronvirus and other illnesses. They have all been plunging lower during the 2nd half of March...............even while new CONFIRMED BY TEST cases of coronavirus are still going up.
This is because fevers are a LEADING indicator. People have a fever for a couple of days BEFORE they get medical attention. After they sought medical attention(before tests were widely available recently), they then could be tested. The test results sometimes took over a week to come back. So their fevers were first reported on the maps below, in many cases well over a week before they showed up as a new coronavirus case.
https://healthweather.us/?mode=Trends
.png)
.png)
1st of all Mike I want to thank you for the incredible amount of work and time you have spent on this thread. This is a must read thread every day for me and I am sure a lot of other folks also. So kudos to you and many thanks although I expect this is bit early, as you will probably continue for some time on this thread
Now the panic you said would become less and then what happens next
You know my thoughts are a depression, developing over time, but I could be wrong, as I have many times before and this time I would gladly accept being wrong. I think a lot of things will happen before we fall into depression but that is just my opinion and not worth much
What I am trying to do is figure out what happens as the economy opens up and we come out of lock down. Some states never went into lock down, so do they re-cover more quickly. What will recovery look like. Where will the stk market be a yr from today. What will the unemployment numbers look like. Some are saying the reserve dollar is in decline and a short time [less than 10 yrs] the reserve dollar will no longer be the reserve dollar. Where will the USD go in a yr, two, five. What about the dollar shortage. Will there be too many US dollars in 5 yrs. Will we be so dependant on china for imports or will we make our medical supplies domestically. Will the Fed buy actual stks and we end up with some Co's effectively nationalized. Will people vote for socialism as we want a larger minimum income for everybody, with no work or a retirement fund that was destroyed. Will the voters want more money, from Uncle Sam, deposited directly into your bank account, as the jobs aren't to be had and wages go down. Is direct deposit acceptable because so many do not have a bank account and don't dare get one as you need I.D which they don't have legal I.D. What will taxes be, the deficit, int rates
Everybody has an opinion. I would like to meet the person who can look into the future because I will say that person is so full of it, including my prediction of a depression. I don't know up from down
And finally, how long before it is socially acceptable to shake hands with somebody
Info For these charts gleaned from https://www.worldometers.info/coronavirus/country/us/
The end date is 4-9.
Current rate 0.9730 5 day moving average 1.010 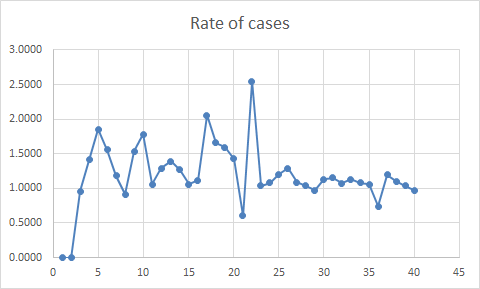

Thank you again VERY VERY much cutworm! And Wayne for the great comments!
Friday: Numbers have crept higher this week and we are now barely above last Saturdays high. We should be falling for good any time now but we will follow the data, including data from the Kinsa maps. It's hard to imagine, with the current shut ins, that all numbers will not be dropping hard later this month. Forget the accuracy(lack of it) for models, except for a general trend from previous model run. They are a very lagging indicator and you can't use mathematical equations to model human behavior and your initial assumptions about a never before experienced virus are speculative.
https://coronavirus.1point3acres.com/en
Date New Cases+/-change in new cases vs yesterday %change in new cases
3-3 21
3-4 31+10
3-5 75+46
3-6 99+24
3-7 116+17
3-8 121+5
3-9 179+58
3-10 290+111
3-11 247-43
3-12 425+178
3-13 528+103
3-14 732+204
3-15 710-22
% Increase in daily rate vs previous day this week(with increased testing-this number will go lower as first indicator of slow down)
3-16 965+258 +37%
3-17 1,454+489 +51%
3-18 2,645+1,191 +82%
3-19 5,437+2858 +108%
3-20 5,529+65 +1%
3-21 7,165+1,683 +23%
3-22 8,361+1165 +16%
3-23 9,828 +1,403 +17% previous 11,045+2,711 +33%
3-24 10,590 +783 +8% previous 9,216 -2,029 -18%
3-25 13,984 +3,369 +32% previous 13,993 +4,777 +52%
3-26 16,905 +2,863 +20%
3-27 18,780 +2,101 +12%
3-28 20,028 +1,039 +5%
3-29 17,989 -1,853 -9% -odd update previous 19,324 -444 -2%
3-30 21,844 +3,790 +21%
3-31 25,747- +3,774 +17%
4-1 26,558 +837 +3%
4-2 29,738 +3,180 +12%
4-3 32,592 +2,754 +9%
4-4 34,126 +1,534 +6%
4-5 25,796 -8,330 -25%
4-6 31,185 +5,389 +21%
4-7 31,676 +491 +2%
4-8 32,992 +1,316 +4%
4-9 34,254 +1,262 +4% adjustment they made Fri makes this barely a new high with Saturday
4-10 35,977 +1,723 +5% New high for new daily cases
Total cases 505,876 The doubling rate is more than 7 days and getting longer every day. Deaths Friday set a new high of 2,102.
Sunday am: Rate today looks lower. May be the start of drops ahead and better news. Saturday was likely the top.
++++++++++++++++++++++++++++++++++
Monday: Let's get ready to adjust downward, the wild guess 1,200,000 total infections for the end of April and 30,000 deaths. We've hit the peak but lets wait for a couple more data points after Sunday's drop exceeded even my expectations and was possibly excessive based on data chaos(and Sunday). ++++++++++++++++++++++++++++++++++++++++++++++++
Tuesday: Still looks like Saturday was the top/peak for positive tests. We can't surge above 35,000 the next couple of days or it will negate my interpretation of the top being in for daily infection rates. Deaths spiked to 1,906 today, a new high. This was exactly as expected for the longest lagging/end of the line indicator that has not quite topped yet.
+++++++++++++++++++++++++++++++++++++++++++++
Wednesday: still below the highs on Saturday but remaining elevated.
++++++++++++++++
Thursday: Highs are still in...........ok, not quite, revision of data Fri makes Thu the new highest by a smidgen.
Friday: New cases have NOT started to drop this week as speculated. However, we are still just above the level of last Saturday, so we have at least leveled off. I'm surprised that we're not dropping here. Maybe the testing needed to catch up more.
+++++++++++++++++++++++++++++++++++++++++
We have a reliable leading indicator that is often 2 weeks ahead of the daily infection reports which is providing powerful evidence that the current rate of new numbers of people with the flu/coronavirus.....measured in real time has been falling for awhile even as new cases and delayed test results WERE showing an increase because they are LAGGING indicators).
https://www.marketforum.com/forum/topic/49867/
metmike:
The top map shows the current conditions compared to average for this date. It clearly identifies the red hot spots where a lot of people are sick from the flu or COVID-19.
The 2nd map shows the trend for the last 7 days.
Blues on the map below show DECREASING fevers........for all illnesses.
In the previous 4 years, this tracked closely with and accurately with the flu(and other illnesses with a fever). In 2020, it shows a combination of fevers from the flu, coronvirus and other illnesses. They have all been plunging lower during the 2nd half of March...............even while new CONFIRMED BY TEST cases of coronavirus are still going up.
This is because fevers are a LEADING indicator. People have a fever for a couple of days BEFORE they get medical attention. After they sought medical attention(before tests were widely available recently), they then could be tested. The test results sometimes took over a week to come back. So their fevers were first reported on the maps below, in many cases well over a week before they showed up as a new coronavirus case.
https://healthweather.us/?mode=Trends

.png)
.png)
Info For these charts gleaned from https://www.worldometers.info/coronavirus/country/us/
The end date is 4-10.
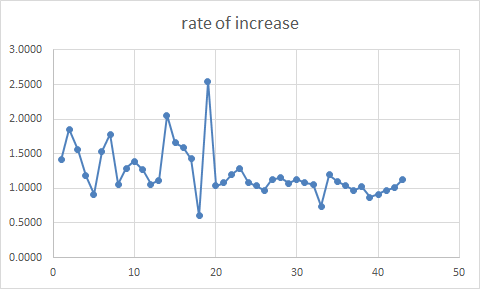
Current rate 1.0199 5 day moving average 1.065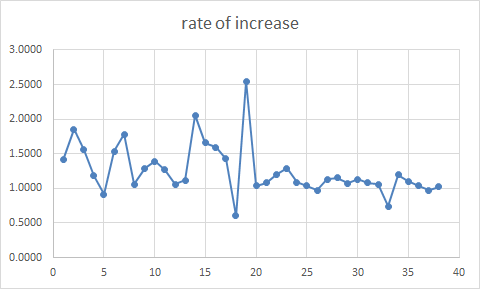
Thank you again VERY VERY much cutworm! And Wayne for the great comments!
Friday: Numbers have crept higher this week and we are now barely above last Saturdays high. We should be falling for good any time now but we will follow the data, including data from the Kinsa maps. It's hard to imagine, with the current shut ins, that all numbers will not be dropping hard later this month. Forget the accuracy(lack of it) for models, except for a general trend from previous model run. They are a very lagging indicator and you can't use mathematical equations to model human behavior and your initial assumptions about a never before experienced virus are speculative.
++++++++++++++
Saturday early: Cases may be way down the next 2 days because of Easter.
Final: Big drop today leaving a statistical triple top using technical analysis, 4-4, 4-9, 4-10.
+++++++++++++++++++++++++++++++
https://coronavirus.1point3acres.com/en
Date New Cases+/-change in new cases vs yesterday %change in new cases
3-3 21
3-4 31+10
3-5 75+46
3-6 99+24
3-7 116+17
3-8 121+5
3-9 179+58
3-10 290+111
3-11 247-43
3-12 425+178
3-13 528+103
3-14 732+204
3-15 710-22
% Increase in daily rate vs previous day this week(with increased testing-this number will go lower as first indicator of slow down)
3-16 965+258 +37%
3-17 1,454+489 +51%
3-18 2,645+1,191 +82%
3-19 5,437+2858 +108%
3-20 5,529+65 +1%
3-21 7,165+1,683 +23%
3-22 8,361+1165 +16%
3-23 9,828 +1,403 +17% previous 11,045+2,711 +33%
3-24 10,590 +783 +8% previous 9,216 -2,029 -18%
3-25 13,984 +3,369 +32% previous 13,993 +4,777 +52%
3-26 16,905 +2,863 +20%
3-27 18,780 +2,101 +12%
3-28 20,028 +1,039 +5%
3-29 17,989 -1,853 -9% -odd update previous 19,324 -444 -2%
3-30 21,844 +3,790 +21%
3-31 25,747- +3,774 +17%
4-1 26,558 +837 +3%
4-2 29,738 +3,180 +12%
4-3 32,592 +2,754 +9%
4-4 34,126 +1,534 +6%
4-5 25,796 -8,330 -25%
4-6 31,185 +5,389 +21%
4-7 31,676 +491 +2%
4-8 32,992 +1,316 +4%
4-9 34,253 +1,261 +4% adjustment they made Fri makes this barely a new high with Saturday
4-10 34,416 +155 +0% -1,537 downward adjustment they made Sat. makes this a statistical triple top!
4-11 29,997 -4,419 -13%
Total cases 534,308 Deaths Friday set a new high of 2,102. Doubling rate more than 8 days after today. They just adjusted Friday -1,537 which causes a statistical triple top 4-4, 4-9, 4-10.
Sunday am: Rate today looks lower. May be the start of drops ahead and better news. Saturday was likely the top.
++++++++++++++++++++++++++++++++++
Monday: Let's get ready to adjust downward, the wild guess 1,200,000 total infections for the end of April and 30,000 deaths. We've hit the peak but lets wait for a couple more data points after Sunday's drop exceeded even my expectations and was possibly excessive based on data chaos(and Sunday). ++++++++++++++++++++++++++++++++++++++++++++++++
Tuesday: Still looks like Saturday was the top/peak for positive tests. We can't surge above 35,000 the next couple of days or it will negate my interpretation of the top being in for daily infection rates. Deaths spiked to 1,906 today, a new high. This was exactly as expected for the longest lagging/end of the line indicator that has not quite topped yet.
+++++++++++++++++++++++++++++++++++++++++++++
Wednesday: still below the highs on Saturday but remaining elevated.
++++++++++++++++
Thursday: Highs are still in...........ok, not quite, revision of data Fri makes Thu the new highest by a smidgen.
Friday: New cases have NOT started to drop this week as speculated. However, we are still just above the level of last Saturday, so we have at least leveled off. I'm surprised that we're not dropping here. Maybe the testing needed to catch up more.
+++++++++++++++++++++++++++++++++++++++++
Saturday: Cases may be way down the next 2 days because of Easter. They just adjusted yesterdays number down by 1,537..............strange but it means a statistical triple top technically with Thu and last Saturday. Much lower number today, maybe next week will continue on this path.
++++++++++++++++++++++++++++++++++++++++++++++++++++++++++++++++++++++
We have a reliable leading indicator that is often 2 weeks ahead of the daily infection reports which is providing powerful evidence that the current rate of new numbers of people with the flu/coronavirus.....measured in real time has been falling for awhile even as new cases and delayed test results WERE showing an increase because they are LAGGING indicators).
https://www.marketforum.com/forum/topic/49867/
Info For these charts gleaned from https://www.worldometers.info/coronavirus/country/us/
The end date is 4-11.
Current rate 0.8745 5 day moving average 1.001
Cutworm: The numbers for the last 2 Saturdays has been suspect low. It may be a glitch in reporting. As that may be the current rate and the 5 day average are on a down slop and if we can get the 5 day average below 1(it's very close) would indicate that the inflection point is past. JMHO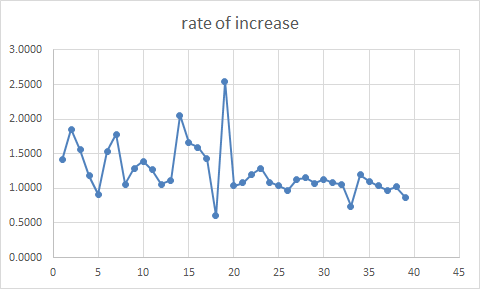

Thanks very much cutworm!
Actually, last Saturday set the high and it was last SUNDAY that had the outlier low, spike down number that I've been pointing out as an aberration since then.
With this being Easter, I don't think today's number will be very useful. I also speculated a couple of days ago that yesterday might be down some from being Easter Saturday............though totally expecting drops and wanting to believe them vs interpreting them objectively with skeptical science reasoning. Only next weeks readings will confirm lower Easter weekend numbers. I really think they will (this time) based on the facts(Kinsa data, shut downs and peak signals from CDC data) but thought that would happen last week too. I can speculate that since we are still ramping up the testing, that a higher % of people getting tested than before, continued to increase the daily infection numbers a bit more than previously.
https://coronavirus.1point3acres.com/en
Date New Cases+/-change in new cases vs yesterday %change in new cases
3-3 21
3-4 31+10
3-5 75+46
3-6 99+24
3-7 116+17
3-8 121+5
3-9 179+58
3-10 290+111
3-11 247-43
3-12 425+178
3-13 528+103
3-14 732+204
3-15 710-22
% Increase in daily rate vs previous day this week(with increased testing-this number will go lower as first indicator of slow down)
3-16 965+258 +37%
3-17 1,454+489 +51%
3-18 2,645+1,191 +82%
3-19 5,437+2858 +108%
3-20 5,529+65 +1%
3-21 7,165+1,683 +23%
3-22 8,361+1165 +16%
3-23 9,828 +1,403 +17% previous 11,045+2,711 +33%
3-24 10,590 +783 +8% previous 9,216 -2,029 -18%
3-25 13,984 +3,369 +32% previous 13,993 +4,777 +52%
3-26 16,905 +2,863 +20%
3-27 18,780 +2,101 +12%
3-28 20,028 +1,039 +5%
3-29 17,989 -1,853 -9% -odd update previous 19,324 -444 -2%
3-30 21,844 +3,790 +21%
3-31 25,747- +3,774 +17%
4-1 26,558 +837 +3%
4-2 29,738 +3,180 +12%
4-3 32,592 +2,754 +9%
4-4 34,126 +1,534 +6%
4-5 25,796 -8,330 -25%
4-6 31,185 +5,389 +21%
4-7 31,676 +491 +2%
4-8 32,989 +1,313 +4%
4-9 34,408 +1,419 +4% adjustment they made Fri makes this barely a new high with Saturday
4-10 34,244 +164 +0% -1,537 downward adjustment they made Sat. makes this a statistical triple top!
4-11 30,140 -4,104 -12%
4-12 27,745 -2,395 -8%
4-13 11,597-12:47p
Total cases 573,8000
Deaths Friday set a new high of 2,102. Doubling rate is 9 days. A statistical triple top 4-4, 4-9, 4-10 for new cases at just over 34,000 on all 3 days.
Last Sunday am: Rate today looks lower. May be the start of drops ahead and better news. Saturday was likely the top.
++++++++++++++++++++++++++++++++++
Monday: Let's get ready to adjust downward, the wild guess 1,200,000 total infections for the end of April and 30,000 deaths. We've hit the peak but lets wait for a couple more data points after Sunday's drop exceeded even my expectations and was possibly excessive based on data chaos(and Sunday). ++++++++++++++++++++++++++++++++++++++++++++++++
Tuesday: Still looks like Saturday was the top/peak for positive tests. We can't surge above 35,000 the next couple of days or it will negate my interpretation of the top being in for daily infection rates. Deaths spiked to 1,906 today, a new high. This was exactly as expected for the longest lagging/end of the line indicator that has not quite topped yet.
+++++++++++++++++++++++++++++++++++++++++++++
Wednesday: still below the highs on Saturday but remaining elevated.
++++++++++++++++
Thursday: Highs are still in...........ok, not quite, revision of data Fri makes Thu the new highest by a smidgen.
Friday: New cases have NOT started to drop this week as speculated. However, we are still just above the level of last Saturday, so we have at least leveled off. I'm surprised that we're not dropping here. Maybe the testing needed to catch up more.
+++++++++++++++++++++++++++++++++++++++++
Saturday: AM: Cases may be way down the next 2 days because of Easter. They just adjusted yesterdays number down by 1,537..............strange but it means a statistical triple top technically with Thu and last Saturday. Much lower number today, maybe next week will continue on this path.
++++++++++++++++++++++++++++++++++++++++++++++++++++++++++++++++++++++
Sunday: Another drop lower but some of it could be because its Sunday/Easter.
+++++++++++++++++++++++++++++++++++++++++++++
We have a reliable leading indicator that is often 2 weeks ahead of the daily infection reports which is providing powerful evidence that the current rate of new numbers of people with the flu/coronavirus.....measured in real time has been falling for awhile even as new cases and delayed test results WERE showing an increase because they are LAGGING indicators).
https://www.marketforum.com/forum/topic/49867/
Info For these charts gleaned from https://www.worldometers.info/coronavirus/country/us/
The end date is 4-12.
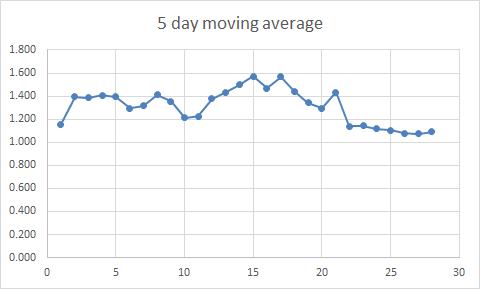
Current rate .09139 5 day moving average .0964 Both numbers below 1 the inflection point. Still not sure about the weekend numbers until we see Mondays numbers. Still we have a good down trend in the rate.

cutworm, (good suggestion)
At your request, I have moved Wayne and Larry's posts to the appropriate thread below, as this one is intended to discuss data and not politics, those were about politics.
I left Wayne's post up at this thread because it discussed this specific thread and was not political.
I'm sure that Wayne and Larry agree, right guys?
Thanks
metmike
I getting a bit angry when I see a bully
6 responses |
Started by wglassfo - April 12, 2020, 12:22 p.m.
Thanks very much cutworm!
Actually, last Saturday 4-4-20 set the high and it was last SUNDAY 4-5-20 that had the outlier low, spike down number that I've been pointing out as an aberration since then.
With this being Easter, I don't think today's number will be very useful. I also speculated a couple of days ago that yesterday might be down some from being Easter Saturday............though totally expecting drops and wanting to believe them vs interpreting them objectively with skeptical science reasoning. Only next weeks readings will confirm lower Easter weekend numbers. I really think they will (this time) based on the facts(Kinsa data, shut downs and peak signals from CDC data) but thought that would happen last week too. I can speculate that since we are still ramping up the testing, that a higher % of people getting tested than before, continued to increase the daily infection numbers a bit more than previously.
https://coronavirus.1point3acres.com/en
Date New Cases+/-change in new cases vs yesterday %change in new cases
3-3 21
3-4 31+10
3-5 75+46
3-6 99+24
3-7 116+17
3-8 121+5
3-9 179+58
3-10 290+111
3-11 247-43
3-12 425+178
3-13 528+103
3-14 732+204
3-15 710-22
% Increase in daily rate vs previous day this week(with increased testing-this number will go lower as first indicator of slow down)
3-16 965+258 +37%
3-17 1,454+489 +51%
3-18 2,645+1,191 +82%
3-19 5,437+2858 +108%
3-20 5,529+65 +1%
3-21 7,165+1,683 +23%
3-22 8,361+1165 +16%
3-23 9,828 +1,403 +17% previous 11,045+2,711 +33%
3-24 10,590 +783 +8% previous 9,216 -2,029 -18%
3-25 13,984 +3,369 +32% previous 13,993 +4,777 +52%
3-26 16,905 +2,863 +20%
3-27 18,780 +2,101 +12%
3-28 20,028 +1,039 +5%
3-29 17,989 -1,853 -9% -odd update previous 19,324 -444 -2%
3-30 21,844 +3,790 +21%
3-31 25,747- +3,774 +17%
4-1 26,558 +837 +3%
4-2 29,738 +3,180 +12%
4-3 32,592 +2,754 +9%
4-4 34,126 +1,534 +6%
4-5 25,796 -8,330 -25%
4-6 31,185 +5,389 +21%
4-7 31,676 +491 +2%
4-8 32,989 +1,313 +4%
4-9 34,408 +1,419 +4% adjustment they made Fri makes this barely a new high with Saturday
4-10 34,244 +164 +0% -1,537 downward adjustment they made Sat. makes this a statistical triple top!
4-11 30,108 -4,136 -12%
4-12 27,578 -2,530 -8%
4-13 26,415 -1,163 -4%
Total cases 588,309
Deaths Friday set a new high of 2,045. Doubling rate is 9 days. A statistical triple top 4-4, 4-9, 4-10 for new cases at just over 34,000 on all 3 days.
Last Sunday am: Rate today looks lower. May be the start of drops ahead and better news. Saturday was likely the top.
++++++++++++++++++++++++++++++++++
Monday: Let's get ready to adjust downward, the wild guess 1,200,000 total infections for the end of April and 30,000 deaths. We've hit the peak but lets wait for a couple more data points after Sunday's drop exceeded even my expectations and was possibly excessive based on data chaos(and Sunday). ++++++++++++++++++++++++++++++++++++++++++++++++
Tuesday: Still looks like Saturday was the top/peak for positive tests. We can't surge above 35,000 the next couple of days or it will negate my interpretation of the top being in for daily infection rates. Deaths spiked to 1,906 today, a new high. This was exactly as expected for the longest lagging/end of the line indicator that has not quite topped yet.
+++++++++++++++++++++++++++++++++++++++++++++
Wednesday: still below the highs on Saturday but remaining elevated.
++++++++++++++++
Thursday: Highs are still in...........ok, not quite, revision of data Fri makes Thu the new highest by a smidgen.
Friday: New cases have NOT started to drop this week as speculated. However, we are still just above the level of last Saturday, so we have at least leveled off. I'm surprised that we're not dropping here. Maybe the testing needed to catch up more.
+++++++++++++++++++++++++++++++++++++++++
Saturday: AM: Cases may be way down the next 2 days because of Easter. They just adjusted yesterdays number down by 1,537..............strange but it means a statistical triple top technically with Thu and last Saturday. Much lower number today, maybe next week will continue on this path.
++++++++++++++++++++++++++++++++++++++++++++++++++++++++++++++++++++++
Sunday: Another drop lower but some of it could be because its Sunday/Easter.
+++++++++++++++++++++++++++++++++++++++++++++
Monday: Ready now to adjust the estimate downward if numbers for new cases drop this week. Maybe total new cases at the end of the month will come in less than 1,100,000 with deaths close to 43,000
+++++++++++++++++++++++++++++++++++++++++++++++++++
We have a reliable leading indicator that is often 2 weeks ahead of the daily infection reports which is providing powerful evidence that the current rate of new numbers of people with the flu/coronavirus.....measured in real time has been falling for awhile even as new cases and delayed test results WERE showing an increase because they are LAGGING indicators).
https://www.marketforum.com/forum/topic/49867/
Info For these charts gleaned from https://www.worldometers.info/coronavirus/country/us/
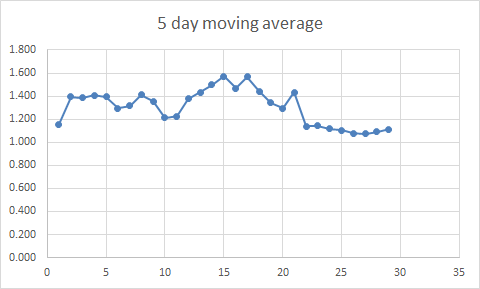
The end date is 4-114.
Current rate 0.9716 5 day moving average 0.951
Cutworm: The 5 day moving average chart is solidly below 1 The inflection point is past. 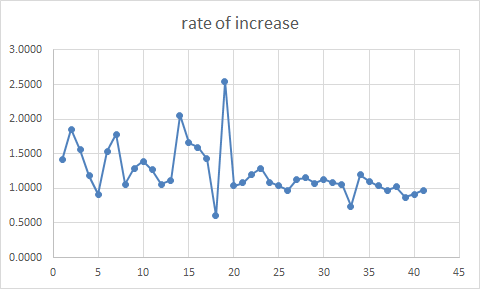

Thanks very much cutworm!
We make a great team!
Tuesday: New infection rate/positive tests peaked last week being strongly confirmed right now. Death rate,most lagging indicator is peaking this week. New high of 2,387 today.
https://coronavirus.1point3acres.com/en
Date New Cases+/-change in new cases vs yesterday
3-3 21
3-4 31+10
3-5 75+46
3-6 99+24
3-7 116+17
3-8 121+5
3-9 179+58
3-10 290+111
3-11 247-43
3-12 425+178
3-13 528+103
3-14 732+204
3-15 710-22
New cases +/- change
%change in new cases
3-16 965+258 +37%
3-17 1,454+489 +51%
3-18 2,645+1,191 +82%
3-19 5,437+2858 +108%
3-20 5,529+65 +1%
3-21 7,165+1,683 +23%
3-22 8,361+1165 +16%
3-23 9,828 +1,403 +17%
3-24 10,590 +783 +8%
3-25 13,984 +3,369 +32%
3-26 16,905 +2,863 +20%
3-27 18,780 +2,101 +12%
3-28 20,028 +1,039 +5%
3-29 17,989 -1,853 -9%
3-30 21,844 +3,790 +21%
3-31 25,747- +3,774 +17%
4-1 26,558 +837 +3%
4-2 29,738 +3,180 +12%
4-3 32,592 +2,754 +9%
4-4 34,126 +1,534 +6% High for daily number
4-5 25,796 -8,330 -25%
4-6 31,185 +5,389 +21%
4-7 31,676 +491 +2%
4-8 32,989 +1,313 +4%
4-9 34,408 +1,419 +4% Barely a new high with 4-4
4-10 34,244 +164 +0% Barley another new high for a triple top
4-11 30,108 -4,136 -12%
4-12 27,578 -2,530 -8%
4-13 26,415 -1,163 -4%
4-14 26,759 +344 +1%
Total cases 615,183
Deaths Friday set a new high of 2,045. Doubling rate more than 10 days. A statistical triple top occurred on 4-4, 4-9, 4-10 for new cases at just over 34,000 on all 3 days. Deaths today set a new high at 2,387. This metric, as expected is the last to peak.
Last Saturday: AM: Cases may be way down the next 2 days because of Easter. They just adjusted yesterdays number down by 1,537..............strange but it means a statistical triple top technically with Thu and last Saturday. Much lower number today, maybe next week will continue on this path.
++++++++++++++++++++++++++++++++++++++++++++++++++++++++++++++++++++++
Sunday: Another drop lower but some of it could be because its Sunday/Easter.
+++++++++++++++++++++++++++++++++++++++++++++
Monday: Ready now to adjust the estimate a tad downward for new cases but don't even take that # serious........we have over 2 weeks of data to change that number. Maybe total new cases at the end of the month will come in less than 1,100,000 with deaths close to 43,000(death rates have been pretty high-mostly old/sick people)
+++++++++++++++++++++++++++++++++++++++++++++++++++
Tuesday: New infection rate peaked last week being strongly confirmed right now. Death rate, most lagging indicator is peaking this week. New high of 2,387 today.
++++++++++++++++++++++++++++++++++++++++++++
We have a reliable leading indicator that is often 2 weeks ahead of the daily infection reports which is providing powerful evidence that the current rate of new numbers of people with the flu/coronavirus.....measured in real time has been falling for awhile even as new cases and delayed test results WERE showing an increase because they are LAGGING indicators).
https://www.marketforum.com/forum/topic/49867/
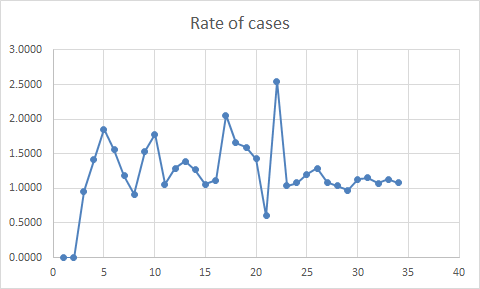
Info For these charts gleaned from https://www.worldometers.info/coronavirus/country/us/
The end date is 4-14.
Current rate 1.0114 5 day moving average 0.958

Thanks very much cutworm!
We make a great team!
https://coronavirus.1point3acres.com/en
Date New Cases+/-change in new cases vs yesterday
3-3 21
3-4 31+10
3-5 75+46
3-6 99+24
3-7 116+17
3-8 121+5
3-9 179+58
3-10 290+111
3-11 247-43
3-12 425+178
3-13 528+103
3-14 732+204
3-15 710-22
New cases +/- change %change in new cases
3-16 965+258 +37%
3-17 1,454+489 +51%
3-18 2,645+1,191 +82%
3-19 5,437+2858 +108%
3-20 5,529+65 +1%
3-21 7,165+1,683 +23%
3-22 8,361+1165 +16%
3-23 9,828 +1,403 +17%
3-24 10,590 +783 +8%
3-25 13,984 +3,369 +32%
3-26 16,905 +2,863 +20%
3-27 18,780 +2,101 +12%
3-28 20,028 +1,039 +5%
3-29 17,989 -1,853 -9%
3-30 21,844 +3,790 +21%
3-31 25,747- +3,774 +17%
4-1 26,558 +837 +3%
4-2 29,738 +3,180 +12%
4-3 32,592 +2,754 +9%
4-4 34,126 +1,534 +6% High for daily number
4-5 25,796 -8,330 -25%
4-6 31,185 +5,389 +21%
4-7 31,676 +491 +2%
4-8 32,989 +1,313 +4%
4-9 34,408 +1,419 +4% Barely a new high with 4-4
4-10 34,244 +164 +0% Barley another new high for a triple top
4-11 30,108 -4,136 -12%
4-12 27,578 -2,530 -8%
4-13 26,415 -1,163 -4%
4-14 26,759 +344 +1%
4-15 30,520 +3,761 +14% Not every day will drop after the top. A new high here, however would be an unpleasant surprise.
Total cases 645,325
Deaths Doubling rate more than 10 days. A statistical triple top occurred on 4-4, 4-9, 4-10 for new cases at just over 34,000 on all 3 days. Deaths today set a new daily high at 2,557. This metric, as expected is the last to peak.
+++++++++++++++++++++++++++++++++++++++++++++
Monday: Ready now to adjust the estimate a tad downward for new cases but don't even take that # serious........we have over 2 weeks of data to change that number. Maybe total new cases at the end of the month will come in less than 1,100,000 with deaths close to 43,000(death rates have been pretty high-mostly old/sick people)
+++++++++++++++++++++++++++++++++++++++++++++++++++
Tuesday: New infection rate peaked last week being strongly confirmed right now. Death rate, most lagging indicator is peaking this week. New high of 2,387 today.
++++++++++++++++++++++++++++++++++++++++++++
Wednesday: Up a bit......not every day will be lower after the top.
++++++++++++++++++++++++
We have a reliable leading indicator that is often 2 weeks ahead of the daily infection reports which is providing powerful evidence that the current rate of new numbers of people with the flu/coronavirus.....measured in real time has been falling for awhile even as new cases and delayed test results WERE showing an increase because they are LAGGING indicators).
https://www.marketforum.com/forum/topic/49867/
Info For these charts gleaned from https://www.worldometers.info/coronavirus/country/us/
The end date is 4-15.
Current rate 1.1209 5 day moving average 0.978
Cutworm: the 5 day average rate still below 1. The daily rate 2nd day slightly above 1and the highest since 4-2
Thanks very much Mike! It is great that we can freely exchange info gathered independently of each other!
We make a great team!
Thanks very much cutworm!
The first thing that I do in the morning is look to see what your graphs/data is showing. They provide valuable additional insight to help see the big picture.
https://coronavirus.1point3acres.com/en
Date New Cases+/-change in new cases vs yesterday
3-3 21
3-4 31+10
3-5 75+46
3-6 99+24
3-7 116+17
3-8 121+5
3-9 179+58
3-10 290+111
3-11 247-43
3-12 425+178
3-13 528+103
3-14 732+204
3-15 710-22
New cases +/- change %change in new cases
3-16 965+258 +37%
3-17 1,454+489 +51%
3-18 2,645+1,191 +82%
3-19 5,437+2858 +108%
3-20 5,529+65 +1%
3-21 7,165+1,683 +23%
3-22 8,361+1165 +16%
3-23 9,828 +1,403 +17%
3-24 10,590 +783 +8%
3-25 13,984 +3,369 +32%
3-26 16,905 +2,863 +20%
3-27 18,780 +2,101 +12%
3-28 20,028 +1,039 +5%
3-29 17,989 -1,853 -9%
3-30 21,844 +3,790 +21%
3-31 25,747- +3,774 +17%
4-1 26,558 +837 +3%
4-2 29,738 +3,180 +12%
4-3 32,592 +2,754 +9%
4-4 34,126 +1,534 +6% High for daily number
4-5 25,796 -8,330 -25%
4-6 31,185 +5,389 +21%
4-7 31,676 +491 +2%
4-8 32,989 +1,313 +4%
4-9 34,408 +1,419 +4% Barely a new high with 4-4
4-10 34,244 +164 +0% Barley another new high for a triple top
4-11 30,142 -4,102 -12%
4-12 27,532 -2,510 -8%
4-13 26,540 -992 -4%
4-14 26,506 -34 -0%
4-15 30,413 +3,907 +15% Not every day will drop after the top. A new high here, however would be an unpleasant surprise.
4-16 32,029 +1,616 +5% Bouncing higher after the extremely dry air mass hit. Is this from weather? https://www.marketforum.com/forum/topic/49391/
Total cases 677,918
Deaths Doubling rate more than 10 days. A statistical triple top occurred on 4-4, 4-9, 4-10 for new cases at just over 34,000 on all 3 days. Deaths Wednesday set a new daily high at 2,557. This metric, as expected is the last to peak.
+++++++++++++++++++++++++++++++++++++++++++++
Monday: Ready now to adjust the estimate a tad downward for new cases but don't even take that # serious........we have over 2 weeks of data to change that number. Maybe total new cases at the end of the month will come in less than 1,100,000 with deaths close to 43,000(death rates have been pretty high-mostly old/sick people)
+++++++++++++++++++++++++++++++++++++++++++++++++++
Tuesday: New infection rate peaked last week being strongly confirmed right now. Death rate, most lagging indicator is peaking this week. New high of 2,387 today.
++++++++++++++++++++++++++++++++++++++++++++
Wednesday: Up a bit......not every day will be lower after the top. Deaths 2,516-new high.
++++++++++++++++++++++++
Thursday: Did the cold, very dry air cause new cases to go higher here? https://www.marketforum.com/forum/topic/49391/
Edit: forgot to revise the deaths to 53,000 earlier this week. I've been just paying attention to new cases and not paying attention to deaths.
++++++++++++++++++++++++++++++++++++
We have a reliable leading indicator that is often 2 weeks ahead of the daily infection reports which is providing powerful evidence that the current rate of new numbers of people with the flu/coronavirus.....measured in real time has been falling for awhile even as new cases and delayed test results WERE showing an increase because they are LAGGING indicators).
https://www.marketforum.com/forum/topic/49867/
Info For these charts gleaned from https://www.worldometers.info/coronavirus/country/us/
The end date is 4-16.
Current rate 1.1085, 5 day moving average 1.025

Thanks very much cutworm!
https://coronavirus.1point3acres.com/en
Date New Cases+/-change in new cases vs yesterday
3-3 21
3-4 31+10
3-5 75+46
3-6 99+24
3-7 116+17
3-8 121+5
3-9 179+58
3-10 290+111
3-11 247-43
3-12 425+178
3-13 528+103
3-14 732+204
3-15 710-22
New cases +/- change %change in new cases
3-16 965+258 +37%
3-17 1,454+489 +51%
3-18 2,645+1,191 +82%
3-19 5,437+2858 +108%
3-20 5,529+65 +1%
3-21 7,165+1,683 +23%
3-22 8,361+1165 +16%
3-23 9,828 +1,403 +17%
3-24 10,590 +783 +8%
3-25 13,984 +3,369 +32%
3-26 16,905 +2,863 +20%
3-27 18,780 +2,101 +12%
3-28 20,028 +1,039 +5%
3-29 17,989 -1,853 -9%
3-30 21,844 +3,790 +21%
3-31 25,747- +3,774 +17%
4-1 26,558 +837 +3%
4-2 29,738 +3,180 +12%
4-3 32,592 +2,754 +9%
4-4 34,126 +1,534 +6% High for daily number
4-5 25,796 -8,330 -25%
4-6 31,185 +5,389 +21%
4-7 31,676 +491 +2%
4-8 32,989 +1,313 +4%
4-9 34,408 +1,419 +4% Barely a new high with 4-4
4-10 34,244 +164 +0% Barley another new high for a triple top
4-11 30,142 -4,102 -12%
4-12 27,532 -2,510 -8%
4-13 26,540 -992 -4%
4-14 26,506 -34 -0%
4-15 30,413 +3,907 +15% Not every day will drop after the top. A new high here, however would be an unpleasant surprise.
4-16 32,029 +1,616 +5% Bouncing higher after the extremely dry air mass hit. Is this from weather? https://www.marketforum.com/forum/topic/49391/
4-17 30,980 -1,049 -3%
Total cases 708,837
Doubling rate more than 11 days. A statistical triple top occurred on 4-4, 4-9, 4-10 for new cases at just over 34,000 on all 3 days. Deaths Wednesday set a new daily high at 2,557. This metric, as expected is the last to peak.
+++++++++++++++++++++++++++++++++++++++++++++
Monday: Ready now to adjust the estimate a tad downward for new cases but don't even take that # serious........we have over 2 weeks of data to change that number. Maybe total new cases at the end of the month will come in less than 1,100,000 with deaths close to 43,000(death rates have been pretty high-mostly old/sick people)
+++++++++++++++++++++++++++++++++++++++++++++++++++
Tuesday: New infection rate peaked last week being strongly confirmed right now. Death rate, most lagging indicator is peaking this week. New high of 2,387 today.
++++++++++++++++++++++++++++++++++++++++++++
Wednesday: Up a bit......not every day will be lower after the top. Deaths 2,516-new high.
++++++++++++++++++++++++
Thursday: Did the cold, very dry air cause new cases to go higher here? https://www.marketforum.com/forum/topic/49391/
Edit: forgot to revise the deaths to 53,000 earlier this week. I've been just paying attention to new cases and not paying attention to deaths.
++++++++++++++++++++++++++++++++++++
Friday: Highs are still in but this very dry air may have been good for the virus to survive longer.
+++++++++++++++++++++++++++++++++++++
We have a reliable leading indicator that is often 2 weeks ahead of the daily infection reports which is providing powerful evidence that the current rate of new numbers of people with the flu/coronavirus.....measured in real time has been falling for awhile even as new cases and delayed test results WERE showing an increase because they are LAGGING indicators).
https://www.marketforum.com/forum/topic/49867/
Info For these charts gleaned from https://www.worldometers.info/coronavirus/country/us/
The end date is 4-17.
Current rate 0.9607, 5 day moving average 1.035
Cutworm: The current rate is again below 1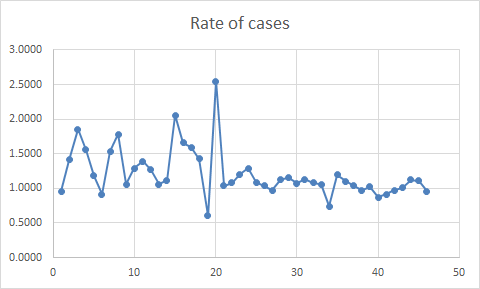
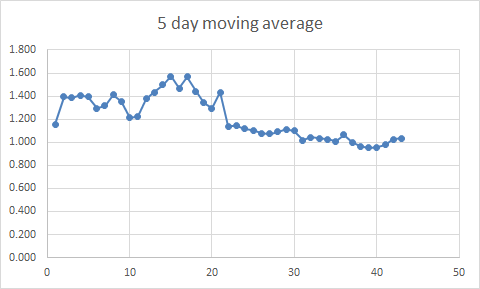
Thanks very much cutworm!
Saturday: They just did an insane update for deaths on 4-14, more than doubling the previous number and more than double the previous high or any other day at 5,977!!! How can 3,000+ deaths suddenly show up several days later in the stat and that day have more than 3 times as many deaths as the previous day, with 1,718??? If that is not a glitch that gets adjusted back, then it makes me concerned again about the accuracy of this data.
https://coronavirus.1point3acres.com/en
Date New Cases+/-change in new cases vs yesterday
3-3 21
3-4 31+10
3-5 75+46
3-6 99+24
3-7 116+17
3-8 121+5
3-9 179+58
3-10 290+111
3-11 247-43
3-12 425+178
3-13 528+103
3-14 732+204
3-15 710-22
New cases +/- change %change in new cases
3-16 965+258 +37%
3-17 1,454+489 +51%
3-18 2,645+1,191 +82%
3-19 5,437+2858 +108%
3-20 5,529+65 +1%
3-21 7,165+1,683 +23%
3-22 8,361+1165 +16%
3-23 9,828 +1,403 +17%
3-24 10,590 +783 +8%
3-25 13,984 +3,369 +32%
3-26 16,905 +2,863 +20%
3-27 18,780 +2,101 +12%
3-28 20,028 +1,039 +5%
3-29 17,989 -1,853 -9%
3-30 21,844 +3,790 +21%
3-31 25,747- +3,774 +17%
4-1 26,558 +837 +3%
4-2 29,738 +3,180 +12%
4-3 32,592 +2,754 +9%
4-4 34,126 +1,534 +6% High for daily number
4-5 25,796 -8,330 -25%
4-6 31,185 +5,389 +21%
4-7 31,676 +491 +2%
4-8 32,989 +1,313 +4%
4-9 34,408 +1,419 +4% Barely a new high with 4-4
4-10 34,244 +164 +0% Barley another new high for a triple top
4-11 30,142 -4,102 -12%
4-12 27,532 -2,510 -8%
4-13 26,540 -992 -4%
4-14 26,506 -34 -0%
4-15 30,413 +3,907 +15% Not every day will drop after the top. A new high here, however would be an unpleasant surprise.
4-16 32,029 +1,616 +5% Bouncing higher after the extremely dry air mass hit. Is this from weather? https://www.marketforum.com/forum/topic/49391/
4-17 30,980 -1,049 -3%
4-18 28,687 -2,293 -8%
Total cases 742,067
Doubling rate more than 11 days. A statistical triple top occurred on 4-4, 4-9, 4-10 for new cases at just over 34,000 on all 3 days. Deaths Tuesday just got changed today to 5,977, more than 3,000 higher than what they had reported for that day all week...until today!
+++++++++++++++++++++++++++++++++++++++++++++
Monday: Ready now to adjust the estimate a tad downward for new cases but don't even take that # serious........we have over 2 weeks of data to change that number. Maybe total new cases at the end of the month will come in less than 1,100,000 with deaths close to 43,000(death rates have been pretty high-mostly old/sick people)
+++++++++++++++++++++++++++++++++++++++++++++++++++
Tuesday: New infection rate peaked last week being strongly confirmed right now. Death rate, most lagging indicator is peaking this week. New high of 2,387 today.
++++++++++++++++++++++++++++++++++++++++++++
Wednesday: Up a bit......not every day will be lower after the top. Deaths 2,516-new high.
++++++++++++++++++++++++
Thursday: Did the cold, very dry air cause new cases to go higher here? https://www.marketforum.com/forum/topic/49391/
Edit: forgot to revise the deaths to 53,000 earlier this week. I've been just paying attention to new cases and not paying attention to deaths.
++++++++++++++++++++++++++++++++++++
Friday: Highs are still in but this very dry air may have been good for the virus to survive longer.
+++++++++++++++++++++++++++++++++++++
Saturday: They just increased the deaths on Tuesday from 2,557 to 5,977! That can't be right! The day before was 1,718-Mon and day after-Wed was 2,795, then 2,110-Thu.
++++++++++++++
We have a reliable leading indicator that is often 2 weeks ahead of the daily infection reports which is providing powerful evidence that the current rate of new numbers of people with the flu/coronavirus.....measured in real time has been falling for awhile even as new cases and delayed test results WERE showing an increase because they are LAGGING indicators).
https://www.marketforum.com/forum/topic/49867/
Info For these charts gleaned from https://www.worldometers.info/coronavirus/country/us/
The end date is 4-18.
Current rate 0.9034, 5 day moving average 1.021

Opinion: Can we analyze the rate chart like some do in technical annalists? on the rate chart below is there a triangle pattern ? Notice the 3 brown points line up, and the 3 green also. Let's see what happens in the days to come.
Thanks very much cutworm!
With Sunday's number, we probably broke below the green dot of Saturday. I feel confident that lower numbers are ahead. Not every day but on most days.
Saturday: They just did an insane update for deaths on 4-14, more than doubling the previous number and more than double the previous high or any other day at 5,977!!! How can 3,000+ deaths suddenly show up several days later in the stat and that day have more than 3 times as many deaths as the previous day, with 1,718??? If that is not a glitch that gets adjusted back, then it makes me concerned again about the accuracy of this data.
https://coronavirus.1point3acres.com/en
Date New Cases+/-change in new cases vs yesterday
3-3 21
3-4 31+10
3-5 75+46
3-6 99+24
3-7 116+17
3-8 121+5
3-9 179+58
3-10 290+111
3-11 247-43
3-12 425+178
3-13 528+103
3-14 732+204
3-15 710-22
New cases +/- change %change in new cases
3-16 965+258 +37%
3-17 1,454+489 +51%
3-18 2,645+1,191 +82%
3-19 5,437+2858 +108%
3-20 5,529+65 +1%
3-21 7,165+1,683 +23%
3-22 8,361+1165 +16%
3-23 9,828 +1,403 +17%
3-24 10,590 +783 +8%
3-25 13,984 +3,369 +32%
3-26 16,905 +2,863 +20%
3-27 18,780 +2,101 +12%
3-28 20,028 +1,039 +5%
3-29 17,989 -1,853 -9%
3-30 21,844 +3,790 +21%
3-31 25,747- +3,774 +17%
4-1 26,558 +837 +3%
4-2 29,738 +3,180 +12%
4-3 32,592 +2,754 +9%
4-4 34,126 +1,534 +6% High for daily number
4-5 25,796 -8,330 -25%
4-6 31,185 +5,389 +21%
4-7 31,676 +491 +2%
4-8 32,989 +1,313 +4%
4-9 34,408 +1,419 +4% Barely a new high with 4-4
4-10 34,244 +164 +0% Barley another new high for a triple top
4-11 30,142 -4,102 -12%
4-12 27,532 -2,510 -8%
4-13 26,540 -992 -4%
4-14 26,506 -34 -0%
4-15 30,413 +3,907 +15% Not every day will drop after the top. A new high here, however would be an unpleasant surprise.
4-16 32,029 +1,616 +5% Bouncing higher after the extremely dry air mass hit. Is this from weather? https://www.marketforum.com/forum/topic/49391/
4-17 30,980 -1,049 -3%
4-18 28,687 -2,293 -8%
4-19 25,596 -3,091 -11%
Today's increase is the lowest increase since 20 days ago, March 30! Past Sunday's have featured low numbers.
Total cases 771,980
A statistical triple top occurred on 4-4, 4-9, 4-10 for new cases at just over 34,000 on all 3 days. Deaths Tuesday just got changed today to 5,977, more than 3,000 higher than what they had reported for that day all week...until today's crazy change!
Thursday: Did the cold, very dry air cause new cases to go higher here? https://www.marketforum.com/forum/topic/49391/
Edit: forgot to revise the deaths to 53,000 earlier this week. I've been just paying attention to new cases and not paying attention to deaths.
++++++++++++++++++++++++++++++++++++
Friday: Highs are still in but this very dry air may have been good for the virus to survive longer.
+++++++++++++++++++++++++++++++++++++
Saturday: They just increased the deaths on Tuesday from 2,557 to 5,977! That can't be right! The day before was 1,718-Mon and day after-Wed was 2,795, then 2,110-Thu.
++++++++++++++
Sunday: Lowest daily increase in new cases since March 30th. However, Sunday's in the past have a tendency to report low numbers.
++++++++++++++++++++++++++++++++++++++++++++++++++++
We have a reliable leading indicator that is often 2 weeks ahead of the daily infection reports which is providing powerful evidence that the current rate of new numbers of people with the flu/coronavirus.....measured in real time has been falling for awhile even as new cases and delayed test results WERE showing an increase because they are LAGGING indicators).
https://www.marketforum.com/forum/topic/49867/
Info For these charts gleaned from https://www.worldometers.info/coronavirus/country/us/
The end date is 4-18.
Current rate 0.8894, 5 day moving average 0.997 Both below 1 and on downward trends