Lucky April 15th to you! Keep up the great work America!
1. New COVID-19 cases at home peaked as much as 3+ weeks ago and have been dropping.
2. New cases: We now have a statistical triple top technically for 4-4, 4-9, 4-10. Odds are high to see a consistent(but not every day-today will be higher) drop for the rest of the month.
3. Old cases resulting in deaths are the last to peak. We are having new highs for deaths yesterday and today/Wednesday.

We've turned the corner!
Despite the current pandemic, we still live in the best time of human history. This Coronavirus panic has peaked! The shut downs have worked but must continue for a short while.
Tracking the Coronavirus#2-WED-The highs are in for new cases!!!
https://www.marketforum.com/forum/topic/49863/
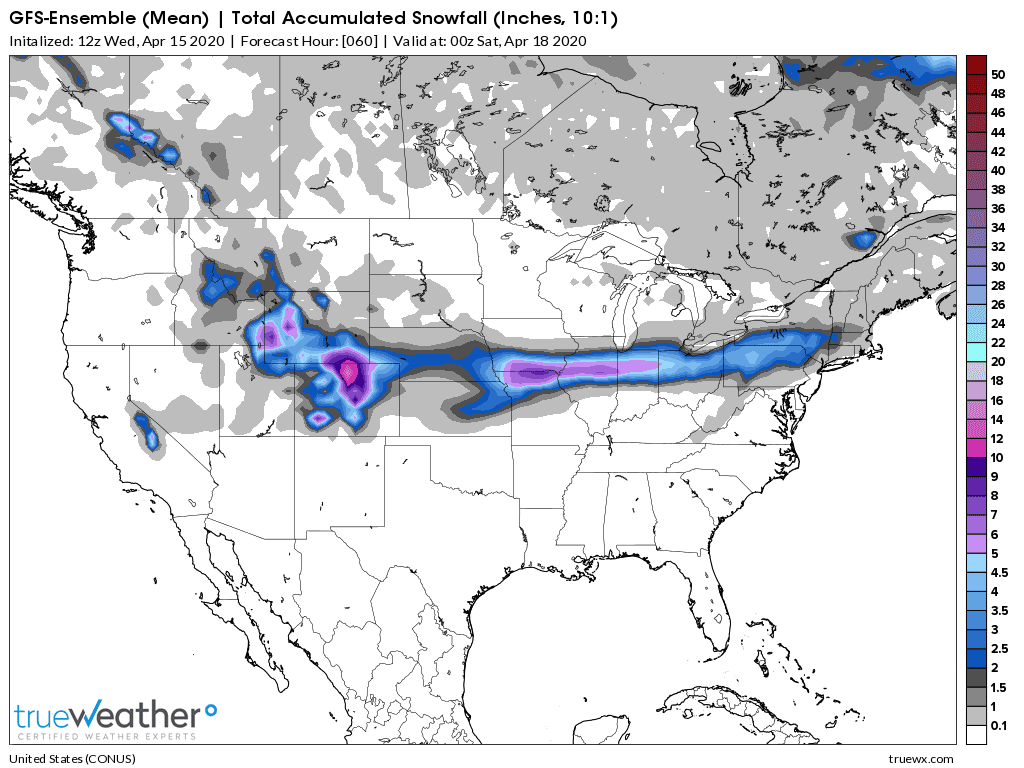
Wednesday's weather: Improved for planting corn next week. Heavy snow in a narrow, west to east band late Thursday/Fri. See map below.
OLD: April massive freeze damage 2007-upcoming freeze-2020
Started by metmike - April 6, 2020, 12:16 a.m.
https://www.marketforum.com/forum/topic/50080/
Scroll down and enjoy the latest comprehensive weather to the max...... occurring because of the natural physical laws in our atmosphere as life on this greening planet continues to enjoy the best weather/climate in at least 1,000 years(the last time that it was this warm) with the added bonus of extra beneficial CO2.
Reasons to be thankful here in 2020!
https://www.marketforum.com/forum/topic/45623/
Winter Weather Forecasts
https://www.wpc.ncep.noaa.gov/wwd/winter_wx.shtml
Snowfall thru Friday below.

Go to the link below, then hit the location/county on the map for details.
https://www.spc.noaa.gov/ Go to "hazards"
Here are the latest hazards across the country.
 |
Purple/Pink/blue on land is cold/Winter weather. Brown is wind, Green is flooding. Gray is fog. Reddish is a red flag advisory.
Go to the link below, then hit the location/county on the map for details.
https://www.spc.noaa.gov/ Go to "hazards"
https://www.mesonet.org/index.php/weather/map/us_air_temperature/air_temperature

https://www.mesonet.org/index.php/weather/map/wind_chill_heat_index1/air_temperature

Current Weather Map
| NCEP Days 0-7 Forecast Loop | NCEP Short-Range Model Discussion | NCEP Day 3-7 Discussion |


Current Jet Stream

| Low Temperatures Tomorrow Morning |

Highs today and tomorrow.


Highs for days 3-7:
Warming up this weekend and next week!!


Average Temperatures for days 3-7
Warming up this weekend.........the magnitude of blues is shrinking and will morph into reds as the week goes on.
https://www.wpc.ncep.noaa.gov/medr/medr_mean.shtml


Surface Weather features day 3-7:
Quiet/dry Upper Midwest.

Liquid equivalent precip forecasts for the next 7 days are below.
Dry Upper Midwest down to N.Iowa.
Snowfall thru Friday. The snow in the Midwest is from a system Thursday/Friday.
Day 1 below:
http://www.wpc.ncep.noaa.gov/qpf/fill_94qwbg.gif?1526306199054

Day 2 below:
http://www.wpc.ncep.noaa.gov/qpf/fill_98qwbg.gif?1528293750112

Day 3 below
http://www.wpc.ncep.noaa.gov/qpf/fill_99qwbg.gif?1528293842764

Days 4-5 below:
http://www.wpc.ncep.noaa.gov/qpf/95ep48iwbg_fill.gif?1526306162

Days 6-7 below:
http://www.wpc.ncep.noaa.gov/qpf/97ep48iwbg_fill.gif?1526306162

7 Day Total precipitation below:
https://www.wpc.ncep.noaa.gov/qpf/p168i.gif?1566925971

Excessive rain potential.
Drying out Upper Midwest.
Mesoscale Precipitation Discussions
Current Day 1 Forecast Valid 16Z 08/30/19 - 12Z 08/31/19 |
Day 1 Threat Area in Text Format
| Day 2 and Day 3 Forecasts |
Current Day 2 Forecast Valid 12Z 08/31/19 - 12Z 09/01/19 |
Day 2 Threat Area in Text Format
Current Day 3 Forecast |
Severe Storm Risk the next 8 days:
Quiet for the next week.
Current Day 1 Outlook | |
Current Day 2 Outlook | |
Current Day 3 Outlook | F |
Current Day 4-8 Outlook |
Current Dew Points

Latest radar loop
http://www.nws.noaa.gov/radar_tab.php


| (3400x1700 pixels - 2.2mb) Go to: Most Recent Image |

Go to: Most Recent Image
You can go to this link to see precipitation totals from recent time periods:
https://water.weather.gov/precip/
Go to precipitation, then scroll down to pick a time frame. Hit states to get the borders to see locations better. Under products, you can hit "observed" or "Percent of Normal"
Soilmoisture anomaly:
These maps sometimes take a day to catch up to incorporate the latest data(the bottom map is only updated once a week).
Soils in the Central Cornbelt have dried out enough for early planting. Places like Central IL have done some work.
Plenty of time to dry out elsewhere and it will dry out in the Upper Midwest for the next 10 days.
https://www.cpc.ncep.noaa.gov/products/Soilmst_Monitoring/US/Soilmst/Soilmst.shtml#
![]()


Drought Monitor maps:
Latest: The first map below is the latest. The 2nd one is from last week.
April 8: No drought anywhere in the Midwest. 0% drought there.
The maps below are updated on Thursdays.
https://droughtmonitor.unl.edu/


The top map is the Canadian ensemble average, the maps below are the individual members that make up the average at the end of week 2.
+++++++++++++++++++++++++++++++++++++++++
Each member is like the parent, Canadian model operational model.......with a slight tweek/variation in parameters. Since we know the equations to represent the physics of the atmosphere in the models are not perfect, its useful to vary some of the equations that are uncertain(can make a difference) to see if it effects the outcome and how.
The average of all these variations(ensembles) often yields a better tool for forecasting. It's always more consistent. The individual operational model, like each individual ensemble member can vary greatly from run to run.........and represent an extreme end of the spectrum at times. The ensemble average of all the members, because it averages the extremes.............from opposite ends of the spectrum.........changes much less from run to run.
End of week 2....................0z Canadian ensembles:
Last Monday: Big battle between northern stream and southern stream. Upper ridge Northwest Canada and downstream trough in Central Canada to the Midwest is excellent for cold air delivery from the northern stream. Trough in the Southwest and points east part of the southern stream........moist flow.
Tuesday: The average looks zonal in the US because it takes extremes from 2 ends and divides them by the number of solutions. Pronouced northern stream with cold from Canada. In the US, wide spread in solutions ranging from a dry/cold northern stream to lots of moisture from the southern stream and potentially stormy.
Thursday: After 10+ days of strong northern stream with chilly dry air, the late week 2 maps show the southern stream taking over and northern stream retreating. Turning warmer and possibly wet for the last week in April..........for this model solution.
Saturday: Zonal look to the average but wide disparity of NOT zonal flow from individual solutions. Turning wetter in week 2 with more southern stream influence.
Sunday: Active southern stream and wet!
Monday: Zonal average and also many individual solutions with zonal.........so good agreement. Might be a bit active with fast moving, Pacific origin systems but not that wet as deep moisture from the Gulf is cut off. Temps close to average.
Tuesday: Zonal flow.
Wednesday: Turning wetter with more active southern stream flow on the majority of solutions. Upper level trough West to Plains.
360h GZ 500 forecast valid on Apr 30, 2020 12 UTC


Forecasts for the control (GEM 0) and the 20 ensemble members (global model not available)
GFS Ensemble mean(average of all the individual solutions above). The first map is a mid/upper level map. The 2nd one is a temperatures map at around 1 mile above the surface. These are anomalies(difference compared to average).
NCEP Ensemble t = 360 hour forecast
Last: Sunday: Decent positive anomaly N.Pacific/Alaska coupling with impressive negative anomaly in Central Canada that extends to the Northeast US. Favorable for strong, late season cold to dump into the Midwest to Northeast.
Monday: Positive anomaly Alaska fizzles out. Still a negative anomaly in Central Canada. New modest positive anomaly in the Southeast.
Tuesday: Positive anomalies off the West Coast and N.Atlantic. Main anomaly is over the Hudson Bay extending south to the Midwest..............very chilly in the Plains/MIdwest to Northeast.
Thursday. Slight positive anomaly Pac NW Coast area, negative anomaly Central Canada extending south into the Midwest.........source of more northern stream cold/dry on this model. Not agreed on by all models/solutions. Some are warmer and wetter.
Saturday: Positive anomaly southcentral US will really warm things up. Lingering chill in the Northeast?
Sunday: Positive anomaly over Greenland, modest negative anomaly central Canada could bring some chilly air to the Upper Midwest to Northeast.
Monday: No anomalies far from average. Fast zonal, west to east flow regime.
Tuesday: Zonalish. Modest positive anomaly West, modest negative anomaly East(where it supports chilly).
Wednesday: Positive anomaly Rockies to N.Plains with negative anomaly in E.Pacific and slight negative East Coast. This is much different that the Canadian model and much drier. Also warmer Rockies to the Plains.

Latest, updated graph/forecast for AO and NAO and PNA here, including an explanation of how to interpret them...............mainly where they stand at the end of 2 weeks.
https://www.marketforum.com/forum/t
Previous analysis, with the latest day at the bottom for late week 2 period.
Discussions, starting with the oldest below.
Last Sunday: AO a tad positive. NAO goes from solidly negative(cold) rising close to 0. PNA a tad negative. The -NAO up until late is part of the pattern that will be excellent for delivering cold from Canada into the US.
Monday: AO still a bit positive. NAO goes from negative to a slightly positive. PNA a tad negative. The actual weather pattern is great for cold in the northern tier, the -NAO in week 1 is great for this but it increases in week 2, so we MIGHT warm up late week 2.
Thursday: AO is a bit positive surprisingly during the upcoming near record cold.........unusual. Solidly negative NAO is behind it entirely. NAO gets close to 0 late week 2........moderating in temps. PNA hovers just below 0.....nothing there.
Saturday: AO positive but drops a bit late. NAO negative but back near 0 late. PNA negative but back near 0 late. Fading influence from these indices that tell us more about the northern stream, as the southern stream becomes more dominant.
Sunday: AO is much lower today, even a few negative solutions, same with the NAO, so there is some support for the chilly air in the Midwest/Northeast to continue longer than the models think. Negative PNA moves towards 0.
Monday: AO drops to around 0, NAO goes up than down both have a wide spread. PNA increases to around 0. Nothing from these indices worth dialing into the upcoming pattern. They are best used during the cold season as northern stream indicators. The -NAO at times does suggest some chilly weather in the Northeast quadrant.
Tuesday: All indices slightly negative. Leaning chilly to the Northeast.
Wednesday: AO, NAO and PNA all near 0.
National Weather Service 6-10 day, 8-14 day outlooks.
Updated daily just after 2pm Central.
Temperature Probability
 Precipitation Probability

| the 8-14 day outlooks ArchivesAnalogsLines-Only FormatGIS Data | |
Temperature Probability | |
 | |
By bowyer - April 9, 2020, 8:31 p.m.
80 degrees here yesterday....snow flurries this afternoon
+++++++++++++++++++++++++
Hey bowyer,
Have you got some planting done in westcentral IL?
++++++++++++++
0 likes
By bowyer - April 13, 2020, 2:30 p.m.
There has been some planting done, both corn and beans. With the cold wet forecast for this week, I left the planter in the shed
+++++++++++++++++
Re: Re: Re: Re: Weather Monday
By metmike - April 13, 2020, 4:40 p.m.
Thanks!
If the panic is over then why are people afraid to go back to work
GDP shot all to heck for a long time
Has anybody considered how we will pay for the increased deficit with a negative GDP
Do we just roll the debt at low int rates for as long as we can see
What happens if foreign investment decides to not buy the bonds
Has anybody considered that the stk market has no relationship to actual value or P/E
How many BK will we have
J.C Penny is in trouble which means a lot of malls will have empty space and lower value
How will the folks pay down accumulated debt when bills haven't been paid when not working
What will the unemployment be [very high for an extended time frame]
I don't see much joy for a lot of people going forward
Has anybody looked at the gold story. You should as gold is telling us what might happen
Gold is telling us the longer things are shut down, the economy is going down hill, faster and faster
What will the world do about the locust problem
Do we just let those people starve
I could go on but there is a lot more in this world that is in trouble than any thing good to look forward that will happen
Depression
Some say we are in a depression now.
I don't think so just yet until we see what happens if /when things ever open up, and then we can see what the state of affairs might be
It won't be the same or a fast recovery that is for sure


