KEY EVENTS TO WATCH FOR:
Tuesday, April 28, 2020
7:45 AM ET. The Retail Economist/Goldman Sachs Weekly Chain Store Sales Index
Chain Store Sales, W/W% (previous +1.3%)
Chain Store Sales, M/M% (previous -20.1%)
8:30 AM ET. March Advance Economic Indicators Report
8:55 AM ET. Johnson Redbook Retail Sales Index
Ret Sales Mo-to-Date, M/M% (previous -10.6%)
Ret Sales Mo-to-Date, Y/Y% (previous -4.4%)
Latest Wk, Y/Y% (previous -6.9%)
9:00 AM ET. February S&P CoreLogic Case-Shiller Indices
10-City Idx, M/M% (previous +0.1%)
10-City Idx, Y/Y% (previous +2.6%)
20-City Idx, M/M% (previous +0.0%)
20-City Idx, Y/Y% (previous +3.1%)
National Idx, M/M% (previous +0.0%)
National Idx, Y/Y% (previous +3.9%)
10:00 AM ET. April Richmond Fed Business Activity Survey
Mfg Idx (previous 2)
Shipments Idx (previous 13)
10:00 AM ET. April Consumer Confidence Index
Cons Conf Idx (previous 120)
Expectation Idx (previous 88.2)
Present Situation Idx (previous 167.7)
10:00 AM ET. 1st Quarter U.S. Housing Vacancies
4:30 PM ET. API Weekly Statistical Bulletin
Crude Stocks, Net Chg (Bbls) (previous +13.2M)
Gasoline Stocks, Net Chg (Bbls) (previous +3.4M)
Distillate Stocks, Net Chg (Bbls) (previous +7.6M)
N/A U.S. Federal Open Market Committee meeting
Wednesday, April 29, 2020
7:00 AM ET. MBA Weekly Mortgage Applications Survey
Composite Idx (previous 768.5)
Composite Idx, W/W% (previous -0.3%)
Purchase Idx-SA (previous 186.4)
Purchase Idx-SA, W/W% (previous +2.1%)
Refinance Idx (previous 4206.7)
Refinance Idx, W/W% (previous -0.8%)
8:30 AM ET. 1st Quarter Advance estimate GDP
Annual Rate, Q/Q% (previous +2.1%)
Chain-Weighted Price Idx, Q/Q% (previous +1.3%)
PCE Price Idx, Q/Q% (previous +1.4%)
Purchase Price Idx, Q/Q% (previous +1.4%)
Real Final Sales 1st Est, Q/Q% (previous +3.1%)
Core PCE Price Idx, Q/Q% (previous +1.3%)
Personal Consumption, Q/Q% (previous +1.8%)
10:00 AM ET. March Metropolitan Area Employment & Unemployment
10:00 AM ET. March Pending Home Sales Index
Pending Home Sales (previous 111.5)
Pending Home Sales Idx, M/M% (previous +2.4%)
Pending Home Sales Idx , Y/Y% (previous +9.4%)
10:30 AM ET. EIA Weekly Petroleum Status Report
Crude Oil Stocks (Bbl) (previous 518.64M)
Crude Oil Stocks, Net Chg (Bbl) (previous +15.022M)
Gasoline Stocks (Bbl) (previous 263.234M)
Gasoline Stocks, Net Chg (Bbl) (previous +1.017M)
Distillate Stocks (Bbl) (previous 136.88M)
Distillate Stocks, Net Chg (Bbl) (previous +7.876M)
Refinery Usage (previous 67.6%)
Total Prod Supplied (Bbl/day) (previous 14.103M)
Total Prod Supplied, Net Chg (Bbl/day) (previous +0.306M)
(Bbl/day)
2:00 PM ET. U.S. interest rate decision
Federal Funds Rate
Federal Funds Rate Change (Pts)
Fed Funds Rate-Range High (previous 0.25)
Fed Funds Rate-Range Low (previous 0.00)
FOMC Vote For Action
FOMC Vote Against Action
Discount Rate (previous 0.25)
Discount Rate Change (Pts)
Discount Rate-Range High
Discount Rate-Range Low
Thursday, April 30, 2020
8:30 AM ET. March Personal Income & Outlays
Personal Income, M/M% (previous +0.6%)
Consumer Spending, M/M% (previous +0.2%)
PCE Price Idx, M/M% (previous +0.1%)
PCE Price Idx, Y/Y% (previous +1.8%)
PCE Core Price Idx, M/M% (previous +0.2%)
PCE Core Price Idx, Y/Y% (previous +1.8%)
8:30 AM ET. Unemployment Insurance Weekly Claims Report - Initial Claims
Jobless Claims (previous 4427K)
Jobless Claims, Net Chg (previous -810K)
Continuing Claims (previous 15976000)
Continuing Claims, Net Chg (previous +4064K)
8:30 AM ET. 1st Quarter Employment Cost Index
ECI, Q/Q% (previous +0.7%)
ECI, Y/Y% (previous +2.7%)
8:30 AM ET. U.S. Weekly Export Sales
Corn (Metric Tons) (previous 670.8K)
Soybeans (Metric Tons) (previous 345.4K)
Wheat (Metric Tons) (previous 399.9K)
9:45 AM ET. Bloomberg Consumer Comfort Index
9:45 AM ET. April ISM-Chicago Business Survey - Chicago PMI
PMI-Adj (previous 47.8)
10:30 AM ET. EIA Weekly Natural Gas Storage Report
Working Gas In Storage (Cbf) (previous 2140B)
Working Gas In Storage, Net Chg (Cbf) (previous +43B)
3:00 AM ET. March Agricultural Prices
Farm Prices, M/M% (previous -2.2%)
4:30 PM ET. Foreign Central Bank Holdings
4:30 PM ET. Money Stock Measures
4:30 PM ET. Federal Discount Window Borrowings
N/A Foreign portfolio holdings of U.S. securities final results
Friday, May 1, 2020
9:45 AM ET. April US Manufacturing PMI
PMI, Mfg (previous 48.5)
10:00 AM ET. March Construction Spending - Construction Put in Place
New Construction (previous -1.3%)
Residential Construction
10:00 AM ET. April ISM Manufacturing Report on Business
Manufacturing PMI (previous 49.1)
Prices Idx (previous 37.4)
Employment Idx (previous 43.8)
Inventories (previous 46.9)
New Orders Idx (previous 42.2)
Production Idx (previous 47.7)
4:00 PM ET. April Domestic Auto Industry Sales
The STOCK INDEXES http://quotes.ino.com/exchanges/?c=indexes"
The STOCK INDEXES:The June NASDAQ 100 was higher in overnight trading and is poised to resume the rally off March's low. The high-range trade sets the stage for a steady to higher opening when the day session begins trading. Stochastics and the RSI are becoming overbought but remain neutral to bullish signaling that sideways to higher prices are possible near-term. If June resumes the rally off March's low, the 75% retracement level of the February-March-decline crossing at 9003.03 is the next upside target. Closes below the 20-day moving average crossing at 8350.67 would confirm that a short-term top has been posted. First resistance is the 75% retracement level of the February-March-decline crossing at 9003.03. Second resistance is the 87% retracement level of the February-March-decline crossing at 9384.61. First support is the 20-day moving average crossing at 8350.67. Second support is the reaction low crossing at 7948.00.
The June S&P 500 was higher in late-overnight trading as it renewed the rally off March's low. The high-range overnight trade sets the stage for a steady to higher opening when the day session begins trading later this morning.Stochastics and the RSI are overbought but remain neutral to bullish signaling that sideways to higher prices are possible near-term. If June extends the rally off March's low, the 62% retracement level of the February-March-decline crossing at 2921.04 is the next upside target. Closes below the 20-day moving average crossing at 2730.46 would confirm that a short-term top has been posted. First resistance is the 62% retracement level of the February-March-decline crossing at 2921.04. Second resistance is the 75% retracement level of the February-March-decline crossing at 3081.80. First support is the 20-day moving average crossing at 2730.46. Second support is the April 1st low crossing at 2448.00.
INTEREST RATES http://quotes.ino.com/ex changes/?c=interest"
INTEREST RATES: June T-bonds were slightly lower in late-overnight trading while extending this month's trading range. Stochastics and the RSI are turning neutral to bearish hinting that a double top with the early April high might be forming. Multiple closes below the reaction low crossing at 177-14 would confirm that a double top has been posted. If June renews the rally off March's low, the March 12th high crossing at 184-07 is the next upside target. First resistance is the March 12th high crossing at 184-07. Second resistance is March's high crossing at 191-22. First support is the reaction low crossing at 177-14. Second support is the 50-day moving average crossing at 176-03.
June T-notes were steady to slightly lower overnight. The mid-range overnight trade sets the stage for a steady to lower opening with the day session begins trading. Stochastics and the RSI are neutral to bearish signaling that sideways to lower prices are possible near-term. Closes below the April 7th low crossing at 138.160 would confirm that a short-term top has been posted while opening the door for additional weakness near-term. If June extends the rally off March's low, March's high crossing at 140.240 is the next upside target. First resistance is last-Tuesday's high crossing at 139.220. Second resistance is March's high crossing at 140.240. First support is the April 7th low crossing at 138.160. Second support is the 50-day moving average crossing at 136.264.
ENERGY MARKETS? http://quotes.ino.com/ex?changes/?c=energy ""
June crude oil was lower in overnight trading as it extended Monday's decline.The mid-range overnight trade sets the stage for a steady to lower opening when the day session begins trading. Stochastics and the RSI are turning neutral to bearish signaling that sideways to lower prices are possible near-term. Closes above the 20-day moving average crossing at 23.43 would signal that a short-term low has been posted. If June renews this year's decline, downside targets are unknown. First resistance is the 20-day moving average crossing at 23.43. Second resistance is the April 9th high crossing at 33.15. First support is last-Tuesday's low crossing at 6.50. Second support is unknown.
June heating oil was steady to slightly lower overnight as it extends this year's decline. The high-range overnight trade sets the stage for a steady to higher opening when the day session begins trading. Stochastics and the RSI are oversold but remain turning neutral to bearish signaling that sideways to lower prices are possible near-term. If June extends this year's decline, the October-2001 low on the monthly continuation chart crossing at 49.30 is the next downside target. Closes above the 20-day moving average crossing at 94.03 are needed to confirm that a short-term low has been posted. First resistance is the 20-day moving average crossing at 94.03. Second resistance is the April 2nd high crossing at 116.02. First support is the overnight low crossing at 67.24. Second support is the October-2001 low on the monthly continuation chart crossing at 49.30.
June unleaded gas was slightly higher overnight as it extends the March-April trading range. The high-range late-overnight trade sets the stage for a steady to higher opening when the day session begins trading. Stochastics and the RSI are neutral signaling that sideways trading is possible near-term. Closes above the reaction high crossing at 82.72 would signal that a short-term low has been posted. Closes below March's low crossing at 51.89 would confirm a downside breakout of the aforementioned trading range. First resistance is the reaction high crossing at 82.72. Second resistance is the 25% retracement level of the January-March-decline crossing at 88.30. First support is March's low crossing at 51.89. Second support is monthly support crossing at 32.40.
June Henry natural gas was lower overnight. The mid-range overnight trade sets the stage for a steady to lower opening when the day session begins trading. Stochastics and the RSI are neutral to bearish signaling that sideways to lower prices are possible near-term. Closes below the 20-day moving average crossing at 1.874 would signal that a short-term top has been posted. If June renews the rally off April's low, the 50% retracement level of the 2019-2020-low crossing at 2.154 is the next upside target. First resistance is March's high crossing at 2.108. Second resistance is the 50% retracement level of the 2019-2020-low crossing at 2.154. First support is the 20-day moving average crossing at 1.874. Second support is the April 16th low crossing at 1.705. Third support is April's low crossing at 1.649.
CURRENCIEShttp://quotes.ino.com/ex changes/?c=currencies"
CURRENCIES:The June Dollar was lower in late-overnight trading as it consolidates some of the rally off April's low. The low-range overnight trade sets the stage for a steady to lower opening when the day session begins trading. Stochastics and the RSI are neutral to bearish signaling that sideways to lower prices are possible near-term. If June resumes the decline off March's high, the 62% retracement level of March's rally crossing at 98.14 is the next downside target. If June extends the rally off April's low, the April 6th high crossing at 101.03 is the next upside target.First resistance is the April 6th high crossing at 101.03. Second resistance is March's high crossing at 103.96. First support is the 50% retracement level of March's rally crossing at 99.24. Second support is the 62% retracement level of March's rally crossing at 98.13.
The June Euro was higher in late-overnight trading as it extends the rally off last-Friday's low. The high-range overnight trade sets the stage for a steady to higher opening when the day session begins trading. Stochastics and the RSI are neutral to bullish signaling that sideways to higher prices are possible near-term. Closes above the 50-day moving average crossing at 109.94 would temper the near-term bearish outlook. If June renews this month's decline, March's low crossing at 106.71 is the next downside target. First resistance is April's high crossing at 110.07. Second resistance is the March 27th high crossing at 111.88. Third resistance is the March 16th high crossing at 112.78. First support is last-Friday's low crossing at 107.39. Second support is March's low crossing at 106.71.
The June British Pound was higher overnight as it extends the rebound off last-Tuesday's low.The high-range overnight trade sets the stage for a steady to higher opening when the day session beings trading. Stochastics and the RSI are neutral to bullish signaling that sideways to higher prices are possible near-term. If June resumes the rally off March's low the 62% retracement level of the December-March-decline crossing at 1.2758 is the next upside target. Closes below last-Tuesday's low crossing at 1.2252, the April 7th low crossing at 1.2174 is the next downside target. First resistance is the 62% retracement level of the December-March-decline crossing at 1.2758. Second resistance is the 75% retracement level of the December-March-decline crossing at 1.3042. First support is the April 7th low crossing at 1.2174. Second support is March's low crossing at 1.1438.
The June Swiss Franc was higher in late-overnight trading. The high-range overnight trade sets the stage for a steady to lower opening when the day session begins trading. Stochastics and the RSI are neutral signaling that sideways to higher prices are possible near-term. Closes above the 50-day moving average crossing at 1.0397 would confirm that a short-term low has been posted. If June extends last-week's decline, March's low crossing at 1.0138 is the next downside target. First resistance is April's high crossing at 1.0443. Second resistance is the March 30th high crossing at 1.0566. Third resistance is the March 16th high crossing at 1.0698. First support is last-Friday's low crossing at 1.0216. Second is March's low crossing at 1.0138.
The June Canadian Dollar was higher overnight as it extends the rally off last-Tuesday's low. Stochastics and the RSI are bullish signaling that sideways to higher prices are possible near-term. If June resumes the rally off March's low, the 50-day moving average crossing at 72.15 is the next upside target.If June renews the aforementioned decline, the March 31st low crossing at 69.73 is the next downside target. First resistance is the 50-day moving average crossing at 72.15. Second resistance is the 50% retracement level of the January-March-decline crossing at 72.73. First support is the March 31st low crossing at 69.74. Second support is March's low crossing at March's low crossing at 68.20.
The June Japanese Yen was higher overnight as it renews the rally off March's low. The high-range overnight trade sets the stage for a steady to higher opening when the day session begins trading. Stochastics and the RSI are neutral to bullish signaling that sideways to higher prices are possible near-term. If June resumes the rally off March's low, the 25% retracement level of the 2016-2020 decline crossing at 0.0943 is the next upside target. Closes below the 50-day moving average crossing at 0.0928 would temper the near-term friendly outlook. First resistance is the overnight high crossing at 0.0939. Second resistance is the 25% retracement level of the 2016-2020-decline crossing at 0.0943. First support is April's low crossing at 0.0916. Second support is March's low crossing at 0.0900.
PRECIOUS METALS http://quotes.ino.com/ex changes/?c=metals"
PRECIOUS METALS: June gold was slightly higher in late-overnight trading. The high-range overnight trade sets the stage for a steady to higher opening when the day session begins trading. Stochastics and the RSI are neutral to bearish signaling that sideways to lower prices are possible near-term. Closes below last-Tuesday's low crossing at $1666.20 would confirm that a short-term top has been posted while renewing the decline off April's high. If June renews the rally off March's low, the October-2012 high on the monthly continuation chart crossing at $1798.10 is the next upside target. First resistance is the April 14th high crossing at $1788.80. Second resistance is the October-2012 high on the monthly continuation chart crossing at $1798.10. First support is last-Tuesday's low crossing at $1666.20. Second support is the 50-day moving average crossing at $1649.00.
July silver was steady to slightly lower overnight. The high-range overnight trade sets the stage for a steady to higher opening when the day session begins trading later this morning. Stochastics and the RSI are neutral to bearish signaling that sideways to lower prices are possible near-term. Closes below last-Tuesday's low crossing at $14.715 would confirm that a short-term top has been posted. If July renews the rally off March's low, the 75% retracement level of the February-March-decline crossing at $17.237 is the next upside target. First resistance is the 62% retracement level of the February-March-decline crossing at $16.252. Second resistance is the 75% retracement level of the February-March-decline crossing at $17.237. First support is last-Tuesday's low crossing at $14.715. Second support is April's low crossing at $13.935.
July copper was steady to slightly higher in late-overnight trading. The high-range overnight trade sets the stage for a steady to higher opening when the day session begins trading. Stochastics and the RSI are overbought but remain neutral to bullish signaling that sideways to higher prices are possible near-term. If July extends the rally off March's low, the 50% retracement level of the January-March-decline crossing at 2.4380 is the next upside target. Closes below last-Tuesday's low crossing at 2.2170 would signal that a short-term top has been posted. First resistance is the 50-day moving average crossing at 2.3735. Second resistance is the 50% retracement level of the January-March-decline crossing at 2.4380. First support is last-Tuesday's low crossing at 2.2170. Second support is March's low crossing at 1.9795.
GRAINS http://quotes.ino.com/ex changes/?c=grains
July corn was higher overnight as it consolidated some of Monday's decline. The high-range trade sets the stage for a steady to higher opening when the day sessions begins trading. Stochastics and the RSI are neutral to bearish signaling that sideways to lower prices are possible near-term. If July resumes the decline off December's high, psychological support crossing at $3.00 is the next downside target. Closes above the 20-day moving average crossing at $3.30 are needed to confirm that a low has been posted. First resistance is the 20-day moving average crossing at $3.30. Second resistance is the 50-day moving average crossing at $3.53 1/4. First support is last-Tuesday's low crossing at $3.09. Second support is psychological support crossing at $3.00.
July wheat was higher in late-overnight trading as it consolidates some of this month's decline. The high-range trade sets the stage for a steady to higher opening when the day session begins trading. Stochastics and the RSI are oversold, diverging but remain neutral to bearish signaling that sideways to lower prices are possible near-term. If July extends the decline off March's high, the 75% retracement level of March's rally crossing at $5.13 1/2 is the next downside target. Closes above the 20-day moving average crossing at $5.44 would temper the near-term bearish outlook. First resistance is April's high crossing at $5.64 1/2. Second resistance is March's high crossing at $5.71 1/2. First support is the 62% retracement level of March's rally crossing at $5.23 3/4. Second support is 75% retracement level of March's rally crossing at $5.13 1/2.
July Kansas City Wheat closed down $0.03 3/4-cents at $4.79 1/2.
July Kansas City wheat closed lower on Monday as it extends the decline off last-Monday's high. The low-range close sets the stage for a steady to lower opening when Tuesday night session begins trading. Stochastics and the RSI are neutral to bearish signaling that sideways to lower prices are possible near-term. Closes below the 50-day moving average crossing at $4.75 3/4 are needed to confirm that a short-term top has been posted. If July resumes the rally off March's low, January's high crossing at $5.19 is the next upside target. First resistance is March's high crossing at $5.09 1/4. Second resistance is January's high crossing at $5.19. First support is the 50-day moving average crossing at $4.75 3/4. Second support is April's low crossing at $4.67 3/4.
July Minneapolis wheat was higher overnight as it consolidates some of Monday's decline. The high-range overnight trade sets the stage for a steady to higher opening when the day session begins trading. Stochastics and the RSI are oversold but remain neutral to bearish signaling that sideways to lower prices are possible near-term. If July extends this year's decline psychological support crossing at $5.00 is the next downside target. Closes above the 50-day moving average crossing at $5.32 1/2 are needed to confirm that a short-term low has been posted. First resistance is the 10-day moving average crossing at $5.17 3/4. Second resistance is the 20-day moving average crossing at $5.27 3/4. Third resistance is the 50-day moving average crossing at $5.32 1/2. First support is Monday's low crossing at $5.08 1/2. Second support is psychological support crossing at $5.00.
SOYBEAN COMPLEX? http://quotes.ino.com/ex?changes/?c=grains "
July soybeans were higher overnight. The high-range trade sets the stage for a steady to higher opening when the day session begins trading. Stochastics and the RSI are neutral to bullish signaling that sideways to higher prices are possible near-term. Closes above the 20-day moving average crossing at $8.53 1/2 are needed to signal that a short-term low has been posted. If July renews the decline off the March 25th high, psychological support crossing at $8.00 is the next downside target. First resistance is the 20-day moving average crossing at $8.53 1/2. Second resistance is the 50-day moving average crossing at $8.73. First support is last-Tuesday's low crossing at $8.18 1/2. Second support is psychological support crossing at $8.00.
July soybean meal was slightly higher overnight. The high-range trade sets the stage for a steady to higher opening when the day session begins trading. Stochastics and the RSI are neutral to bullish signaling that a low might be in or is near. Closes above the 20-day moving average crossing at $297.70 are needed to confirm that a short-term low has been posted. If July resumes this year's decline, monthly support crossing at $283.10 is the next downside target. First resistance is the 20-day moving average crossing at $297.70. Second resistance is the 50-day moving average crossing at 304.00. First support is last-Tuesday's low crossing at $286.50. Second support is monthly support crossing at $283.10.
July soybean oil was higher overnight. The mid-range trade sets the stage for a steady to higher opening when the day session begins trading. Stochastics and the RSI are neutral to bearish signaling that sideways to lower prices are possible near-term. Closes above the 20-day moving average crossing at 26.66 would temper the near-term bearish outlook. If July extends the decline off April's high, March's low crossing at 25.02 is the next downside target. First resistance is the 25% retracement level of the January-March-decline crossing at 27.82. Second resistance is the 38% retracement level of the January-March-decline crossing at 29.31. First support is last-Friday's low crossing at 25.09. Second support is March's low crossing at 25.02.
LIVESTOCKhttp://quotes.ino.com/exchanges/?c=livestock
June hogs closed up $3.75 at $55.28.
June hogs closed sharply higher on Monday as it extends the rally off April's low. The high-range close sets the stage for a steady to higher opening when Tuesday's night session begins trading. Stochastics and the RSI remain neutral to bullish signaling that sideways to higher prices are possible near-term. If June extends the aforementioned rally the 38% retracement level of the 2019-2020 decline crossing at $62.16 is the next upside target. Closes below the 10-day moving average crossing at $47.62 would confirm that a short-term top has been posted. First resistance is today's high crossing at $55.28. Second resistance is the 38% retracement level of the 2019-2020 decline crossing at $62.16. First support is the 10-day moving average crossing at $47.62. Second support is April's low crossing at $41.50.
June cattle closed up $1.43 at $84.05.
June cattle closed higher on Monday. The high-range close sets the stage for a steady to higher opening on Tuesday. Stochastics and the RSI are neutral to bearish signaling that sideways to lower prices are possible near-term. If June resumes this year's decline, monthly support crossing at $69.29 is the next downside target. Closes above last-Friday's high crossing at $88.13 are needed to confirm that a short-term low has been posted. First resistance is last-Friday's high crossing at $88.13. Second resistance is the 50-day moving average crossing at $93.52. First support is April's low crossing at $76.60. Second support is monthly support crossing at $69.29.
May Feeder cattle closed up $0.70-cents at $118.15.
May Feeder cattle closed higher on Monday. The high-range close sets the stage for a steady to higher opening when Tuesday's session begins trading. Stochastics and the RSI are neutral to bullish signaling that sideways to higher prices are possible near-term. Closes above last-Friday's high crossing at $120.85 would signal that a short-term low has been posted. If May resumes this year's decline, monthly support crossing at $95.50 is the next downside target. First resistance is last-Friday's high crossing at $120.85. Second resistance is the 50-day moving average crossing at $124.11. First support is April's low crossing at $103.62. Second support is monthly support crossing at $95.50.
FOOD & FIBERhttp://quotes.ino.com/ex changes/?c=food
May coffee closed lower on Monday as it extends the decline off March's high. The low-range close sets the stage for a steady to lower opening on Monday. Stochastics and the RSI are oversold but remain neutral to bearish signaling that sideways to lower prices are possible near-term. If May extends this month's decline, March's low crossing at 10.14 is the next downside target. Closes above the 20-day moving average crossing at 11.54 would signal that a low has been posted.
July cocoa closed lower on Monday as it extends the decline off last Thursday's high. The low-range close sets the stage for a steady to lower opening on Tuesday. Stochastics and the RSI are turning neutral to bearish signaling that sideways to lower prices are possible near-term. If July extends the decline off March's high, March's low crossing at 10.13 is the next downside target. If July extends the rally off April's low, the 50-day moving average crossing at 24.57 is the next upside target.
July sugar closed sharply lower on Monday as it extends this year's decline. The low-range close set the stage for a steady to lower opening on Tuesday. Stochastics and the RSI are oversold but remain neutral to bearish signaling that sideways to lower prices are possible. If July extends the decline off February's high, monthly support crossing at 8.36 is the next downside target. Closes above the 20-day moving average crossing at 10.24 are needed to temper the near-term bearish outlook.
July cotton closed lower on Monday. The low-range close sets the stage for a steady to lower opening on Tuesday. Stochastics and the RSI have turned neutral to bearish signaling that sideways to lower prices are possible near-term. Closes below the 20-day moving average crossing at 53.02 would temper the near-term friendly outlook. If July extends the rally off March's low, the 50-day moving average crossing at 58.17 is the next upside target.
Thanks tallpine!
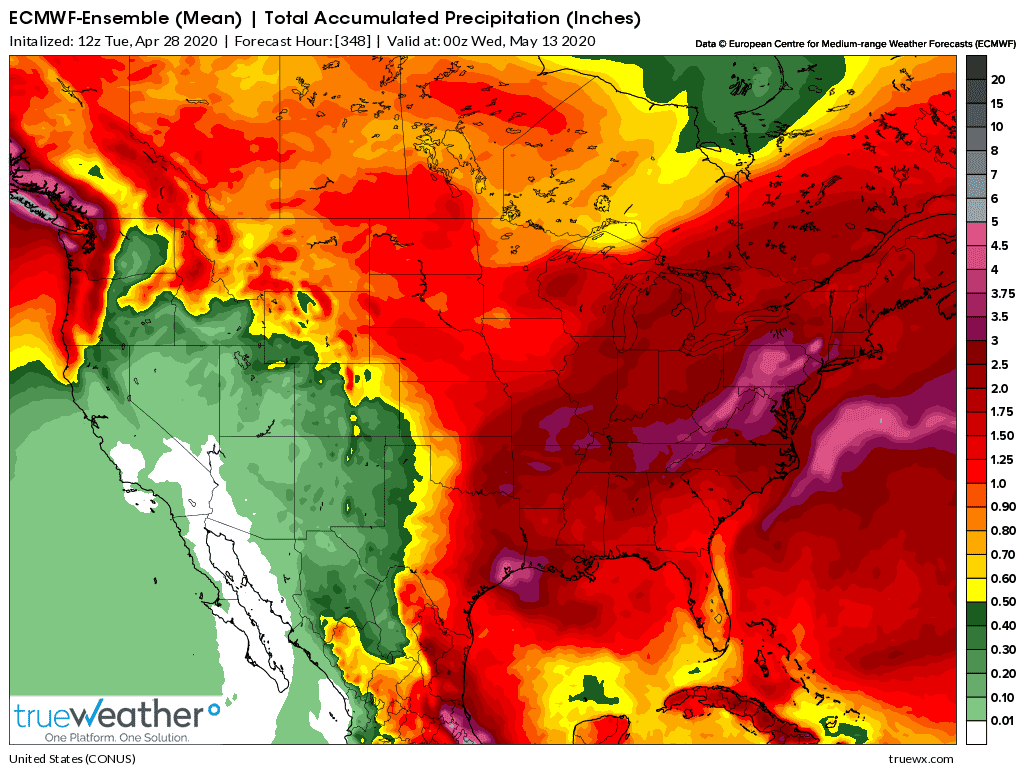
Below average rains for much of the Cornbelt the next 2 weeks is bearish for C and S because of favorable planting but a bit bullish for, especially HRW wheat because it looks driest in W.KS/OK/TX
Latest 2 week forecasts below from the GFS............a bit wetter in the S.Midwest and the drier European model below that.