KEY EVENTS TO WATCH FOR:
Thursday, April 30, 2020
8:30 AM ET. March Personal Income & Outlays
Personal Income, M/M% (previous +0.6%)
Consumer Spending, M/M% (previous +0.2%)
PCE Price Idx, M/M% (previous +0.1%)
PCE Price Idx, Y/Y% (previous +1.8%)
PCE Core Price Idx, M/M% (previous +0.2%)
PCE Core Price Idx, Y/Y% (previous +1.8%)
8:30 AM ET. Unemployment Insurance Weekly Claims Report - Initial Claims
Jobless Claims (previous 4427K)
Jobless Claims, Net Chg (previous -810K)
Continuing Claims (previous 15976000)
Continuing Claims, Net Chg (previous +4064K)
8:30 AM ET. 1st Quarter Employment Cost Index
ECI, Q/Q% (previous +0.7%)
ECI, Y/Y% (previous +2.7%)
8:30 AM ET. U.S. Weekly Export Sales
Corn (Metric Tons) (previous 670.8K)
Soybeans (Metric Tons) (previous 345.4K)
Wheat (Metric Tons) (previous 399.9K)
9:45 AM ET. Bloomberg Consumer Comfort Index
9:45 AM ET. April ISM-Chicago Business Survey - Chicago PMI
PMI-Adj (previous 47.8)
10:30 AM ET. EIA Weekly Natural Gas Storage Report
Working Gas In Storage (Cbf) (previous 2140B)
Working Gas In Storage, Net Chg (Cbf) (previous +43B)
3:00 AM ET. March Agricultural Prices
Farm Prices, M/M% (previous -2.2%)
4:30 PM ET. Foreign Central Bank Holdings
4:30 PM ET. Money Stock Measures
4:30 PM ET. Federal Discount Window Borrowings
N/A Foreign portfolio holdings of U.S. securities final results
Friday, May 1, 2020
9:45 AM ET. April US Manufacturing PMI
PMI, Mfg (previous 48.5)
10:00 AM ET. March Construction Spending - Construction Put in Place
New Construction (previous -1.3%)
Residential Construction
10:00 AM ET. April ISM Manufacturing Report on Business
Manufacturing PMI (previous 49.1)
Prices Idx (previous 37.4)
Employment Idx (previous 43.8)
Inventories (previous 46.9)
New Orders Idx (previous 42.2)
Production Idx (previous 47.7)
4:00 PM ET. April Domestic Auto Industry Sales
The STOCK INDEXES http://quotes.ino.com/exchanges/?c=indexes"
The STOCK INDEXES:The June NASDAQ 100 was lower due to profit taking in overnight trading. The low-range trade sets the stage for a steady to lower opening when the day session begins trading. Stochastics and the RSI are overbought but remain neutral to bullish signaling that sideways to higher prices are possible near-term. If June resumes the rally off March's low, the 87% retracement level of the February-March-decline crossing at 9384.61 is the next upside target. Closes below the 20-day moving average crossing at 8486.11 would confirm that a short-term top has been posted. First resistance is the 75% retracement level of the February-March-decline crossing at 9003.03. Second resistance is the 87% retracement level of the February-March-decline crossing at 9384.61. First support is the 20-day moving average crossing at 8486.11. Second support is the reaction low crossing at 8342.00.
The June S&P 500 was steady to slightly lower in late-overnight trading as it consolidates some of the rally off March's low. The low-range overnight trade sets the stage for a steady to lower opening when the day session begins trading later this morning.Stochastics and the RSI are overbought but remain neutral to bullish signaling that sideways to higher prices are possible near-term. If June extends the rally off March's low, the 75% retracement level of the February-March-decline crossing at 3081.80 is the next upside target. Closes below the 20-day moving average crossing at 2772.20 would confirm that a short-term top has been posted. First resistance is Wednesday's high crossing at 2957.70. Second resistance is the 75% retracement level of the February-March-decline crossing at 3081.80. First support is the 20-day moving average crossing at 2772.20. Second support is the reaction low crossing at 2720.20.
INTEREST RATES http://quotes.ino.com/ex changes/?c=interest"
INTEREST RATES: June T-bonds were slightly higher in late-overnight trading while extending this month's trading range. Stochastics and the RSI are neutral to bullish signaling that sideways to higher prices are possible near-term. If June renews the rally off March's low, the March 12th high crossing at 184-07 is the next upside target. Multiple closes below the reaction low crossing at 177-14 would confirm that a double top has been posted. First resistance is the March 12th high crossing at 184-07. Second resistance is March's high crossing at 191-22. First support is the reaction low crossing at 177-14. Second support is the 50-day moving average crossing at 176-17.
June T-notes were steady to slightly higher overnight. The high-range overnight trade sets the stage for a steady to higher opening with the day session begins trading. Stochastics and the RSI are turning neutral to bullish signaling that sideways to higher prices are possible near-term. If June extends the rally off March's low, March's high crossing at 140.240 is the next upside target. Closes below the April 7th low crossing at 138.160 would confirm that a short-term top has been posted while opening the door for additional weakness near-term. First resistance is last-Tuesday's high crossing at 139.220. Second resistance is March's high crossing at 140.240. First support is the April 7th low crossing at 138.160. Second support is the 50-day moving average crossing at 137.049.
ENERGY MARKETS? http://quotes.ino.com/ex?changes/?c=energy ""
June crude oil was higher in overnight trading.The high-range overnight trade sets the stage for a steady to higher opening when the day session begins trading. Stochastics and the RSI are turning neutral to bullish signaling that sideways to higher prices are possible near-term. Closes above the 20-day moving average crossing at 22.74 would signal that a short-term low has been posted. If June renews this year's decline, downside targets are unknown. First resistance is the 20-day moving average crossing at 22.74. Second resistance is the 50-day moving average crossing at 30.81. First support is last-Tuesday's low crossing at 6.50. Second support is unknown.
June heating oil was higher overnight as it consolidates some of this year's decline. The high-range overnight trade sets the stage for a steady to higher opening when the day session begins trading. Stochastics and the RSI are turning neutral to bullish signaling that sideways to higher prices are possible near-term. Closes above the 20-day moving average crossing at 92.30 are needed to confirm that a short-term low has been posted. If June extends this year's decline, the October-2001 low on the monthly continuation chart crossing at 49.30 is the next downside target. First resistance is the 20-day moving average crossing at 92.30. Second resistance is the 50-day moving average crossing at 113.29. First support is Tuesday's low crossing at 67.24. Second support is the October-2001 low on the monthly continuation chart crossing at 49.30.
June unleaded gas was higher overnight as it extends the March-April trading range. The high-range late-overnight trade sets the stage for a steady to higher opening when the day session begins trading. Stochastics and the RSI are neutral to bullish signaling that sideways to higher prices are possible near-term. Closes above the reaction high crossing at 82.72 would signal that a short-term low has been posted. Closes below March's low crossing at 51.89 would confirm a downside breakout of the aforementioned trading range. First resistance is the reaction high crossing at 82.72. Second resistance is the 25% retracement level of the January-March-decline crossing at 88.30. First support is March's low crossing at 51.89. Second support is monthly support crossing at 32.40.
June Henry natural gas was lower overnight. The low-range overnight trade sets the stage for a steady to lower opening when the day session begins trading. Stochastics and the RSI are neutral to bearish signaling that sideways to lower prices are possible near-term. If June extends the decline off April's high, the April 16th low crossing at 1.705 is the next downside target. If June renews the rally off April's low, the 50% retracement level of the 2019-2020-low crossing at 2.154 is the next upside target. First resistance is March's high crossing at 2.108. Second resistance is the 50% retracement level of the 2019-2020-low crossing at 2.154. First support is Monday's low crossing at 1.765. Second support is the April 16th low crossing at 1.705. Third support is April's low crossing at 1.649.
CURRENCIEShttp://quotes.ino.com/ex changes/?c=currencies"
CURRENCIES:The June Dollar was steady to slightly lower in late-overnight trading. The low-range overnight trade sets the stage for a steady to lower opening when the day session begins trading. Stochastics and the RSI are neutral to bearish signaling that sideways to lower prices are possible near-term. If June resumes the decline off March's high, the 62% retracement level of March's rally crossing at 98.14 is the next downside target. If June renews the rally off April's low, the April 6th high crossing at 101.03 is the next upside target.First resistance is the April 6th high crossing at 101.03. Second resistance is March's high crossing at 103.96. First support is the 50% retracement level of March's rally crossing at 99.24. Second support is the 62% retracement level of March's rally crossing at 98.13.
The June Euro was steady to slightly higher in late-overnight trading as it extends the rally off last-Friday's low. The high-range overnight trade sets the stage for a steady to higher opening when the day session begins trading. Stochastics and the RSI are neutral to bullish signaling that sideways to higher prices are possible near-term. Closes above the 50-day moving average crossing at 109.93 would confirm that a short-term low has been posted. If June renews this month's decline, March's low crossing at 106.71 is the next downside target. First resistance is April's high crossing at 110.07. Second resistance is the March 27th high crossing at 111.88. Third resistance is the March 16th high crossing at 112.78. First support is last-Friday's low crossing at 107.39. Second support is March's low crossing at 106.71.
The June British Pound was higher overnight.The high-range overnight trade sets the stage for a steady to higher opening when the day session beings trading. Stochastics and the RSI have turned neutral to bullish signaling that sideways to higher prices are possible near-term. If June resumes the rally off March's low the 62% retracement level of the December-March-decline crossing at 1.2758 is the next upside target. Closes below last-Tuesday's low crossing at 1.2252 would open the door for a possible test of the April 7th low crossing at 1.2174. First resistance is the April 14th high crossing at 1.2653. Second resistance is the 62% retracement level of the December-March-decline crossing at 1.2758. First support is last-Tuesday's low crossing at 1.2252. Second support is the April 7th low crossing at 1.2174.
The June Swiss Franc was higher in late-overnight trading. The high-range overnight trade sets the stage for a steady to higher opening when the day session begins trading. Stochastics and the RSI are turning neutral to bullish signaling that sideways to higher prices are possible near-term. Closes above the 50-day moving average crossing at 1.0399 are needed to confirm that a short-term low has been posted. If June extends the decline off April's high, March's low crossing at 1.0138 is the next downside target. First resistance is the April 14th high crossing at 1.0443. Second resistance is the March 30th high crossing at 1.0566. First support is last-Friday's low crossing at 1.0216. Second is March's low crossing at 1.0138.
The June Canadian Dollar was higher overnight as it extends the rally off March's low. Stochastics and the RSI are neutral to bullish signaling that sideways to higher prices are possible near-term. If June extends the rally off March's low, the 50% retracement level of the January-March-decline crossing at 72.73 is the next upside target.If June renews the aforementioned decline, the March 31st low crossing at 69.73 is the next downside target. First resistance is 50% retracement level of the January-March-decline crossing at 72.73. Second resistance is the 62% retracement level of the January-March-decline crossing at 73.80. First support is last-Tuesday's low crossing at 70.12. Second support is the March 31st low crossing at 69.74. Third support is March's low crossing at 68.20.
The June Japanese Yen was steady to slightly higher overnight as it extends the rally off March's low. The mid-range overnight trade sets the stage for a steady to higher opening when the day session begins trading. Stochastics and the RSI are overbought but remain neutral to bullish signaling that sideways to higher prices are possible near-term. If June extends the rally off March's low, the 25% retracement level of the 2016-2020 decline crossing at 0.0943 is the next upside target. Closes below the 50-day moving average crossing at 0.0929 would temper the near-term friendly outlook. First resistance is Wednesday's high crossing at 0.0941. Second resistance is the 25% retracement level of the 2016-2020-decline crossing at 0.0943. First support is April's low crossing at 0.0916. Second support is March's low crossing at 0.0900.
PRECIOUS METALS http://quotes.ino.com/ex changes/?c=metals"
PRECIOUS METALS: June gold was slightly higher in late-overnight trading. The mid-range overnight trade sets the stage for a steady to higher opening when the day session begins trading. Stochastics and the RSI are neutral to bearish signaling that sideways to lower prices are possible near-term. Closes below last-Tuesday's low crossing at $1666.20 would confirm that a short-term top has been posted while renewing the decline off April's high. If June renews the rally off March's low, the October-2012 high on the monthly continuation chart crossing at $1798.10 is the next upside target. First resistance is the April 14th high crossing at $1788.80. Second resistance is the October-2012 high on the monthly continuation chart crossing at $1798.10. First support is last-Tuesday's low crossing at $1666.20. Second support is the 50-day moving average crossing at $1653.60.
July silver was higher overnight. The mid-range overnight trade sets the stage for a steady to higher opening when the day session begins trading later this morning. Stochastics and the RSI are turning neutral to bullish signaling that sideways to higher prices are possible near-term. Closes below last-Tuesday's low crossing at $14.715 would confirm that a short-term top has been posted. If July renews the rally off March's low, the 75% retracement level of the February-March-decline crossing at $17.237 is the next upside target. First resistance is the 62% retracement level of the February-March-decline crossing at $16.252. Second resistance is the 75% retracement level of the February-March-decline crossing at $17.237. First support is last-Tuesday's low crossing at $14.715. Second support is April's low crossing at $13.935.
July copper was steady to slightly higher in late-overnight trading. The mid-range overnight trade sets the stage for a steady to higher opening when the day session begins trading. Stochastics and the RSI are overbought but remain neutral to bullish signaling that sideways to higher prices are possible near-term. If July extends the rally off March's low, the 50% retracement level of the January-March-decline crossing at 2.4380 is the next upside target. Closes below last-Tuesday's low crossing at 2.2170 would signal that a short-term top has been posted. First resistance is the overnight high crossing at 2.3950. Second resistance is the 50% retracement level of the January-March-decline crossing at 2.4380. First support is last-Tuesday's low crossing at 2.2170. Second support is March's low crossing at 1.9795.
GRAINS http://quotes.ino.com/ex changes/?c=grains
July corn was steady to fractionally higher overnight as it consolidated some of this week's decline. The low-range trade sets the stage for a steady to lower opening when the day sessions begins trading. Stochastics and the RSI are oversold, diverging but remain neutral to bearish signaling that sideways to lower prices are possible near-term. If July resumes the decline off December's high, psychological support crossing at $3.00 is the next downside target. Closes above the 20-day moving average crossing at $3.27 are needed to confirm that a short-term low has been posted. First resistance is the 20-day moving average crossing at $3.27. Second resistance is the 50-day moving average crossing at $3.50 1/4. First support is last-Tuesday's low crossing at $3.09. Second support is psychological support crossing at $3.00.
July wheat was lower overnight as it extends this month's decline. The low-range trade sets the stage for a steady to lower opening when the day session begins trading. Stochastics and the RSI are oversold but remain neutral to bearish signaling that sideways to lower prices are possible near-term. If July extends the decline off March's high, the 87% retracement level of March's rally crossing at $5.04 1/4 is the next downside target. Closes above the 20-day moving average crossing at $5.39 3/4 would temper the near-term bearish outlook. First resistance is the 10-day moving average crossing at $5.32 3/4. Second resistance is the 20-day moving average crossing at $5.39 3/4. First support is the 75% retracement level of March's rally crossing at $5.13 1/2. Second support is 87% retracement level of March's rally crossing at $5.04 1/4.
July Kansas City Wheat closed down $0.06 3/4-cents at $4.77.
July Kansas City wheat closed lower on Wednesday as it extends the decline off last-Monday's high. The low-range close sets the stage for a steady to lower opening when Thursday night session begins trading. Stochastics and the RSI are neutral to bearish signaling that sideways to lower prices are possible near-term. Closes below the 50-day moving average crossing at $4.75 1/2 are needed to confirm that a short-term top has been posted. If July resumes the rally off March's low, January's high crossing at $5.19 is the next upside target. First resistance is April's high crossing at $5.14. Second resistance is January's high crossing at $5.19. First support is the 50-day moving average crossing at $4.75 1/2. Second support is April's low crossing at $4.67 3/4.
July Minneapolis wheat was lower overnight. The mid-range overnight trade sets the stage for a steady to lower opening when the day session begins trading. Stochastics and the RSI are oversold but remain neutral to bearish signaling that sideways to lower prices are possible near-term. If July extends this year's decline psychological support crossing at $5.00 is the next downside target. Closes above the 50-day moving average crossing at $5.30 3/4 are needed to confirm that a short-term low has been posted. First resistance is the 10-day moving average crossing at $5.14 3/4. Second resistance is the 20-day moving average crossing at $5.24 1/2. Third resistance is the 50-day moving average crossing at $5.30 3/4. First support is Wednesday's low crossing at $5.05 3/4. Second support is psychological support crossing at $5.00.
SOYBEAN COMPLEX? http://quotes.ino.com/ex?changes/?c=grains "
July soybeans were higher overnight. The high-range trade sets the stage for a steady to higher opening when the day session begins trading. Stochastics and the RSI are turning neutral to bullish signaling that sideways to higher prices are possible near-term. Closes above the 20-day moving average crossing at $8.49 1/4 are needed to signal that a short-term low has been posted. If July renews the decline off the March 25th high, psychological support crossing at $8.00 is the next downside target. First resistance is the 20-day moving average crossing at $8.49 1/4. Second resistance is the 50-day moving average crossing at $8.70. First support is last-Tuesday's low crossing at $8.18 1/2. Second support is psychological support crossing at $8.00.
July soybean meal was slightly higher overnight. The high-range trade sets the stage for a steady to higher opening when the day session begins trading. Stochastics and the RSI are neutral to bearish signaling that sideways to lower prices are possible near-term. If July extends this year's decline, monthly support crossing at $283.10 is the next downside target. Closes above the 20-day moving average crossing at $294.90 are needed to confirm that a short-term low has been posted. First resistance is the 20-day moving average crossing at $294.90. Second resistance is the 50-day moving average crossing at 303.30. First support is Wednesday's low crossing at $285.60. Second support is monthly support crossing at $283.10.
July soybean oil was higher overnight. The high-range trade sets the stage for a steady to higher opening when the day session begins trading. Stochastics and the RSI are neutral to bullish signaling that a low might be in or is near. Closes above the 20-day moving average crossing at 26.61 would temper the near-term bearish outlook. If July renews the decline off April's high, March's low crossing at 25.02 is the next downside target. First resistance is the 25% retracement level of the January-March-decline crossing at 27.84. Second resistance is the 38% retracement level of the January-March-decline crossing at 29.32. First support is last-Friday's low crossing at 25.09. Second support is March's low crossing at 25.02.
LIVESTOCKhttp://quotes.ino.com/exchanges/?c=livestock
June hogs closed down $0.68 at $55.53.
June hogs closed lower on Wednesday as it consolidates some of the rally off April's low. The low-range close sets the stage for a steady to lower opening when Thursday's night session begins trading. Stochastics and the RSI remain neutral to bullish signaling that sideways to higher prices are possible near-term. If June extends the aforementioned rally the 38% retracement level of the 2019-2020 decline crossing at $62.16 is the next upside target. Closes below the 20-day moving average crossing at $49.68 would confirm that a short-term top has been posted. First resistance is Tuesday's high crossing at $60.78. Second resistance is the 38% retracement level of the 2019-2020 decline crossing at $62.16. First support is the 20-day moving average crossing at $49.68. Second support is April's low crossing at $41.50.
June cattle closed down $0.43 at $84.28.
June cattle closed lower on Wednesday as it continues to form a symmetrical Triangle. The low-range close sets the stage for a steady to lower opening on Thursday. Stochastics and the RSI are neutral signaling that sideways trading is possible near-term. If June resumes this year's decline, monthly support crossing at $69.29 is the next downside target. Closes above the reaction high crossing at $88.13 are needed to confirm that a short-term low has been posted. First resistance is the reaction high crossing at $88.13. Second resistance is the 50-day moving average crossing at $92.42. First support is April's low crossing at $76.60. Second support is monthly support crossing at $69.29.
May Feeder cattle closed up $0.05-cents at $118.55.
May Feeder cattle closed higher on Wednesday. The mid-range close sets the stage for a steady to higher opening when Thursday's session begins trading. Stochastics and the RSI are neutral to bullish signaling that sideways to higher prices are possible near-term. Closes above the reaction high crossing at $120.85 would signal that a short-term low has been posted. If May resumes this year's decline, monthly support crossing at $95.50 is the next downside target. First resistance is the reaction high crossing at $120.85. Second resistance is the 50-day moving average crossing at $123.11. First support is April's low crossing at $103.62. Second support is monthly support crossing at $95.50.
FOOD & FIBERhttp://quotes.ino.com/ex changes/?c=food
July coffee closed lower on Wednesday as it extends the decline off March's high. The low-range close sets the stage for a steady to lower opening on Thursday. Stochastics and the RSI are oversold but remain neutral to bearish signaling that sideways to lower prices are possible near-term. If July extends this month's decline, March's low crossing at 10.31 is the next downside target. Closes above the 20-day moving average crossing at 11.54 would signal that a low has been posted.
July cocoa closed higher on Wednesday. The high-range close sets the stage for a steady to higher opening on Thursday. Stochastics and the RSI are turning neutral to bullish signaling that sideways to higher prices are possible near-term. If July extends the rally off April's low, the 50-day moving average crossing at 24.36 is the next upside target. If July extends the decline off March's high, March's low crossing at 10.13 is the next downside target.
July sugar closed higher on Wednesday as it consolidates some of this year's decline. The high-range close set the stage for a steady to higher opening on Thursday. Stochastics and the RSI are oversold but are turning neutral to bullish signaling that sideways to higher prices are possible. Closes above the 20-day moving average crossing at 10.15 are needed to temper the near-term bearish outlook. If July extends the decline off February's high, monthly support crossing at 8.36 is the next downside target.
July cotton closed higher on Wednesday. The high-range close sets the stage for a steady to higher opening on Thursday. Stochastics and the RSI are turning neutral to bullish signaling that sideways to higher prices are possible near-term. If July extends the rally off March's low, the 50-day moving average crossing at 57.65 is the next upside target. Closes below the 20-day moving average crossing at 53.59 would temper the near-term friendly outlook.
Thanks tallpine!
Great export sales this morning.
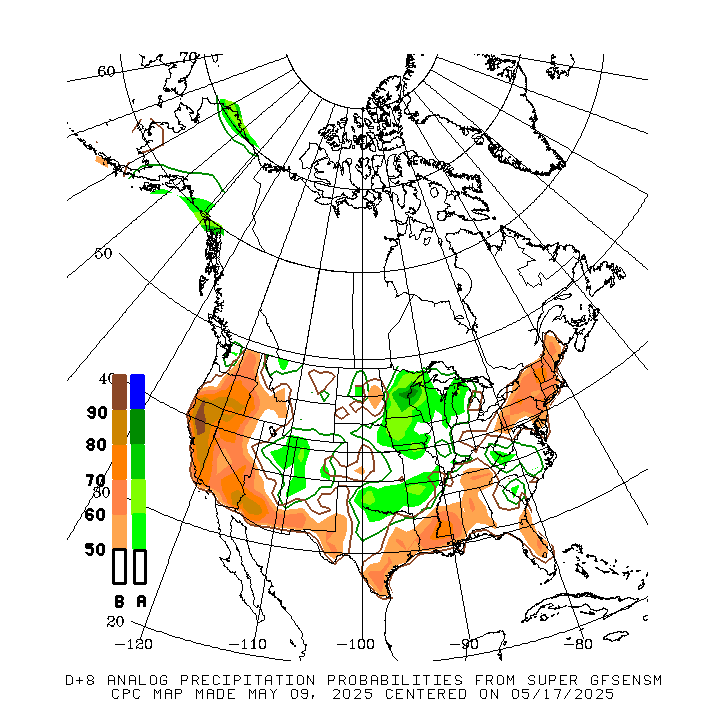
After last years excessively wet planting season in some places, the market has been most considered with more planting delays and too much rain..............even as dryness is creeping in.
We could be turning the corner and making dryness bullish if the drier pattern coming up the next 2 weeks continues!
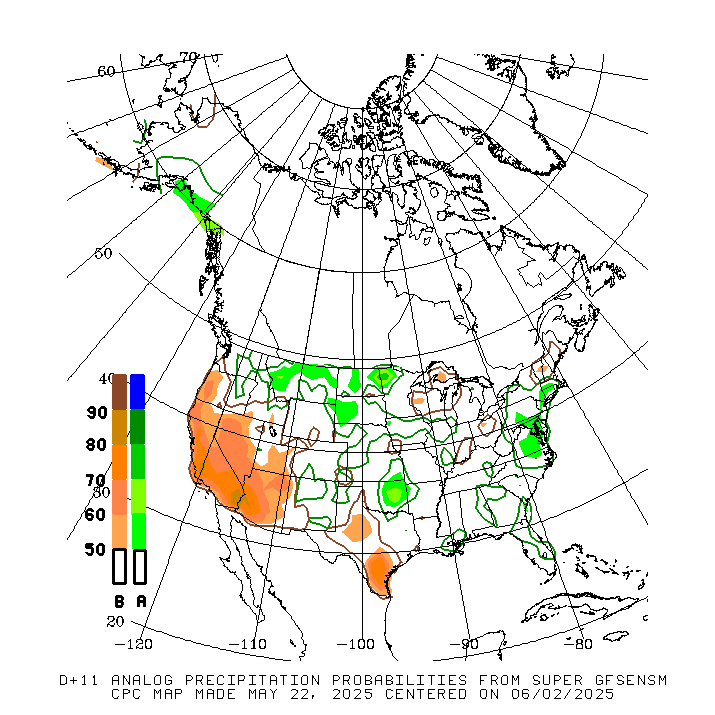
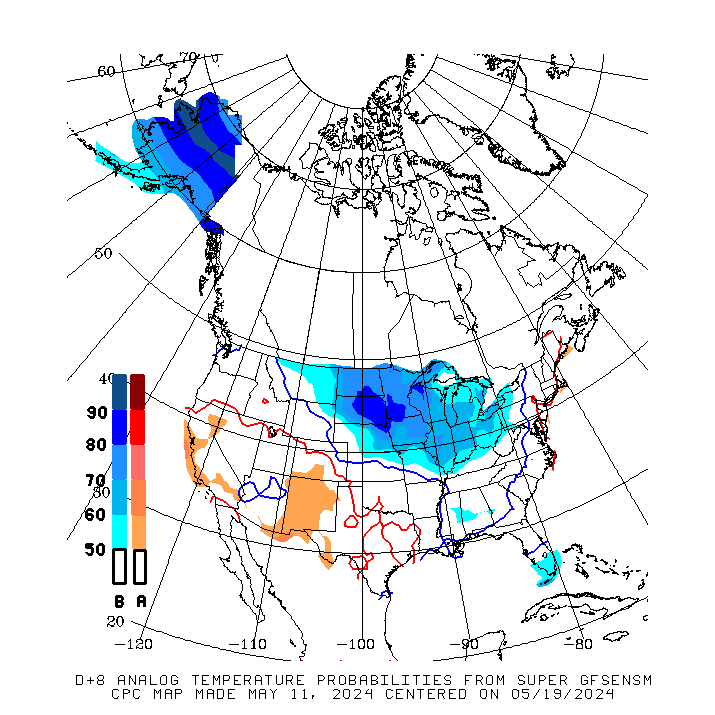
The product below is a GFS ensemble product/tool that will go into todays 6-10 day and 8-14 day forecast.
Look how cold the anomalies are for the Eastern half of the Country!! Even a freeze threat for the SRW crop in early May!