KEY EVENTS TO WATCH FOR:
Monday, May 4, 2020
9:45 AM ET. April ISM-NY Report on Business
Business Index (previous 12.9)
10:00 AM ET. March Manufacturers' Shipments, Inventories & Orders (M3)
Total Orders, M/M% (previous +0.0%)
Orders, Ex-Defense, M/M% (previous -0.6%)
Orders, Ex-Transport, M/M% (previous -0.9%)
Durable Goods, M/M% (previous +1.2%)
Durable Goods, M/M%
11:00 AM ET. April Global Manufacturing PMI
PMI, Mfg (previous 47.6)
11:30 AM ET. Federal Reserve Board of Governors closed meeting
The STOCK INDEXES? http://quotes.ino.com/ex?changes/?c=indexes
The Dow gapped down and closed sharply lower on Friday as investors showed disappointment with earnings from big tech companies and with President Donald Trump’s threat to impose import tariffs on China in retaliation for its handling of the COVID-19 pandemic. The low-range close that sets the stage for a steady to lower opening when Monday's night session begins trading. Stochastics and the RSI are overbought, diverging and are turning neutral to bearish signaling that a short-term top might be in or is near. Closes below the 20-day moving average crossing at 23,528.63 would confirm that a short-term top has been posted. If the Dow extends the rally off March's low, the 62% retracement level of the February-March-decline crossing at 25,199.76 is the next upside target. First resistance is Wednesday's high crossing at 24,764.77. Second resistance is the 62% retracement level of the February-March-decline crossing at 25,199.76. First support is the 20-day moving average crossing at 23,528.63. Second support is April's low crossing at 20,735.02.
The June NASDAQ 100 closed lower on Friday as it consolidates some of the rally off March's low. The low-range close sets the stage for a steady to lower opening when Monday's night session begins trading. Stochastics and the RSI are overbought, diverging and are turning neutral to bearish signaling that a short-term top might be in or is near. Closes below the 20-day moving average crossing at 8531.59 would signal that a short-term top has been posted. If June extends the rally off March's low, the 87% retracement level of the February-March-decline crossing at 9384.61 is the next upside target. First resistance is Thursday's high crossing at 9144.75. Second resistance is the 87% retracement level of the January-March-decline crossing at 9384.61. First support is the 20-day moving average crossing at 8531.59. Second support is the April 7th low crossing at 7948.00.
The June S&P 500 closed lower due to profit taking on Friday as it consolidates some of the rally off March's low. The low-range close sets the stage for a steady to lower opening when Monday's night session begins trading. Stochastics and the RSI are turning neutral to bearish signaling that sideways to lower prices are possible near-term. Closes below the 20-day moving average crossing at 2785.63 would confirm that a short-term top has been posted. If March extends the rally off March's low, the 75% retracement level of the February-March-decline crossing at 3085.85 is the next upside target. First resistance is Wednesday's high crossing at 2957.70. Second resistance is the 75% retracement level of the February-March-decline crossing at 3085.85. First support is the 20-day moving average crossing at 2785.63. Second support is April's low crossing at 2448.00.
INTEREST RATES? http://quotes.ino.com/ex?changes/?c=interest ""
June T-bonds closed up 2/32's at 181-03.
June T-bonds closed lower on Friday while extending this month's trading range.The low-range close sets the stage for a steady to lower opening when Monday's night session begins trading. Stochastics and the RSI are turning neutral to bearish signaling that sideways to lower prices are possible near-term. Closes below the April 14th low crossing at 177-14 would confirm that a short-term top has been posted while opening the door for a possible test of the 50-day moving average crossing at 177-07. If June renews the rally off March's low, March's high crossing at 191-22. First resistance is last-Wednesday's high crossing at 183-02. Second resistance is the March 12th high crossing at 184-07. First support is the April 14th low crossing at 177-14. Second support is the 50-day moving average crossing at 177-07.
June T-notes closed down 30-points at 138.310.
June T-notes closed lower on Friday while extending this month's trading range. The low-range close sets the stage for a steady to lower opening when Monday's night session begins trading. Stochastics and the RSI are neutral to bearish signaling that sideways to lower prices are possible near-term. Closes below the April 7th low crossing at 137.160 would confirm that a short-term top has been posted. If June renews the rally off March's low, March's high crossing at 140.240 is the next upside target. First resistance is last-Tuesday's high crossing at 139.220. Second resistance is March's high crossing at 140.240. First support is the April 7th low crossing at 137.160. Second support is the 50-day moving average crossing at 137.096.
ENERGY MARKETS? http://quotes.ino.com/ex?changes/?c=energy ""
June crude oil closed higher on Friday as it extends the rally off April's low. The high-range close sets the stage for a steady to higher opening when Monday's night session begins. Stochastics and the RSI are neutral to bullish signaling that sideways to higher prices are possible near-term. Closes above the 20-day moving average crossing at $22.43 are needed to confirm that a short-term low has been posted. If June renews this year's decline, zero is the next downside target. First resistance is the 20-day moving average crossing at $22.43. Second resistance is the 50-day moving average crossing at $30.15. First support is April's low crossing at $6.50. Second support is zero.
June heating oil closed lower on Friday. The low-range close sets the stage for a steady to lower opening when Monday's night trading session begins. Stochastics and the RSI are neutral to bullish signaling that a low might be in or is near. Closes above the 20-day moving average crossing at $91.26 are needed to confirm that a short-term low has been posted. If June extends this year's decline, the October 2001 low on the monthly continuation chart crossing at $49.30 is the next downside target. First resistance is the 20-day moving average crossing at $91.26. Second resistance is the reaction high crossing at $116.02. First support is Tuesday's low crossing at $67.24. Second support is the October 2001 low on the monthly continuation chart crossing at $49.30.
June unleaded gas posted an inside day with a lower close on Friday. The low-range close sets the stage for a steady to lower opening when Monday's night session begins trading. Stochastics and the RSI are neutral to bullish signaling that sideways to higher prices are possible near-term. Closes above the reaction high crossing at 82.72 would confirm that a short-term low has been posted. Closes below March's low crossing at 51.89 would renew this year's decline. First resistance is the 25% retracement level of the January-March-decline crossing at 88.30. Second resistance is the 38% retracement level of the January-March-decline decline crossing at 107.64. First support is March's low crossing at 51.89. Second support is monthly supportcrossing at 32.40.
June Henry natural gas closed lower on Friday. The low-range close sets the stage for a steady to lower opening when Monday's night session begins trading. Stochastics and the RSI are neutral signaling that sideways trading is possible near-term. If June renews the rally off April's low, the 50% retracement level of the 2019-2020 decline crossing at 2.154 is the next upside target. If June extends the decline off April's high, the April 14th low crossing at 1.705 is the next downside target. First resistance is April's high crossing at 2.100. Second resistance is the 50% retracement level of the 2019-2020 decline crossing at 2.154. First support is the April 14th low crossing at 1.705. Second support is April's low crossing at 1.649.
CURRENCIES? http://quotes.ino.com/ex?changes/?c=currencies ""
The June Dollar closed slightly higher on Friday but remains below the 50-day moving average crossing at 99.31 confirming that a short-term top has been posted. The high-range close sets the stage for a steady to higher opening when Monday's night session begins trading. Stochastics and the RSI are neutral to bearish signaling that sideways to lower prices are possible near-term. If June extends this week's decline the 62% retracement level of March's rally crossing at 98.14 is the next downside target. Closes above the 10-day moving average crossing at 99.96 would temper the near-term bearish outlook. First resistance is the April 6th high crossing at 101.03. Second resistance is March's high crossing at 103.96. First support is April's low crossing at 98.81. Second support is the March 27thlow crossing at 98.34. Third support is the 62% retracement level of March's rally crossing at 98.14.
The June Euro closed higher on Friday as it extends the rally off last-Friday's low. The mid-range close sets the stage for a steady to higher opening when Monday's night session begins trading. Stochastics and the RSI are neutral to bullish signaling that sideways to higher prices are possible near-term. Closes above the 50-day moving average crossing at 109.97 are needed to confirm that a short-term low has been posted. If June resumes the decline off the March 27th high, March's low crossing at 106.71 is the next downside target. First resistance is today's high crossing at 110.29. Second resistance is the March 27th high crossing at 111.88. First support is April's low crossing at 107.39. Second support is March's low crossing at 106.71.
The June British Pound posted an inside day with a lower close on Friday. The low-range close sets the stage for a steady to lower opening when Monday's night session begins trading. Stochastics and the RSI are neutral to bullish signaling that sideways to higher prices are possible near-term. Thursday's close above the 50-day moving average crossing at 1.2468 confirms that a short-term low has been posted. If June extends Thursday's rally, the 62% retracement level of the December-March-decline crossing at 1.2758 is the next upside target. If June resumes the decline off the April-14th high crossing at 1.2653, the April 7th low crossing at 1.2174 is the next downside target. First resistance is the 62% retracement level of the December-March-decline crossing at 1.2758. Second resistance is the 75% retracement level of the December-March-decline crossing at 1.3042. First support is the April 7th low crossing at 1.2174. Second support is March's low crossing at 1.1438.
The June Swiss Franc closed higher on Friday and above the 50-day moving average crossing at 1.0403 confirming that a short-term low has been posted. The high-range close sets the stage for a steady to higher opening when Monday's night session begins trading. Stochastics and the RSI are neutral to bullish signaling that sideways to higher prices are possible near-term. If June extends this week's rally, the March 30th high crossing at 1.0566 is the next upside target. Closes below the 10-day moving average crossing at 1.0315 would confirm that a short-term top has been posted. First resistance April's high crossing at 1.0443. Second resistance is the March 30th high crossing at 1.0566. First support is April's low crossing at 1.0216. Second support is March's low crossing at 1.0138.
The June Canadian Dollar closed lower on Friday.The low-range close sets the stage for a steady to lower opening when Monday's night session begins trading. Stochastics and the RSI are turning neutral to bearish signaling that sideways to lower prices are possible near-term. Closes below last-Tuesday's low crossing at 70.12 would confirm that a short-term top has been posted. If June extends the rally off March's low, the 50% retracement level of the January-March-decline crossing at 72.73 is the next upside target.First resistance is the 50-day moving average crossing at 71.91. Second resistance is the 50% retracement level of the January-March-decline crossing at 72.73. First support is April's low crossing at $70.12. Second support is the March 31st low crossing at 69.73. Third support is March's low crossing at 68.20.
The June Japanese Yen closed higher on Friday. The high-range close sets the stage for a steady to higher opening when Monday’s night session begins trading. Stochastics and the RSI have turned neutral to bearish signaling that sideways to lower prices are possible near-term. Closes below April's low crossing at 0.0916 would confirm that a short-term top has been posted. If June renews the rally off March's low, long-term resistance crossing at 0.0942 is the next upside target. First resistance is long-term resistance crossing at 0.0942. Second resistance is March's high crossing at 0.0992. First support is April's low crossing at 0.0916. Second support is March's low crossing at 0.0900.
PRECIOUS METALS? http://quotes.ino.com/ex?changes/?c=metals ""
June gold closed higher on Friday. The high-range close sets the stage for a steady to higher opening when Monday's night session begins trading. Stochastics and the RSI are neutral to bearish signaling that sideways to lower prices are possible near-term. Closes below last-Tuesday's low crossing at $1666.20 would confirm that a short-term top has been posted while opening the door for additional weakness near-term. If April renews the rally off March's low, the October-2012 high on the monthly continuation chart crossing at $1798.10 is the next upside target. First resistance is April's high crossing at $1788.80. Second resistance is the October-2012 high on the monthly continuation chart crossing at $1798.10. First support is last-Tuesday's low crossing at $1666.20. Second support is the 50-day moving average crossing at $1654.60.
July silver closed slightly higher on Friday leaving yesterday's key reversal down unconfirmed. The high-range close set the stage for a steady to higher opening when Monday's night session begins trading. Stochastics and the RSI are neutral to bearish signaling that sideways to lower prices are possible near-term. Closes below last-Tuesday's low crossing at 14.715 would confirm that a short-term top has been posted. If July resumes the rally off March's low, the 75% retracement level of the February-March-decline crossing at 17.237 is the next upside target.First resistance is the 62% retracement level of the February-March-decline crossing at 16.252. Second resistance is the 75% retracement level of the February-March-decline decline crossing at 17.237 is the next upside target. First support is last-Tuesday's low crossing at 14.715. Second support is the April 1st low crossing at 13.935.
July copper closed lower on Friday as it consolidates some of the rally off March's low. The low-range close sets the stage for a steady to lower opening when Friday's night session begins trading. Stochastics and the RSI are turning neutral to bearish signaling that a short-term top might be in or is near. Closes below last-Tuesday's low crossing at 221.70 would confirm that a short-term top has been posted. If July extends the rally off March's low, the 50% retracement level of the January-March-decline crossing at 243.80 is the next upside target. First resistance is Thursday's high crossing at 239.50. Second resistance is the 50% retracement level of the January-March-decline crossing at 243.80. First support is last-Tuesday's low crossing at 221.70. Second support is March's low crossing at 197.95.
GRAINS? http://quotes.ino.com/ex?changes/?c=grains "
July Corn closed down $0.02-cents at 3.18.
July corn posted an inside day with a lower close on Friday. The mid-range close sets the stage for a steady to lower opening when Monday's night sessions begins trading. Stochastics and the RSI are neutral to bullish signaling that sideways to higher prices are possible near-term. Closes above the 20-day moving average crossing at $3.26 are needed to confirm that a short-term low has been posted. If July renews this year's decline, psychological support crossing at $3.00 is the next downside target. First resistance is the 20-day moving average crossing at 3.26. Second resistance is the 38% retracement level of the January-March-decline crossing at $3.45 3/4. First support is last-Tuesday's low crossing at $3.09. Second support is psychological support crossing at $3.00.
July wheat closed down $0.08 3/4-cents at $5.15 1/2.
July wheat closed lower on Friday as it extends the decline off last-Monday's high. The low-range close sets the stage for a steady to lower opening when Monday's night session begins trading. Stochastics and the RSI are turning neutral to bullish signaling that a short-term low might be in or is near. Closes above the 20-day moving average crossing at $5.39 would signal that a short-term low has been posted. If July extends the decline off March's low, the 87% retracement level of March's rally crossing at $5.04 1/4. First resistance is April's high crossing at $5.64 1/2. Second resistance is March's high crossing at $5.71 1/2. First support is Thursday's low crossing at $5.06 3/4. Second support is the 87% retracement level of March's rally crossing at $5.04 1/4.
July Kansas City Wheat closed down $0.05-cents at $4.83.
July Kansas City wheat closed lower on Friday. The mid-range close sets the stage for a steady to lower opening when Monday night session begins trading. Stochastics and the RSI are turning neutral to bullish signaling that sideways to higher prices are possible near-term. Closes above the 10-day moving average crossing at $4.89 are needed to temper the near-term bearish outlook. Closes below the 50-day moving average crossing at $4.75 1/4 would confirm that a short-term top has been posted. If July resumes the rally off March's low, January's high crossing at $5.19 is the next upside target.First resistance is April's high crossing at $5.14. Second resistance is January's high crossing at $5.19. First support is the 50-day moving average crossing at $4.75 1/4. Second support is April's low crossing at $4.67 3/4.
July Minneapolis wheat closed down $0.08 3/4-cents at $5.06 3/4.
July Minneapolis wheat closed lower on Friday leaving yesterday's key reversal up unconfirmed. The low-range close sets the stage for a steady to lower opening when Monday's night session begins trading. Stochastics and the RSI are oversold but remain neutral to bearish signaling that sideways to lower prices are possible near-term. If July extends this year's decline, psychological support crossing at $5.00 is the next downside target. Closes above the 50-day moving average crossing at $5.30 are needed to confirm that a short-term low has been posted. First resistance is the 20-day moving average crossing at $5.23 3/4. Second resistance is the 50-day moving average crossing at 5.30. First support is Thursday's low crossing at $5.04. Second support is psychological support crossing at $5.00.
SOYBEAN COMPLEX? http://quotes.ino.com/ex?changes/?c=grains "
July soybeans closed down $0.06 1/4-cents at $8.49.
July soybeans closed lower on Friday. The low-range close sets the stage for a steady to lower opening when Monday's night session begins trading. Stochastics and the RSI are neutral to bullish signaling that sideways to higher prices are possible near-term. Closes above the 50-day moving average crossing at $8.69 are needed to confirm that a short-term low has been posted. If July resumes this year's decline, psychological support crossing at $8.00 is the next downside target. First resistance is Thursday's high crossing at $8.56. Second resistance is the 50-day moving average crossing at $8.69. First support is April's low crossing at $8.18 1/2. Second support is psychological support crossing at $8.00.
July soybean meal closed down $2.90 at $292.20.
July soybean meal closed lower on Friday. The low-range close sets the stage for a steady to lower opening when Monday's night session begins trading. Stochastics and the RSI are neutral to bullish signaling that sideways to higher prices are possible near-term. If July extends Thursday's rally, the 50-day moving average crossing at $303.20 is the next upside target. Closes above the 50-day moving average crossing at $303.20 are needed to confirm that a short-term low has been posted. If July resumes the decline off March's high, monthly support crossing at $283.10 is the next downside target. First resistance is today's high crossing at $295.80. Second is the 50-day moving average crossing at $303.20. First support is Wednesday's low crossing at $285.60. Second support is monthly support crossing at $283.10.
July soybean oil closed down 9-pts. At 26.51.
July soybean oil closed lower on Friday. The high-range close sets the stage for a steady to higher opening when Monday's night session begins trading. Closes above the 20-day moving average crossing at 26.61 would temper the near-term bearish outlook. Stochastics and the RSI are neutral to bullish signaling that sideways to higher prices are possible near-term. If July renews the decline off April's high, March's low crossing at 25.02 is the next downside target. First resistance is the 20-day moving average crossing at 26.61. Second resistance is the 50-day moving average crossing at 27.35. First support is Monday's low crossing at 25.09. Second support is March's low crossing at 25.02.
LIVESTOCKhttp://quotes.ino.com/exchanges/?c=livestock
June hogs closed up $3.75 at $62.70.
June hogs gapped up and closed sharply higher on Friday as it extends the rally off April's low. The high-range close sets the stage for a steady to higher opening when Monday's night session begins trading. Stochastics and the RSI remain neutral to bullish signaling that sideways to higher prices are possible near-term. If June extends the aforementioned rally the 50-day moving average crossing at $63.57 is the next upside target. Closes below the 20-day moving average crossing at $50.26 would confirm that a short-term top has been posted. First resistance is the 50-day moving average crossing at $63.57. Second resistance is the 50% retracement level of the 2019-2020 decline crossing at $68.55. First support is the 20-day moving average crossing at $50.26. Second support is April's low crossing at $41.50.
June cattle closed up $1.30 at $87.25.
June cattle closed higher on Friday marking an upside breakout of April's symmetrical Triangle. The high-range close sets the stage for a steady to higher opening on Monday. Stochastics and the RSI are neutral to bullish signaling that sideways to higher prices are possible near-term. If June extends today's rally the 50-day moving average crossing at $91.41 is the next upside target. If June resumes this year's decline, monthly support crossing at $69.29 is the next downside target. First resistance is today's high crossing at $88.95. Second resistance is the 50-day moving average crossing at $91.41. First support is April's low crossing at $76.60. Second support is monthly support crossing at $69.29.
August Feeder cattle closed up $1.15-cents at $127.65.
August Feeder cattle closed higher on Friday. The low-range close sets the stage for a steady to lower opening when Monday's session begins trading. Stochastics and the RSI are turning neutral to bearish signaling that sideways to lower prices are possible near-term. Closes below the 20-day moving average crossing at $125.76 would temper the near-term friendly outlook. Closes above the 50-day moving average crossing at $129.86 would signal that a short-term low has been posted. First resistance is the 50-day moving average crossing at $129.86. Second resistance is the March 25th high crossing at $139.00. First support is April's low crossing at $110.03. Second support is monthly support crossing at $95.50.
FOOD & FIBERhttp://quotes.ino.com/ex changes/?c=food
July coffee closed higher on Friday as it consolidates some of the decline off March's high. The high-range close sets the stage for a steady to higher opening on Monday. Stochastics and the RSI are oversold but remain neutral to bearish signaling that sideways to lower prices are possible near-term. If July extends this month's decline, March's low crossing at 10.31 is the next downside target. Closes above the 20-day moving average crossing at 11.42 would signal that a low has been posted.
July cocoa closed lower on Friday. The low-range close sets the stage for a steady to lower opening on Friday. Stochastics and the RSI are overbought but remain neutral to bullish signaling that sideways to higher prices are possible near-term. Closes above the 50-day moving average crossing at 24.18 would open the door for a larger-degree rally into early-May. Closes below the 20-day moving average crossing at 23.33 would temper the near-term friendly outlook.
July sugar closed sharply higher on Friday as it extends this week's rally. The high-range close set the stage for a steady to higher opening on Monday. Stochastics and the RSI are neutral to bullish signaling that sideways to higher prices are possible. If July extends this week's rally, the 50-day moving average crossing at 11.40 is the next upside target. If July renews the decline off February's high, monthly support crossing at 8.36 is the next downside target.
July cotton closed lower on Friday. The low-range close sets the stage for a steady to lower opening on Friday. Stochastics and the RSI are diverging and are turning neutral signaling that a short-term top might be in or is near. Closes below the 20-day moving average crossing at 54.35 would temper the near-term friendly outlook. Closes above the 50-day moving average crossing at 57.10 would open the door for additional gains near-term.
Thanks Tallpine!
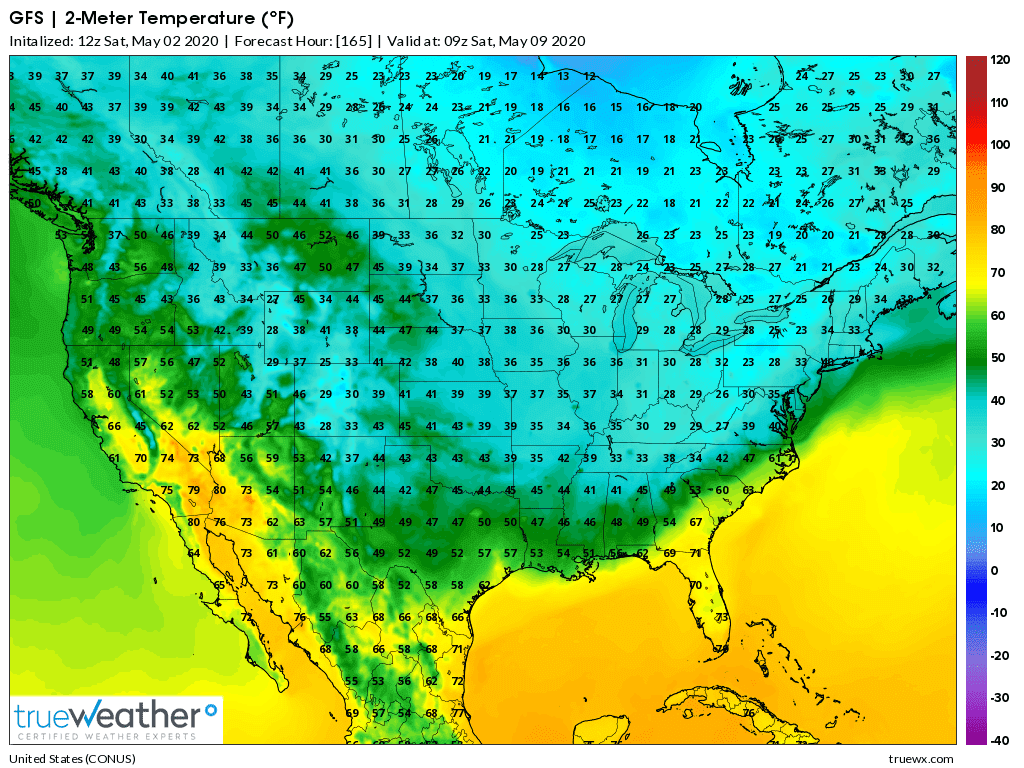
Near record breaking cold wave coming early in the 2nd week of May.
Timing and penetration south of the most intense part of the Arctic blast will determine if the SRW crop in the Eastern belt will be damaged or not.
Dry pattern will allow for a great deal of planting to continue, though very good soil temps from this cold will prevent good germination/emergence and early development........which should improve quickly during the 2nd half of the month.
If main body of this cold plunges far enough south and we drop into the mid-20's for numerous hours, there's is a chance for early emerged corn and beans to be damaged, despite their growing point being below the surface.
The coldest morning for this near record cold blast has been fluctuating from run to run and model to model.
I picked out the coldest morning from the coldest model, the just updated 18z GFS operational model and next Saturday morning below.
28 degrees all the way down to the Ohio River would hurt the jointed wheat a bit in that area a bit.
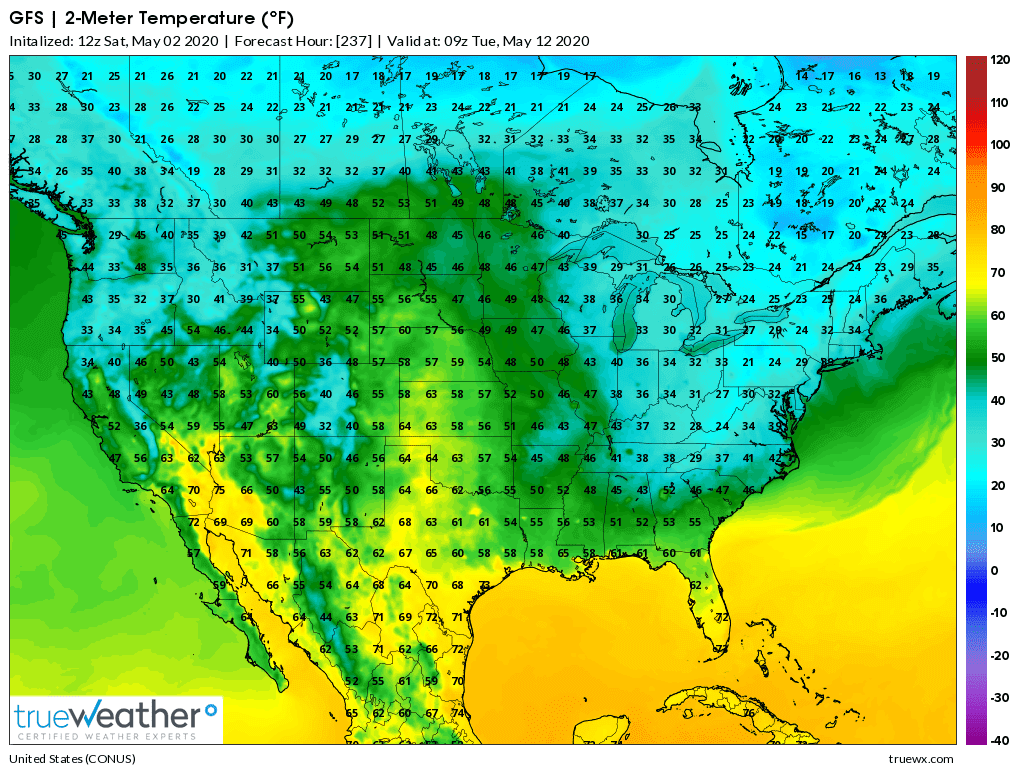
There is actually some air that is a bit colder than that farther north that could come in either Sunday or Monday morning and even Tuesday morning, the 2nd map shows the cold lingering.
With the right conditions(clear skies and near calm winds) we could get into the mid 20's.
So I'll say upper 20's for now on the coldest morning but there is a 4 day time frame for temps to get that cold at least once.