In April, 2020, the Northern Hemisphere experienced its 2nd largest 2-month drop in temperature in the 497-month satellite record.
The Version 6.0 global average lower tropospheric temperature (LT) anomaly for April, 2020 was +0.38 deg. C, down from the March, 2020 value of +0.48 deg. C.
The Northern Hemisphere temperature anomaly fell from +0.96 deg. C to 0.43 deg. C from February to April, a 0.53 deg. C drop which is the 2nd largest 2-month drop in the 497-month satellite record. The largest 2-month drop was -0.69 deg. C from December 1987 to February 1988.
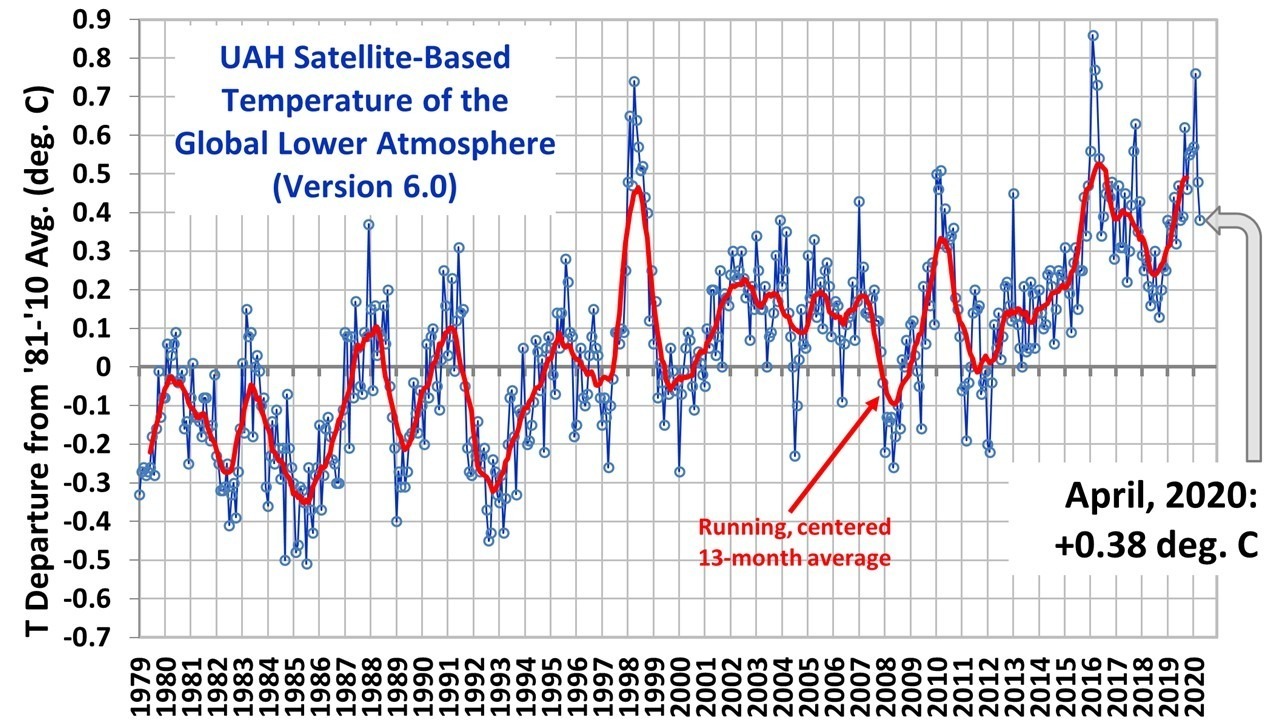
The linear warming trend since January, 1979 has now increased to +0.14 C/decade (but remains statistically unchanged at +0.12 C/decade over the global-averaged oceans, and +0.18 C/decade over global-averaged land).
metmike: 2 months is a just a blip in the big picture. Heat from solar radiation is stored in the oceans(especially the Pacific) for decades. The temperature uptrend above is still well intact..........but this is more evidence that it's NOT accelerating higher and that most of the climate model projections are TOO warm.
And the planet greening up greatly during the entire period above, tells us clearly what the REAL WORLD response has been to the beneficial warming and increase in beneficial CO2...........during this scientifically defined climate OPTIMUM.
Climate crisis.?.........that's a political term.
https://climate.nasa.gov/vital-signs/global-temperature/
From this plot it looks like temps went up .82 deg C in the 40 years from 1979 to 2019 or about .20 deg C/decade. This compares to a .14 deg rise, .035 deg/decade in the 40 yrs from 1939 to 1979 and a .15 deg rise , .037 deg/decade in the 40 yrs from 1899 to 1939.
Thanks,
I see their graph. That's not how it happened however.
The warming definitely accelerated in the 80's/90's. This is when I was on board with some of the problems lying ahead if we didn't drastically cut CO2 emissions.
But then, we had the pause/big slow down for around 15 years after the late 90's...........and we also had NOAA making 2 big temperature adjustments to the past data.........decreasing older temps and increasing newer temps.
This restored the uptrend that we see today.
One check on this is that if temperatures were accelerating higher so much in recent years, we would certainly see a much greater acceleration in sea level rise and melting of ice at the poles. Turns out, that the Arctic sea ice bottomed in 2012 (its been around steady since then) and Antarctic ice has not changed that much.
Sea levels are just barely increasing a tad more than they were before but not anywhere close to what they would be based on if global temps were accelerating higher(keep in mind, the warming is more than twice as great at these highest latitudes, so melting of ice should be accelerating, as well as sea levels accelerating higher at a greater rate).
Heres an interesting article about this.
Metmike: So the alarm bells are going off as usual about sea level rise based on PREDICTIONS. However, when you look at the actual data, it keeps NOT showing what the extreme projections tell us should be happening.
A 0.55 increase in sea levels since 2003 from the 2 main sources of extra water going into the oceans (Arctic ice is all sea ice and melting has no affect on sea levels) would be the most recent 16 years.............a rate of .34 inches/decade and 3.4 inches/century.
Then, they use it to make this statement:
"Global sea levels will rise 2 to 6 feet by 2100 on the current trajectory, driven mainly by melting in Greenland and Antarctica, But scientists warn that the projections underestimate the climate change impact on sea level rise."
This contradicts themselves based on the actual measurements...........the observations that continue to NOT show what they are supposed to show based on global climate model projections that have all been too warm, to much too warm.
Maybe I'm biased but I trust the satellite temps because they measure the entire atmosphere and have not been adjusted numerous times.
The actual individual records show without question, that the 1930's was the hottest decade for the US. After a couple of adjustments, they no longer are the hottest because of the adjustments. Amazing that people measuring temperatures during that decade made so many mistakes/errors that that had to be fixed 7 decades later.
You probably remember this discussion that we had awhile back. This is one of my favorites actually.
Antarctic ice and sea levels/previous warmings-climate scientist corruption-IPCC: April 2019
https://www.marketforum.com/forum/topic/27525/
Here's a more recent one on melting ice(or lack of it)
NEW: Skeptical Science on global warming: Exposing this climate fraud. Ice melting is not accelerating. Use of deceptive graphs compared to the authentic data. Authentic science shows a climate optimum. March 2020.
https://www.marketforum.com/forum/topic/49302/
The source of your temperature map earlier is also the source of these changes to their temperature graphs over the 17 year period below:
https://realclimatescience.com/2019/02/61-of-noaa-ushcn-adjusted-temperature-data-is-now-fake/
This was very disturbing to both NASA and NOAA. Their CO2 warming theory was failing badly, so they simply changed the data, turning cooling into warming. This happened at the same time Michael Mann was erasing the Medieval Warm Period.
On the map below from the EPA, its not hard to see that the 1930's had many more heat waves by a wide margin based on ACTUAL temperatures.
https://www.epa.gov/climate-indicators/climate-change-indicators-high-and-low-temperatures

I'm not trying to say that we are not warming but my 37 years of observing global temperatures and weather on this greening planet tell me that its very modest and has been greatly over predicted and the ones overpredicting it, instead of admitting they were too warm, have been doing some very unethical things to cover their butts and keep the climate crisis narrative going..............always based on simulations of a future atmosphere on global, computer climate models programmed with their equations based on what they think should happen.
Clearly life prefers it even warmer than this and the main risk to humans is to those that live along the coasts if seas would increase, let's say by more than 10 feet in the next 100 years. ......because we built so much property along the coasts.
But we have been hearing about this happening for over 3 decades now:
https://apnews.com/bd45c372caf118ec99964ea547880cd0
PETER JAMES SPIELMANNJune 29, 1989
UNITED NATIONS (AP) _ A senior U.N. environmental official says entire nations could be wiped off the face of the Earth by rising sea levels if the global warming trend is not reversed by the year 2000.
Coastal flooding and crop failures would create an exodus of ″eco- refugees,′ ′ threatening political chaos, said Noel Brown, director of the New York office of the U.N. Environment Program, or UNEP.
He said governments have a 10-year window of opportunity to solve the greenhouse effect before it goes beyond human control.
As the warming melts polar icecaps, ocean levels will rise by up to three feet, enough to cover the Maldives and other flat island nations, Brown told The Associated Press in an interview on Wednesday.
Coastal regions will be inundated; one-sixth of Bangladesh could be flooded, displacing a fourth of its 90 million people. A fifth of Egypt’s arable land in the Nile Delta would be flooded, cutting off its food supply, according to a joint UNEP and U.S. Environmental Protection Agency study.
″Ecological refugees will become a major concern, and what’s worse is you may find that people can move to drier ground, but the soils and the natural resources may not support life. Africa doesn’t have to worry about land, but would you want to live in the Sahara?″ he said.
UNEP estimates it would cost the United States at least $100 billion to protect its east coast alone.
Shifting climate patterns would bring back 1930s Dust Bowl conditions to Canadian and U.S. wheatlands, while the Soviet Union could reap bumper crops if it adapts its agriculture in time, according to a study by UNEP and the International Institute for Applied Systems Analysis.
Excess carbon dioxide is pouring into the atmosphere because of humanity’s use of fossil fuels and burning of rain forests, the study says. The atmosphere is retaining more heat than it radiates, much like a greenhouse.
The most conservative scientific estimate that the Earth’s temperature will rise 1 to 7 degrees in the next 30 years, said Brown.
The difference may seem slight, he said, but the planet is only 9 degrees warmer now than during the 8,000-year Ice Age that ended 10,000 years ago.
Brown said if the warming trend continues, ″the question is will we be able to reverse the process in time? We say that within the next 10 years, given the present loads that the atmosphere has to bear, we have an opportunity to start the stabilizing process.″
He said even the most conservative scientists ″already tell us there’s nothing we can do now to stop a ... change″ of about 3 degrees."
metmike: Since the disasters are NOT happening during this climate optimum, every time we have an extreme weather event, we here that it was from the climate crisis............even as we have experienced, the best weather/climate during the last 40 years with the bonus of increasing beneficial CO2 levels, in the last 1,000 years and possibly going back to the Holocene climate OPTIMUM, 5,000 years ago........that was 2 deg. warmer than this in the Arctic.....which had even LESS sea ice then.
https://en.wikipedia.org/wiki/Holocene_climatic_optimum
The internet is a wonderful thing pj!
Away from my desk, if this discussion comes up, I have to use words vs words that somebody I'm talking with heard from another source on tv or elsewhere.
My word against theirs sort of thing.
What I will usually do is ask for their email address and tell them..........."I'm sending you the authentic data and observations with some analysis" forget everything that you;ve heard and read about using words or narratives or in many cases projections of the future using flawed simulations of the climate.
Look at the data and decide for yourself if we are having a climate crisis or not.
Not that I necessarily believe it, but one could use their imagination and say that the virus has shut down so much driving that it cut back a large enough volume of carbon emissions in combination with the current 200 year grand solar minimum to suddenly cool back the globe. What a beautiful story that would be if real. In actuality, UAH did as Mike said cool back sharply in the NH from Feb to April. It was the sharpest NH 2 month cooling in 32 years as he said! So, why did this happen? Could it be related to carbon emissions in combo with the grand solar minimum? Is this possible? Will we later say hindsight is "2020" about the unexpected start of a great NH and global cooldown in "2020"? Could it be"??
Larry,
The only problem with that is atmospheric CO2 has been going higher during the shut down.
The seasonal drop from last year, May thru October corresponds to the Northern Hemisphere's growing season and plants using up massive amounts during photosynthesis. Sun+H2O+CO2+Minerals =O2+food(sugars).
When those plants go dormant or die because of the killing cold of Winter in the mid/high latitudes there is much less use of CO2, so it can build up faster again.
The amount of atmospheric CO2 right now is the record high since we've been measuring it.
However, it should be dropping from now until October, as plants in the Northern Atmosphere come alive again(thanks to the glorious, live giving warmth) and gobble up this yummy, beneficial and natural fertilizer.
https://www.co2.earth/daily-co2

Source Graphic: NOAA Daily Average MLO CO2

Source Graphic: NOAA Weekly Mauna Loa Web Page
| May. 1, 2020 | 418.03 ppm |
| May. 1, 2019 | 414.88 ppm |
| 1 Year Change | 3.15 ppm (0.76%) |
For sure human emissions of CO2 were much lower during the shut down.
How could it keep going higher in the atmosphere?
Outgassing from the warming oceans is the only explanation in my opinion. Maybe alot of the increase the last 100 years is coming from this too.
Note in this first image below, the time of year, June of 2015, shortly before the Summer Solstice in the Northern Hemisphere and the point where the sun is very close to the farthest north that it will be all year and the highest angle in the sky, that warms the oceans the most at a point which is as far north as it will get in the year.....NORTH of the equator.
In June 2015, you can see the higher band of CO2 extending across the entire planet, even in places with no industry or man made CO2 emissions....NORTH of the equator:
https://directory.eoportal.org/web/eoportal/satellite-missions/o/oco-2

Note the 2nd image below was from October/early November 2014, 5 months later in the solar calendar year(the previous year) with the most powerful sun, now aimed much farther south in the southern hemisphere. The band of higher CO2 that extends across the entire globe is now seen to have shifted, exactly with the sun angle(which is heating the oceans below and maximizing out gassing of CO2). The band extends across areas that have no industry or extensive human caused CO2 emissions and the band is now SOUTH or the equator:"
https://www.nasa.gov/jpl/oco2/pia18934
.

The point of this is that when a fluid that has CO2 dissolved in it warms up, the CO2 comes out faster. The CO2 in your beverage will come out faster when the beverage is warm vs cold.
The oceans have massive amounts of natural CO2 in them. Much more than humans are emitting. In the past, the ocean temperatures went up first, along with them heating the atmosphere............ THEN the CO2 went up because the warmer oceans out gassed CO2 into the atmosphere.
Some of that is happening now on top of the greenhouse gas warming of the atmosphere from the increase in CO2 from burning fossil fuels.
During El Nino's, which is a warming of the S.Pacific which warms the planet, the atmospheric CO2 goes up a little bit faster then. When the global temperature is flat or cooling a bit temporarily, the rate of increase in CO2 is not quite as fast.
So some of this increasing CO2 is coming from the oceans losing CO2 because they are warmer. This might be a positive feedback or maybe it tells us that this warming of the oceans during the Grand Solar Max last century, added a bunch of heat to the oceans, which outgassed alot more CO2 into the atmosphere that added more to the CO2 emissions from burning fossil fuels. The oceans could also be warming from geothermal heat/deep ocean volcanic activity.
Regardless, these 2 images show the irrefutable out gassing effect from the stronger sun and warmer oceans below it.
So when the oceans warm, as they have in the last 100 years, they give up more CO2 into the atmosphere. The current atmospheric level of 418 parts per million, would certainly be well under 400, if we cooled the oceans back down to the temperature they were at a century ago.
Maybe the atmospheric CO2 would plunge to 350 ppm or lower as more CO2 went into the cooler oceans if the temp dropped by 1 deg. C?
I'm not suggesting that will happen, just that it would happen if the temp of the oceans dropped..
In the past, temperatures went up FIRST, then the CO2 followed which suggests the oceans warmed first, then CO2 followed from outgassing.
Also, 2 months is just a blip when looking at climate and the big picture but I was thinking about this more just now and came up with a good potential explanation for the drop, especially since it occurred in, mainly the Northern Hemisphere.
The urban heat island effect. For the last 100 years, we all know that cities have been growing and in some cases, thermometers not moving.
We know that thermometers in rural settings have not experienced as much warming as thermometers in urban settings. Supposedly, there is a corrective factor in the global data to account for this but there are many skeptics that claim the affect is greater than that.
The satellite data would not be as affected/has shown less warming because satellites measure the entire atmosphere, not just the temperature 5 feet above the surface, with many instrumentation boxes located close to where all the people live(who are generating a ton of local heat).
The shut down definitely reduced the urban heat island affect, so the thermometers in or close to the cities would have been cooler than with the same conditions before the shutdown.
Does this mean that this affect is greater than we thought?
Probably but it could also mean that, if the correction factor for the affect really is enough to offset it, then the last 2 months, the correction factor might have been too great.
To know whether this is responsible, we would just need to see if the cooling was greatest with thermometers close to the urban environments. If that was the case, then we know the UHI is responsible for much of the affect.
But there is something else to consider......WASTE HEAT generated by energy use(mainly burning fossil fuels).
Waste heat from humans could have been contributing to more global warming at the lower levels than we thought and the heat would not just be limited to the cities, as some of it would be transported downwind from the sources.
If that is the case, then temperatures from these factors(UHI and WASTE HEAT) will go back up when industrial activities increase again.
https://agupubs.onlinelibrary.wiley.com/doi/full/10.1002/2016EF000352
Our results are strong evidence that changes in energy consumption contribute to temperature change over sub‐decadal timescales in the two nations considered. Britain has experienced a drop in temperature of about 0.5°C since the early years of the millennium (Figure 2, lower left) at a time when world temperatures have remained virtually stable, whereas Japan experienced a rise in Δt of 1.0°C between the early 1980s and 2000 (Figure 2, upper left), double the world rise in temperature over the same period. Both these changes reflect changes in energy consumption in each country.
These conclusions might be perceived to be in contrast to recent studies of the UHI effect that relate to large cities, where warming of only ∼0.1°C per decade or less is detected, compared with nearby rural districts [Parker, 2010; McCarthy et al., 2011]. However, such studies are designed to detect urban/rural contrasts, not the effects of overall increases or decreases in heat emission in entire nations. UHIs are most pronounced in calm weather [Oke, 1973; Wilby, 2003], and are best measured at such times [Knight et al., 2010]. Under average conditions, generated heat will drift downwind and may affect rural weather stations [Parker, 2010]. In addition, the problem of nearby road and urban development at long‐lived rural control stations, which may have affected recorded temperatures, is discussed by Hansen et al. [2001]. Certainly in Japan, Fujibe [2009] detected temperature anomalies from towns of population less than 1000.
Because anthropogenic heat is generated close to where temperatures are measured in both countries, we have not used a climate model to investigate the transport of such released heat further afield. Early attempts to do this globally found temperature variations of a similar order to the model's natural fluctuations [Washington, 1972], and Flanner [2009] found no significant effect for the present day. Oleson [2012] used CMIP5 simulations to model future changes in urban minus rural temperatures in response to changing climate over the 21st century, rather than the effects of changing energy consumption. More recently however, Zhang et al. [2013] despite including only 42% of world energy consumption in their model, found significant winter and autumn temperature changes up to 1°C in mid‐ and high‐latitudes, far from heat sources, that correspond well to areas of previously unexplained differences between observed and modeled temperatures. Chen et al. [2014], entering anthropogenic heat flux into a refined model that included long wave radiation, found higher and more widespread increases over standard models: 1–2°C in mid‐ to high‐latitude areas of Eurasia, North America, and parts of the southern hemisphere, and concluded that anthropogenic heating is an important factor in global warming that should not be ignored. Our study is the first of its kind that provides direct observational evidence of this.
Couldn't help but chuckle at this junk science article when I came across it this morning:

By Henry Fountain-junk science reporter (-:

https://www.nytimes.com/2019/12/04/climate/climate-change-acceleration.html
More devastating fires in California. Persistent drought in the Southwest. Record flooding in Europe and Africa. A heat wave, of all things, in Greenland.
Climate change and its effects are accelerating, with climate related disasters piling up, season after season.
“Things are getting worse,” said Petteri Taalas, Secretary General of the World Meteorological Organization, which on Tuesday issued its annual state of the global climate report, concluding a decade of what it called exceptional global heat. “It’s more urgent than ever to proceed with mitigation.”
But reducing greenhouse gas emissions to fight climate change will require drastic measures, Dr. Taalas said. “The only solution is to get rid of fossil fuels in power production, industry and transportation,” he said.
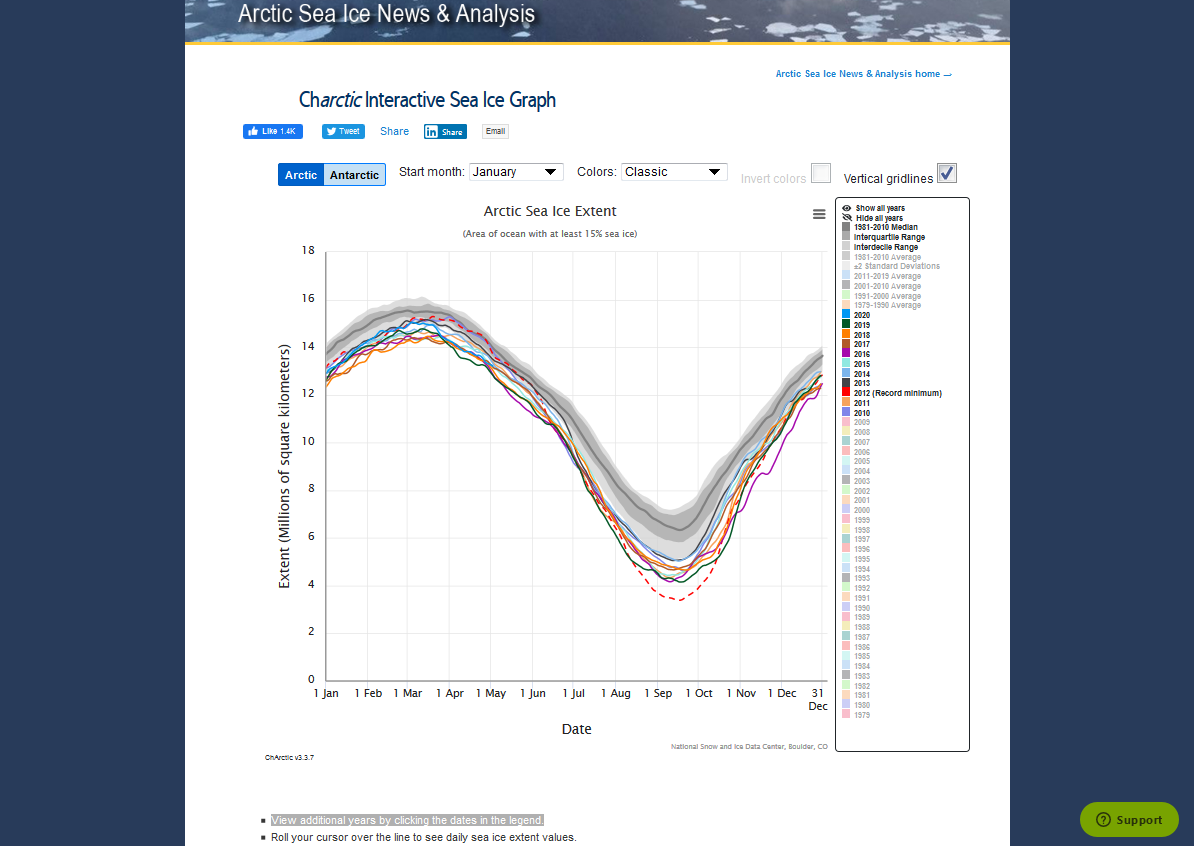
"Seas are warming and rising faster, putting more citiesat risk of tidal flooding or worse. Glaciers are melting at a pace many researchers did not expect for decades. The amount of Arctic sea ice has declined so rapidly that the region may see ice-free summers by the 2030s."
metmike: Fake climate crisis news! Arctic sea ice bottomed in 2012 (note the red dashed line below with plots from the last decade). It's not changed much since then, with higher levels at the end of the last several melt seasons.
https://nsidc.org/arcticseaicenews/charctic-interactive-sea-ice-graph/
The truth is that we are having a climate OPTIMUM on this greening planet............oh, and BTW, polar bear numbers increased by 30% since 2005.
What are we being told about polar bear numbers:
What is really happening on the real planet with real polar bears (vs simulated, modeled data that just tells us what the human programming them thinks will happen-and wants us to believe)
https://www.thegwpf.org/as-polar-bear-numbers-increase-gwpf-calls-for-re-assessment-of-endangered-species-status/
"Since 2005, however, the estimated global polar bear population has risen by more than 30% to about 30,000 bears, far and away the highest estimate in more than 50 years."
It would be one thing to be wrong with the prediction but the predictions have been in the complete opposite direction as what has happened in many cases.
Polar bears numbers have gone up instead of down.
Planet has been greening up instead of dying with increasing drought.
Crop/world food production has been smashing record highs instead of crop failures
We’ve had a climate OPTIMUM instead of climate CRISIS
Then, they twist this into pretending that they were not just right but it's even WORSE than they thought and make the new predictions even WORSE than before, even as the complete opposite happens in the REAL world.
They do this because its not science. It's political agenda meant to get people to act using convincing sounding, very scary outcomes that will happen if we don't act.
We haven't acted in the past 4 decades and the climate optimum just keeps getting better for life on the REAL planet.