A while back (I believe it was late February), Dr Fauci wrote in a medical journal that the current corona epidemic was “not worse than a bad flu”.
Of course, in hindsight, we now know that this is not so. We never had a flu that required masks, social distancing, lockdowns, 33 mill unemployed workers, economic misery.
Well, that’s what fear made us do. How about the real numbers?
According to the CDC, for the time-span of 2010 to 2019, 9 to 49 million people became sick (not counting asymptomatic infections), 140,000 to 960,000 people were hospitalized, and 12,000 to 79,000 people died.
So, according to the CDC, a “bad flu” would be a flu that cost some 70k lives.
So, how do we stand in 2020, and how does this year’s flu compare to the Covid19?
I will make the bold statement that this year, nobody, not even the CDC, can tell you how many lives were lost to the flu
Why do I make this statement?
Because hospital doctors across the US were ordered to call all hospital deaths a Covid19death, whether Covid19 was involved or not. This fact has been proven by at least one published document from one state’s department of health, as well as by the verbal admissions of numerous doctors across the country.
I could see how a doctor, dealing with a motorcycle rider who crashed his bike into a tree, would have a conflict with his conscience to call this death a Covid19 death.
However, the symptoms of Covid19 and a bad flu are very similar. There is no doubt in my mind that, since mid-March, almost every flu death was listed as a Covid19 death for the official records.
2 days ago, USA Today stated that the CDC has not stopped counting flu deaths. Oh yeah? How can they keep counting when they are not getting any valid data anymore?
So, how many flu deaths do we have so far?
So, today, we are looking at 79,000 Covid19 deaths in the USA. How many of these deaths are actually flu deaths? 10,000? 20,000? 30,000? How does anyone really know, since we are not keeping honest data anymore?
Ironically,not long ago I read a comment by the CDC, stating that this year it was a “mild flu-season”. Well, of course it was…. during the last few weeks every flu death was recorded as a covid19 death.
Gunter,
I would venture to guess a couple of things.
1. Tjhe vast majority of doctors are not calling a flu death a COVID death.
2. The number is probably alot less than 10,000
3. Something like 70-80% of the people dying from COVID-19, the elderly/old and with health problems, get the flu vaccine every year which is why we don't have a much higher % death rate from the flu from this population every year. These people have at least some protection to strong protection from the flu from their flu vaccine. So most of those dying from symptoms of the flu, had the flu shot, so guess what it was that killed them?
4. I'm guessing that the vast majority actually got tested and confirmed to have COVID or the flu.
5. Because of the shut ins for COVID, we likely caused the flu cases and deaths to plunge. So flu numbers that plunge, might make it look like they all got recorded as COVID cases. Maybe some did but there must have been a REAL drop in flu cases from the shut ins.
6. I found a good CDC link with loads of data below. See the analysis and please provide your opinion/comments.
Gunter,
I found a CDC site with lots of data about this.
https://www.cdc.gov/flu/weekly/index.htm
I'll comment about what I think each graph is telling us:
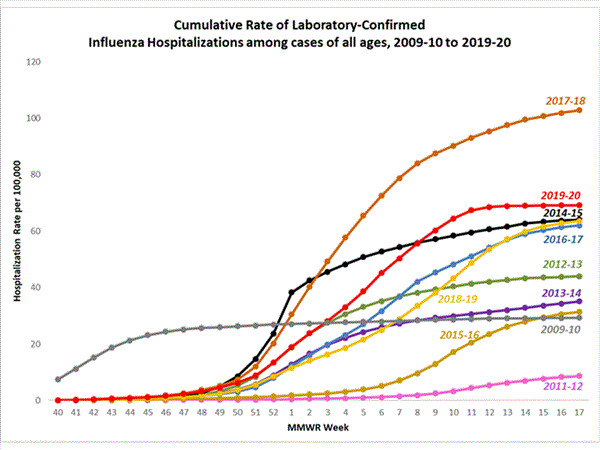
Besides having the most cases of any year, we should note that the initial peak in December was early, compared to previous years but was followed by a 2nd peak that lined up close to few other years, then unlike any other year, a 3rd peak MUCH later than the peak for any other year. This likely was from COVID-19 cases increasing rapidly in March, even while the flu plunged lower. The peak in this graph was several weeks earlier than the peak in coronavirus positive tests. This could be caused by at least a couple of items. Let's summarize.
1. Flu cases peaked weeks before COVID cases and the total of both, peaked earlier than COVID positives by several weeks because flu was dropping fast while COVID was going up fast.
2. COVID positive numbers remain elevated the last month because tests have more than doubled, even as the metric below, that measures actual illness shows a huge plunge lower. Cutworm and I have mentioned this in our daily reports several times.
https://www.marketforum.com/forum/topic/50858/
3. Illness visits for flu like symptoms have dropped close to the normal range and eye balling the graph, may be down to only around 20% of their triple peaks. This may actually be a better metric than positive COVID numbers, which might include people not sick and many more people than a month ago, just because we are testing more than twice as many people.
4. This is compelling evidence that we should be greatly easing the severity of restrictions and shut ins. Clearly, the number of sick people from the flu and COVID combined is down to almost a normal flu season.
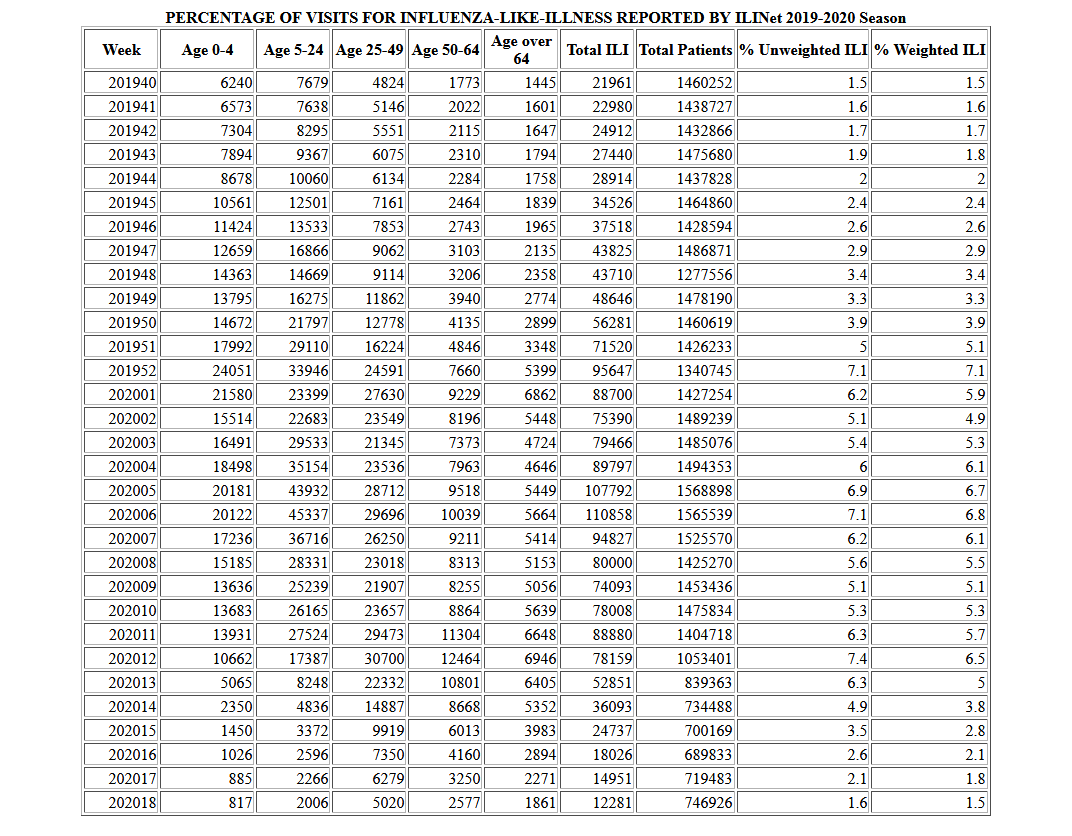
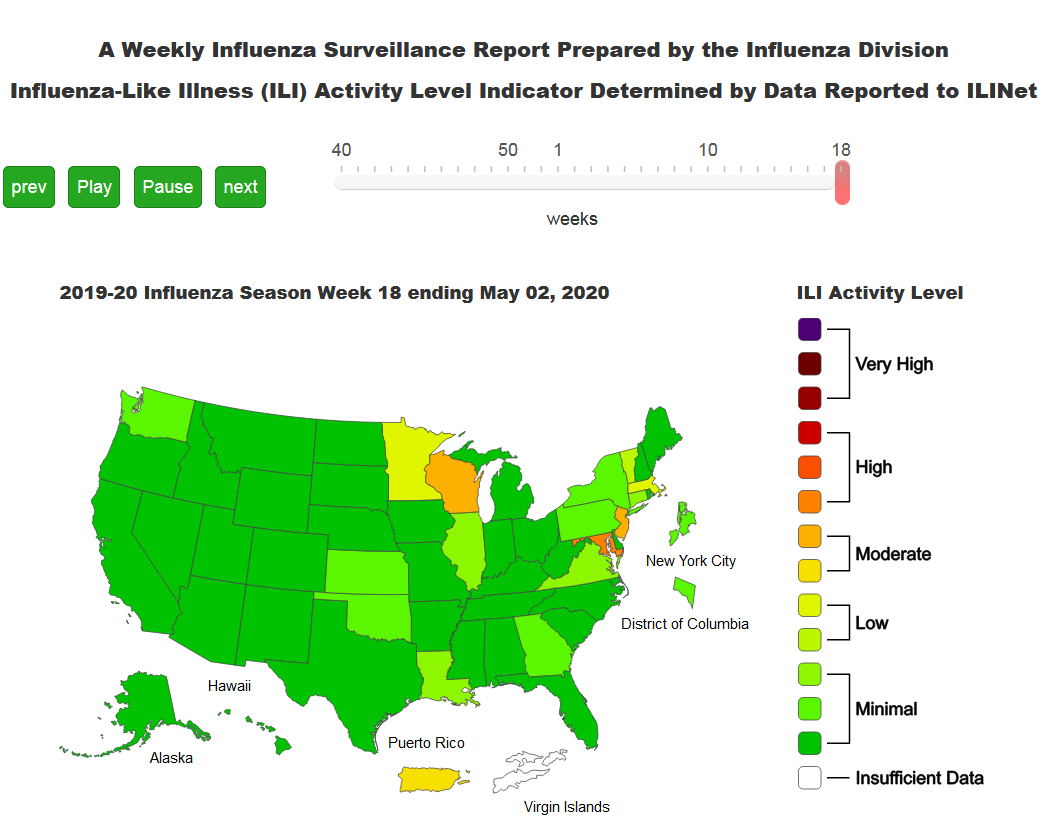
Nationwide during week 18, 1.5% of patient visits reported through the U.S. Outpatient Influenza-like Illness Surveillance Network (ILINet) were due to influenza-like illness (ILI). This percentage is below the national baseline of 2.4%.
The was the 2nd worst flu season of the decade. 2 years ago was worse.
The Swine flu from over a decade ago was very deadly. These were LABORATORY CONFIRMED cases of the flu. I am assuming that means non COVID cases.
Here's that same link for the data again:
https://www.cdc.gov/flu/weekly/index.htm
You can see the spike around 50% higher than the spike higher from 2 years ago, on the graph below, which was the worst one of the last decade.
Question is, how many of these people were COVID patients? If it includes all of them, then just 50% higher than the deaths from 2 years ago seems extraordinarily low compared to what our impression of the damage being caused by COVID is considering that we just obliterated the economy and ruined many tens of millions of people lives and the peak is clearly over, so not opening back up slowly in most places NOW is basing decisions on fear, panic and political agenda vs this data and the science.
OK, here is the answer below based on their definition at the top of the first page from this link:
"The percent of deaths due to pneumonia or influenza (P&I) is decreasing but remains elevated, primarily due to COVID-19, not influenza. Reported pediatric flu deaths for the season are high at 174."
So, apparently the numbers below DO INCLUDE COVID-19. As a result, this is a good comparison to the previous flu seasons and keep in mind, this years number below is COVID-19 +the flu, not just COVID-19.
If you took out the flu, the actual number for COVID 19 might be pretty close to the bad flu season of 2 years ago. We should keep in mind that the flu seasons of the past were pretty much over by early May and COVID-19 is not anywhere close to being over...........so it will rack up more cumulative cases/deaths compared to previous flu seasons over the next several months.
However, I think as the weather turns very warm and humid and cuts the survival time of the virus in the air in half, numbers will likely drop even as we open up more.
There is nothing in this data that suggests we should stay shut down, except in the few locations, mainly isolated locations, especially urban locations that are right now experiencing a big increase from already high numbers.
Rural locations that have had low numbers should also open up slowly even with modest increases.
If I am missing something with what seems a no brainer to me, please help me to see it. Why would we keep killing the economy at a tremendous cost to peoples lives when the science and data is telling us we flattened the curve and are well past the point of a threat of the National health care system being overwhelmed.
Based on National Center for Health Statistics (NCHS) mortality surveillance data available on May 7, 2020, 7.4% of the deaths occurring during the week ending May 2, 2020 (week 18) were due to P&I. This percentage is above the epidemic threshold of 6.7% for week 18.
Here's the numerical data.
Total Numbers right now for Total ILI are by far, the lowest of the flu season, going back to early last October. They peaked in week 12, which would have been around the end of March.
However, the numbers for the older age groups is NOT lower than last October, especially 50 and over. There are still more cases than October for older people. Clearly this is from COVID hitting us old people much harder. The 0-4 age group, however has less than 15% of the numbers of October.
Look at the change over the past 2 months, from early March to the most recent month.
Red in early March meant ILI activity was high to very high.
Greens in early May indicate a minimal number of people with flu like illness. I will guess that this includes COVID people.
.png)
thank you, metmike, for the huge amount of research you put into this. You weakened my claim that a large portion of Covid19 deaths are actually flu deaths.
However, I am still consider the Covid19 statistics to be unreliable and inflated, since we do know that doctors were ordered to register non-corona deaths as corona-deaths.
Gunter,
I love your outside the box thinking.
I’ve thought about many things differently and did a lot of extra analyzing about topics because of your points.
At the start of last year, for instance, when we were all being told that there was no crisis at the southern border and we were being told that President trump was making it all up to justify his wall.... ..you posted links to stories that were way ahead of everybody else on the reality of the real crisis that was being hidden from us.
Shortly after that, the news started pouring in confirming your early sources.
So even if I disagree with you on something or it seems crazy, I seriously consider that you might just know something before the rest of us do.
Actually, I have a better example. Earlier this year, you gave us the video of the doctor telling us that ventilators were killing people.
I thought that sounded pretty crazy, which was my initial response. Since then we have more and more evidence.....now conclusive that ventilators have in fact been killing people.
Here it is:
https://www.marketforum.com/forum/topic/50047/
ventilators are hurting people, not Corona
9 responses |
Started by GunterK - April 5, 2020, 6:32 p.m.
says one ICU doctor
+++++++++++++++++++++++++++++++++++
This was my initial response:
By metmike - April 6, 2020, 2:06 a.m.
This one seems a bit hard to believe Gunter...........that none of the other doctors would see this.
+++++++++++++++++++++++++++++++++++++++
Then, 4 days later:
Re: Re: Re: ventilators are hurting people, not Corona
By metmike - April 10, 2020, 12:30 a.m.
Gunter,
This one is no longer hard to believe. You were just early in reporting it.
There is increasing evidence that ventilators are hurting and even killing patients with COVID-19.
Some Doctors Moving Away From Ventilators for Virus Patients, Citing Death Rate
But some health professionals have wondered whether ventilators might actually make matters worse in certain patients, perhaps by igniting or worsening a harmful immune system reaction.
++++++++++++++++++++++++++++
By metmike - April 23, 2020, 2:15 p.m.
https://www.cnn.com/2020/04/22/health/coronavirus-ventilator-patients-die/index.html
++++++++++++++++++++++++++++++
Re: Re: ventilators are hurting people, not Corona
By metmike - April 23, 2020, 2:19 p.m.
It looks likely that ventilators are killing many more people than saving lives.
They are doing more damage to the lungs from the pressure to force oxygen in and its THAT damage that is killing some patients.