June: We have a new legit concern that millions of people discarding the known benefits of social distancing to protest, especially in urban areas that have the highest risk/incidence of COVID-19 will cause the infection rate to increase again. At the very least, it may keep numbers from falling as fast as they would have. This is not an anti protesting message. I went to a protest in our low risk community on Saturday with an N-95 mask. It's just a statement based on science.
The previous coronavirus thread was getting excessively long, so we've started another new one.
We are once again increasing the uncertainty by adding a new element by reopening. Like everything else in the country, even this has become politically divisive. The data and science, including the obliterated economy are screaming that we reopen slowly ASAP. You will be able to see the data graphed here to judge for yourself. We should keep in mind that testing has doubled in the last month.... picking up many new cases(mainly minor ones) that didn't show up in the graph a month ago(when the REAL numbers were actually higher).
See the previous tracking posts below:
Tracking COVID-19 #3 THU
52 responses |
Started by metmike - April 20, 2020, 12:48 p.m.
https://www.marketforum.com/forum/topic/50858/
++++++++++++++++++++++++++++++++++++++++++++
Tracking the Coronavirus#2-SUN
45 responses |
Started by metmike - April 1, 2020, 1:26 p.m.
https://www.marketforum.com/forum/topic/49863/
++++++++++++++++++++++++++++++++++++++++++++++++++++++
*Tracking the Coronavirus-TUE#'s at the bottom-rate slowing down a bit?
41 responses |
Started by metmike - March 14, 2020, 11:49 a.m.
https://www.marketforum.com/forum/topic/48892/
+++++++++++++++++++++++++++++++++++++++++++++++++++++++++++++++++++++++++++++++++
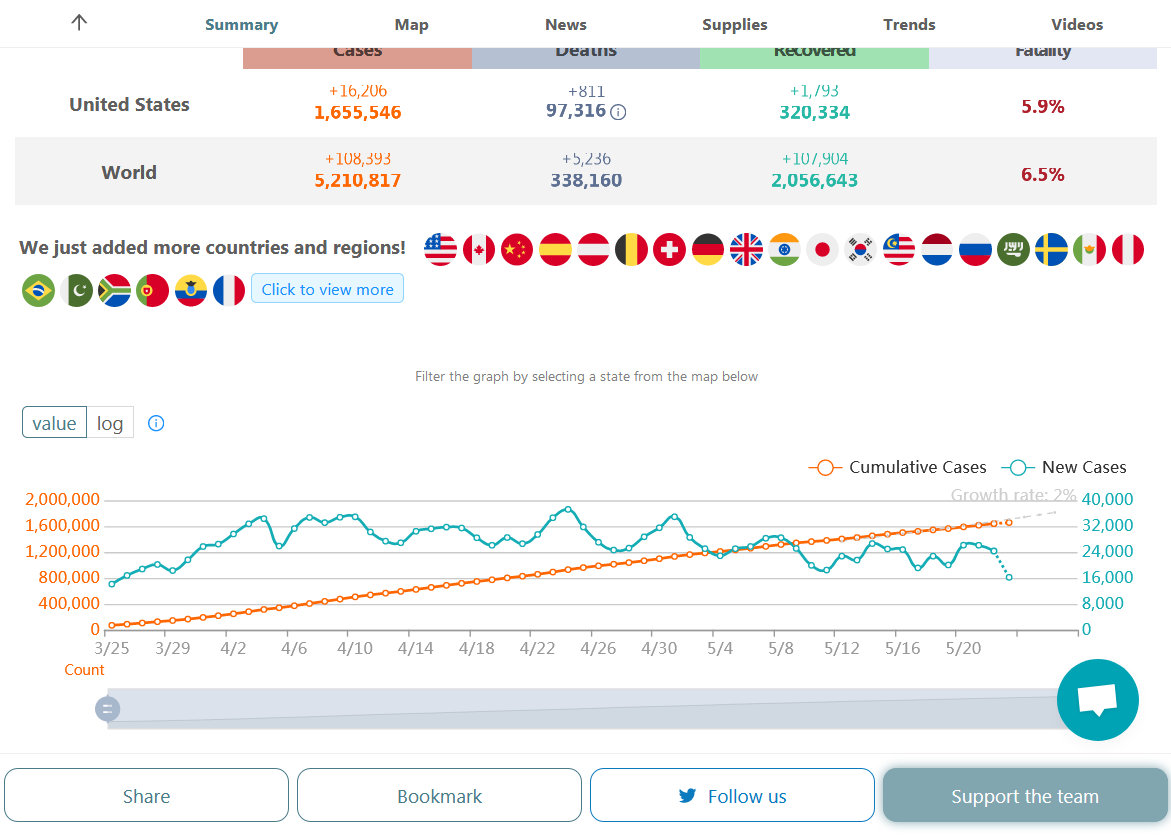
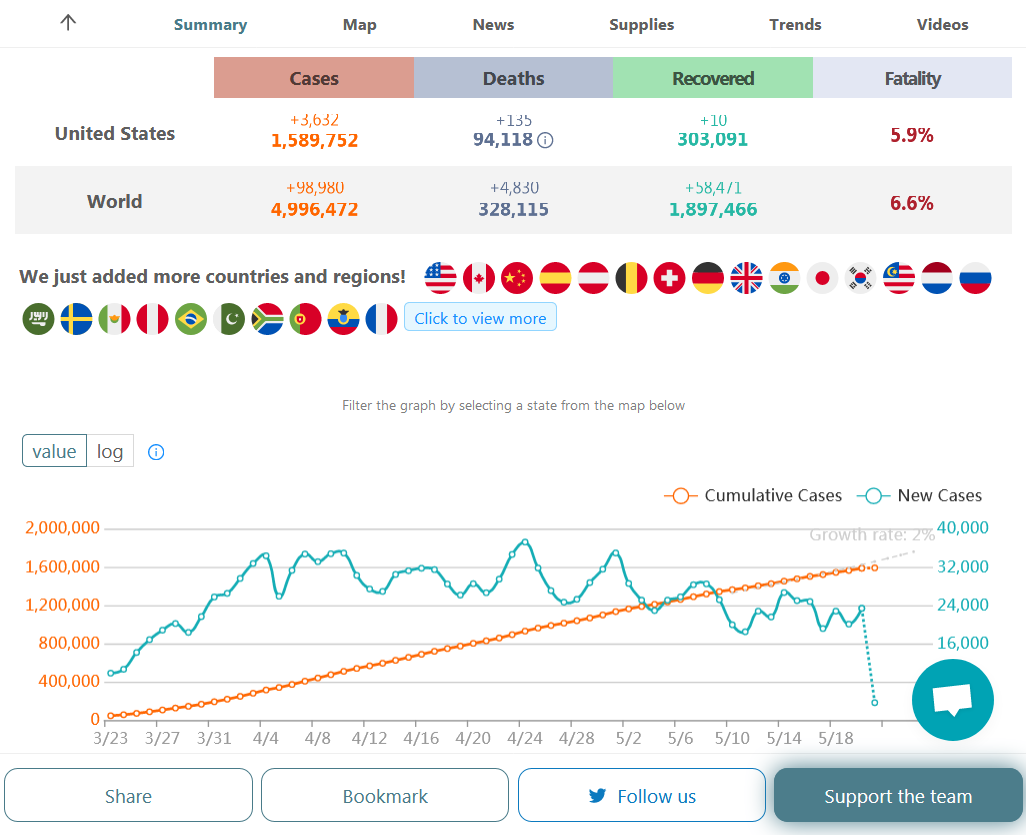
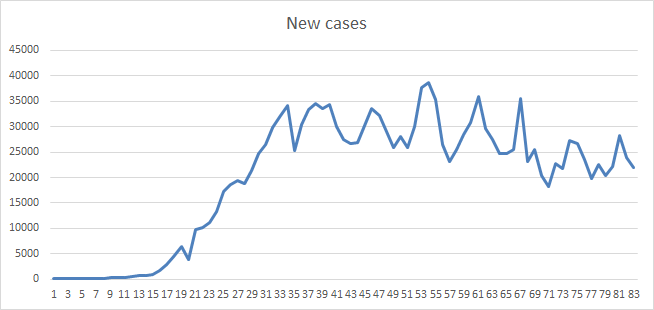
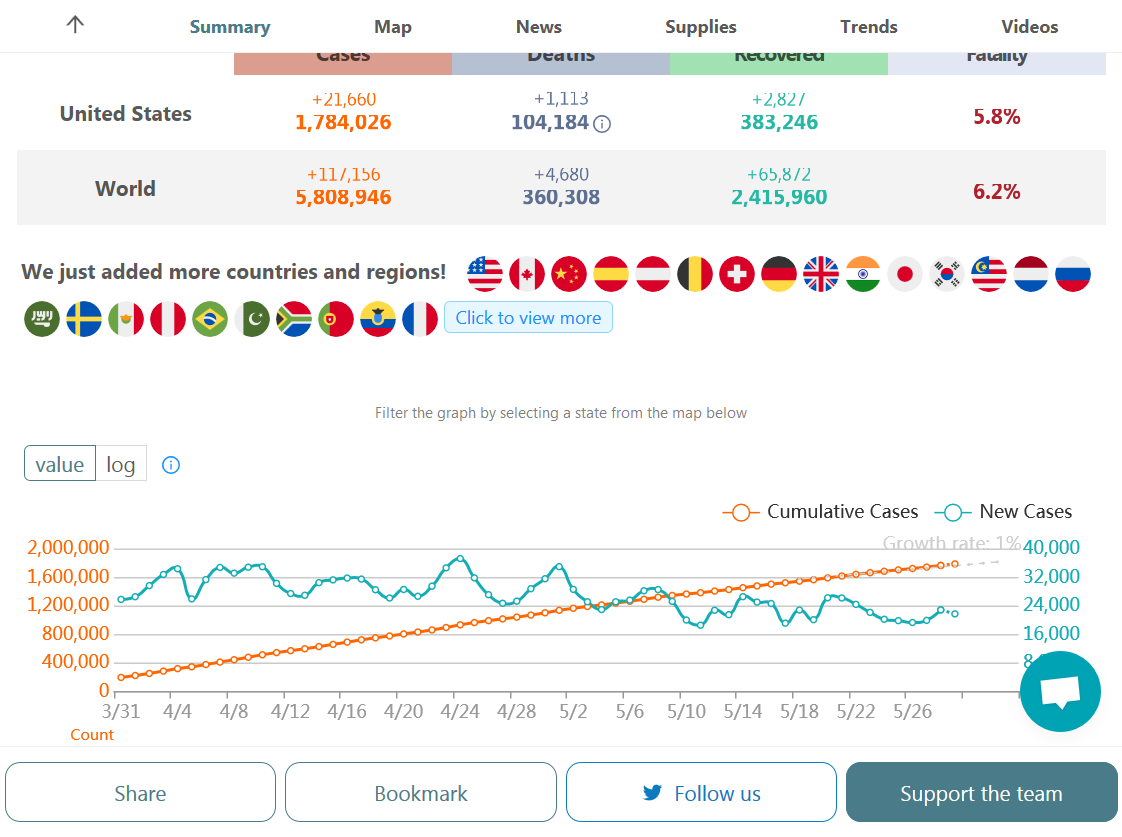
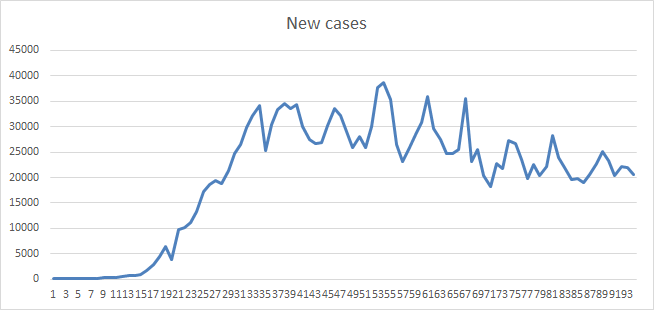
Daily New cases thru Friday, May 16th-blue line. Starting from March 18th.
Orange line is cumulative/Total cases.
https://coronavirus.1point3acres.com/en
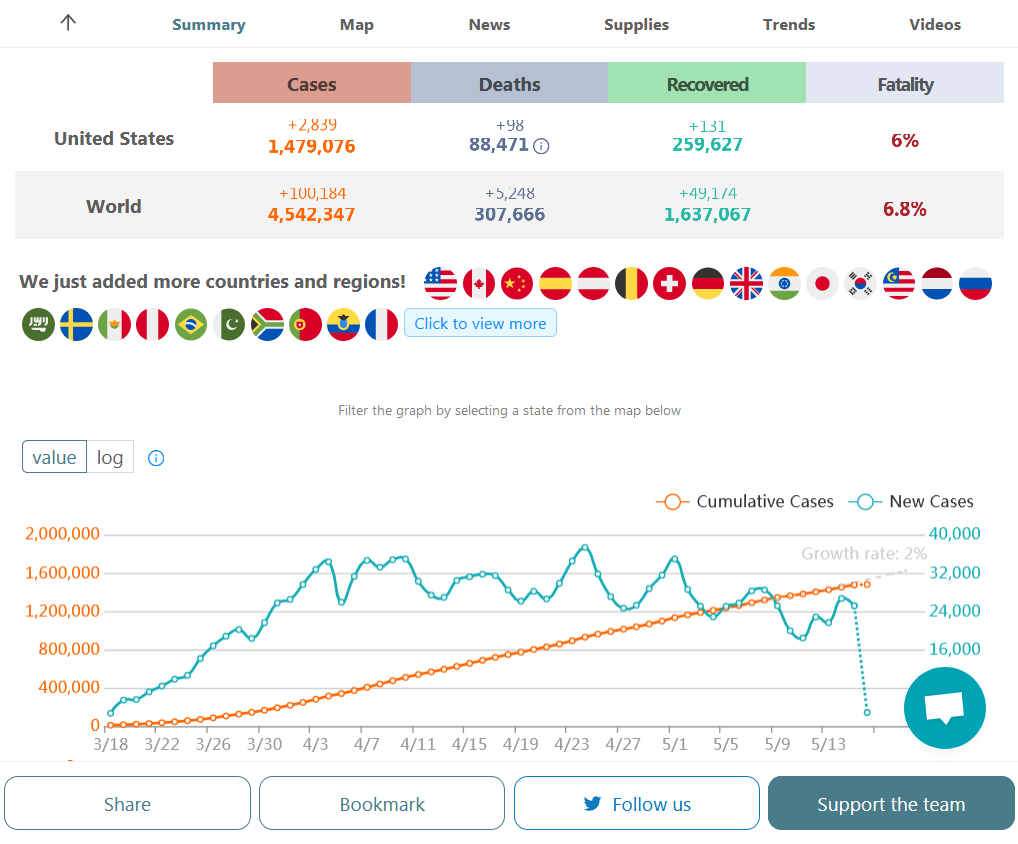 New cases thru Friday, May 16th.
New deaths thru May 15-purple line going back to March 18.
Cumulative/Total deaths-red line.
https://coronavirus.1point3acres.com/en
.png)
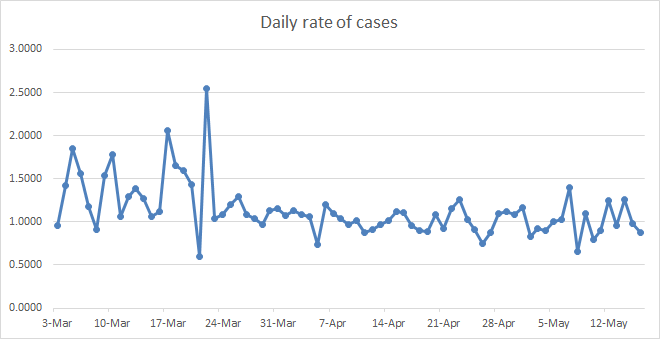
Info For these charts gleaned from https://www.worldometers.info/coronavirus/country/us/
The end date is 5-16.
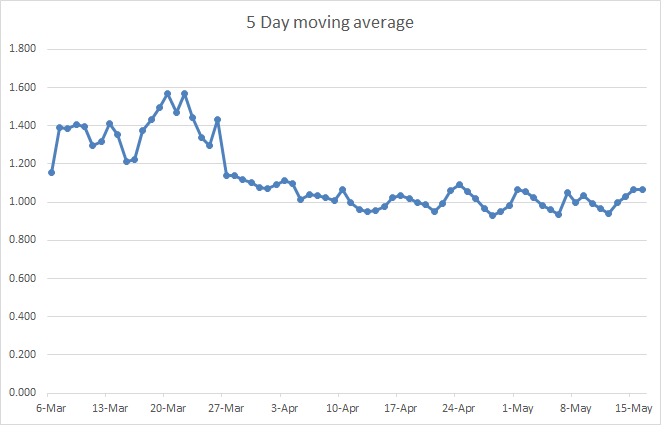
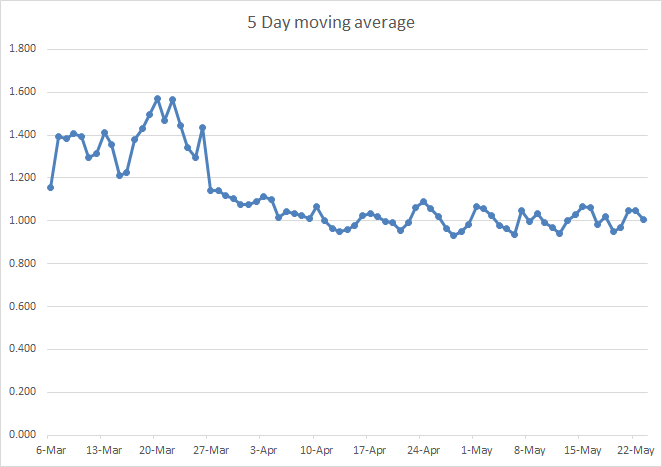
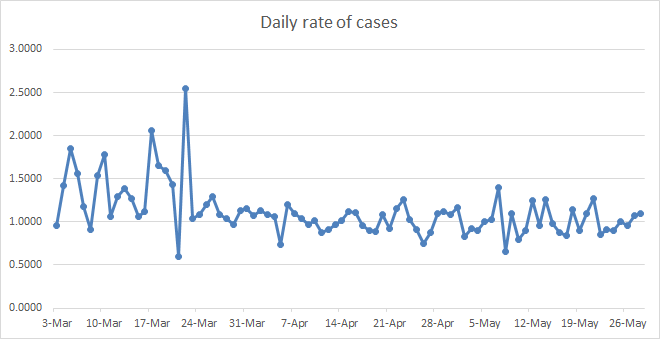
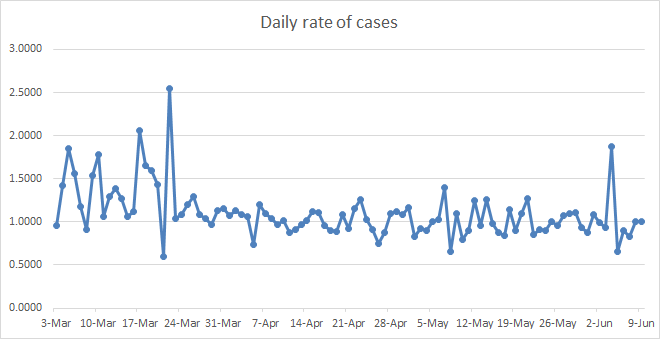
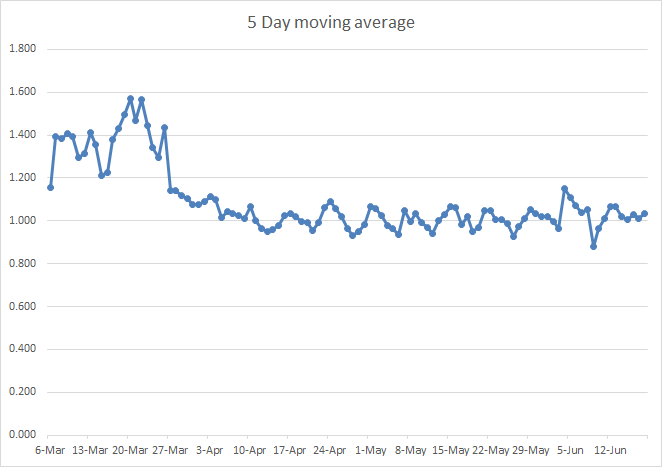
Current rate 0.8800, 5 day moving average 1.064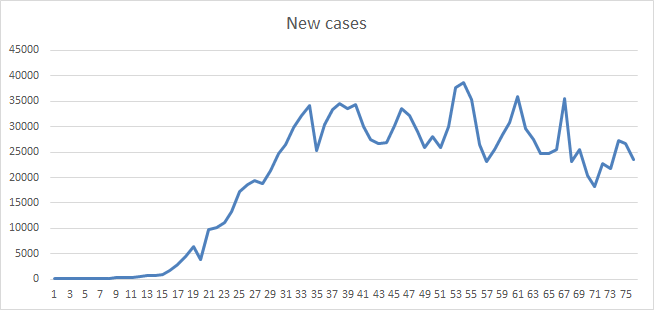
Thanks cutworm!
Find this data here: https://coronavirus.1point3acres.com/en
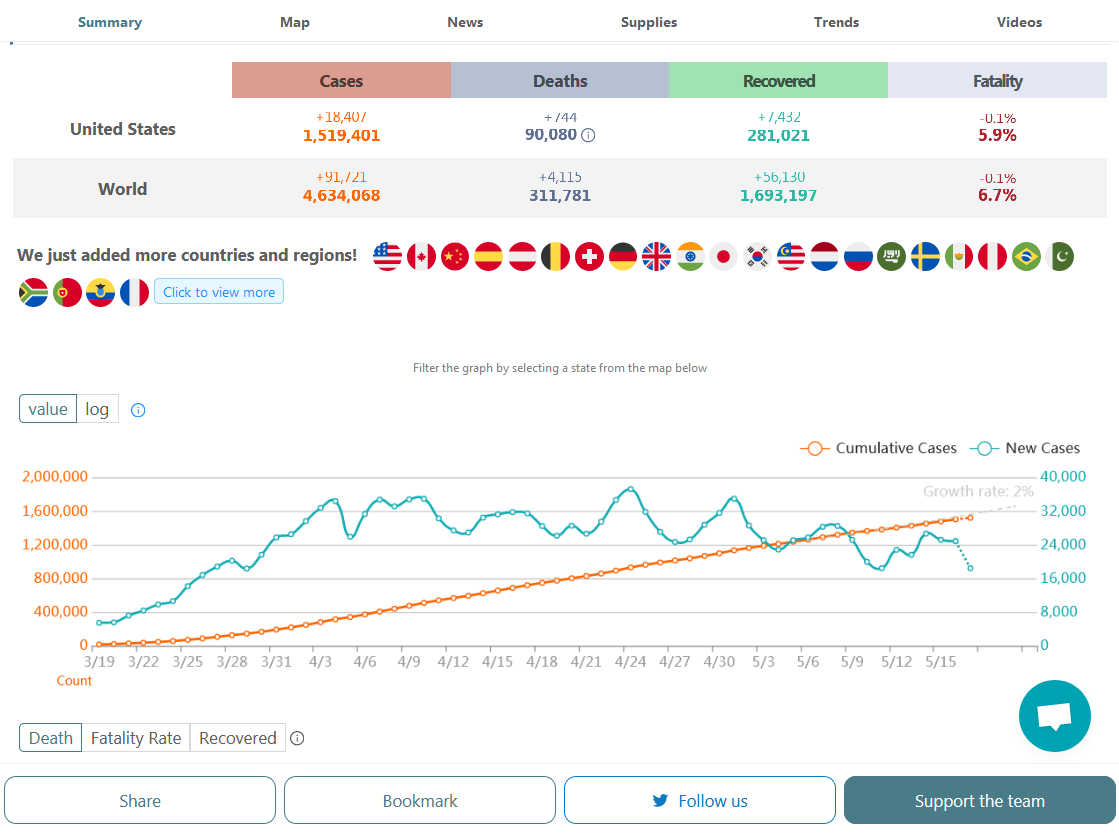
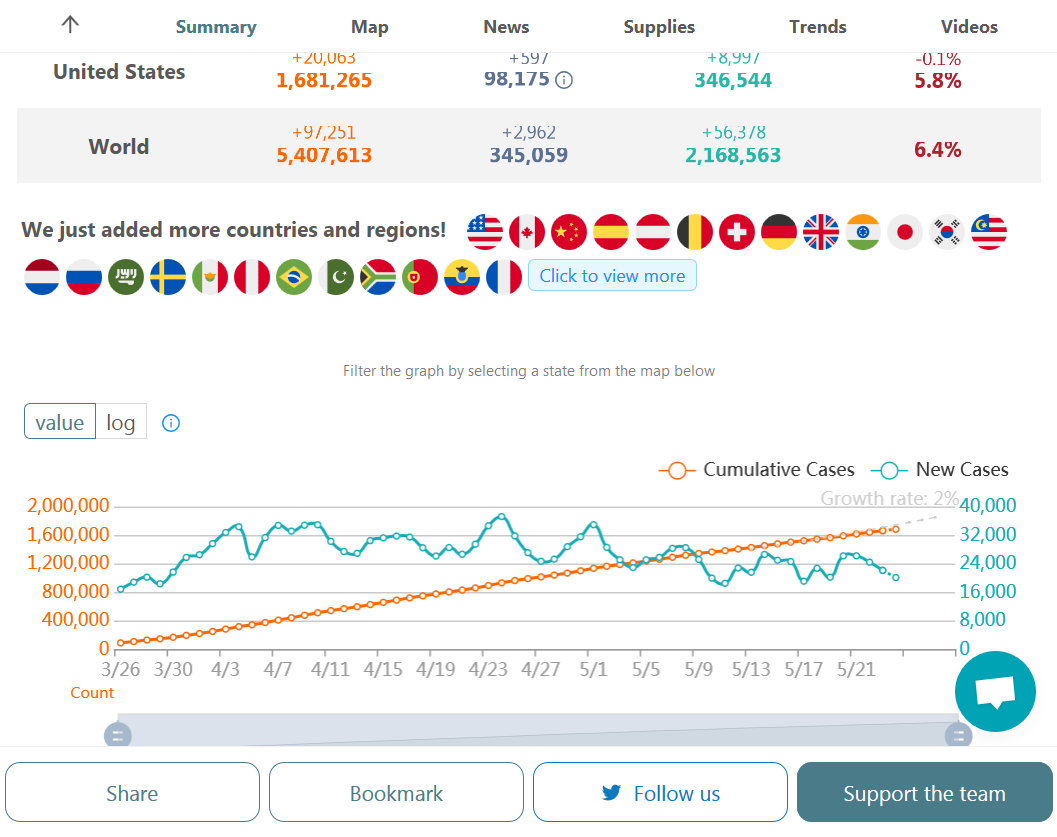
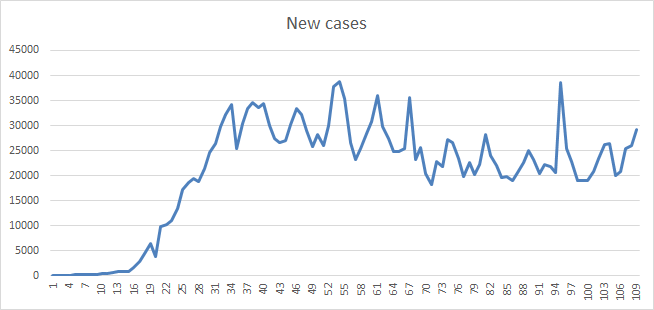
Daily new cases in blue below. Cumulative new cases in orange. Testing has doubled in the last month which is keeping the measured rate from falling faster.
https://www.marketforum.com/forum/topic/52242/
Monday's graph.
Blue is daily plots of new infections. Orange is the cumulative number.
.png)
Info For these charts gleaned from https://www.worldometers.info/coronavirus/country/us/
The end date is 5-18.
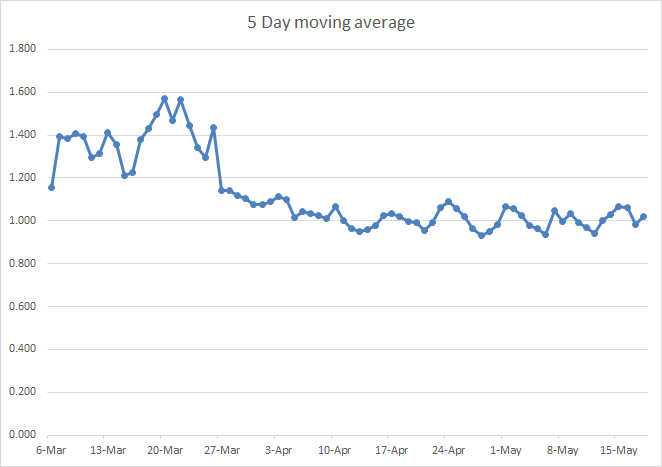
Current rate 1.377, 5 day moving average 1.020
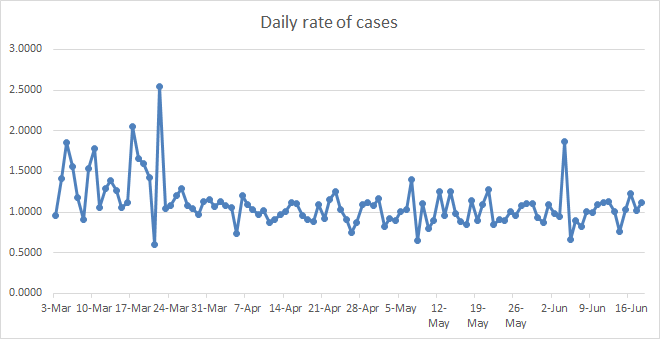
I calculated the average rate for ;
March 1.3197
April at 1.015
and the rate so far in May 0.9996


Thanks very much cutworm!
Find this data here: https://coronavirus.1point3acres.com/en
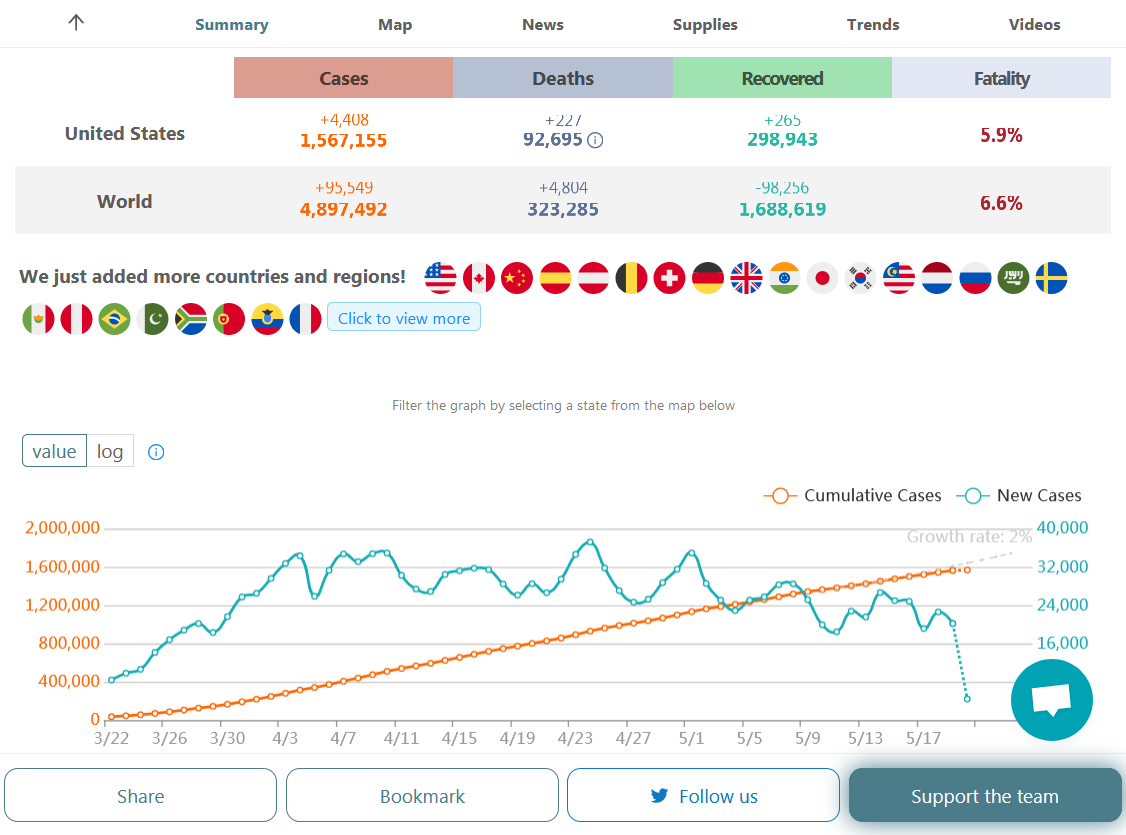
Daily new cases in blue below. Cumulative new cases in orange. Testing has doubled in the last month which is keeping the measured rate from falling faster.
https://www.marketforum.com/forum/topic/52242/
Find this data here: https://coronavirus.1point3acres.com/en
Daily new cases in blue below. Cumulative new cases in orange. Testing has doubled in the last month which is keeping the measured rate from falling faster.
https://www.marketforum.com/forum/topic/52242/
Info For these charts gleaned from https://www.worldometers.info/coronavirus/country/us/
The end date is 5-20.
Current rate 1.0912, 5 day moving average 0.970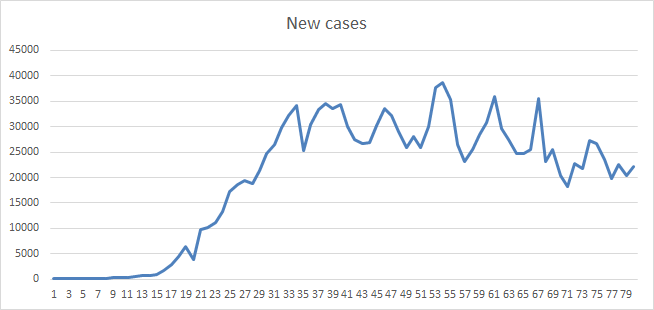


Thanks cutworm!
Find this data here: https://coronavirus.1point3acres.com/en
Daily new cases in blue below. Cumulative new cases in orange. Testing has doubled in the last month which is keeping the measured rate from falling faster.
https://www.marketforum.com/forum/topic/52242/
NEW: Warm weather and CV
https://www.marketforum.com/forum/topic/52562/
.png)
Find this data here: https://coronavirus.1point3acres.com/en
Daily new cases in blue below. Cumulative new cases in orange. Testing has doubled in the last month which is keeping the measured rate from falling faster.
https://www.marketforum.com/forum/topic/52242/
NEW: Warm weather and CV
Info For these charts gleaned from https://www.worldometers.info/coronavirus/country/us/
The end date is 5-23.
Current rate 0.9136, 5 day moving average 1.005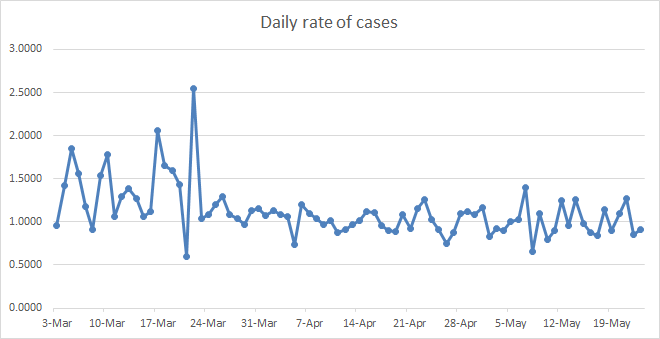
Thanks much cutworm!
Find this data here: https://coronavirus.1point3acres.com/en
Daily new cases in blue below. Cumulative new cases in orange. Testing has doubled in the last month which is keeping the measured rate from falling faster.
https://www.marketforum.com/forum/topic/52242/
Numbers continue to slowly fall.
Find this data here: https://coronavirus.1point3acres.com/en
Daily new cases in blue below. Cumulative new cases in orange. Testing has doubled in the last month which is keeping the measured rate from falling faster.
https://www.marketforum.com/forum/topic/52242/

Numbers continue to slowly fall. Todays data/graph has an error/problem with the spike way down, then way up the next day on May 15/16. Regardless of whether that stays on the graph or not.........new infections DID NOT happen that way in the real world.
Find this data here: https://coronavirus.1point3acres.com/en
Daily new cases in blue below. Cumulative new cases in orange. Testing has doubled in the last month which is keeping the measured rate from falling faster.
https://www.marketforum.com/forum/topic/52242/
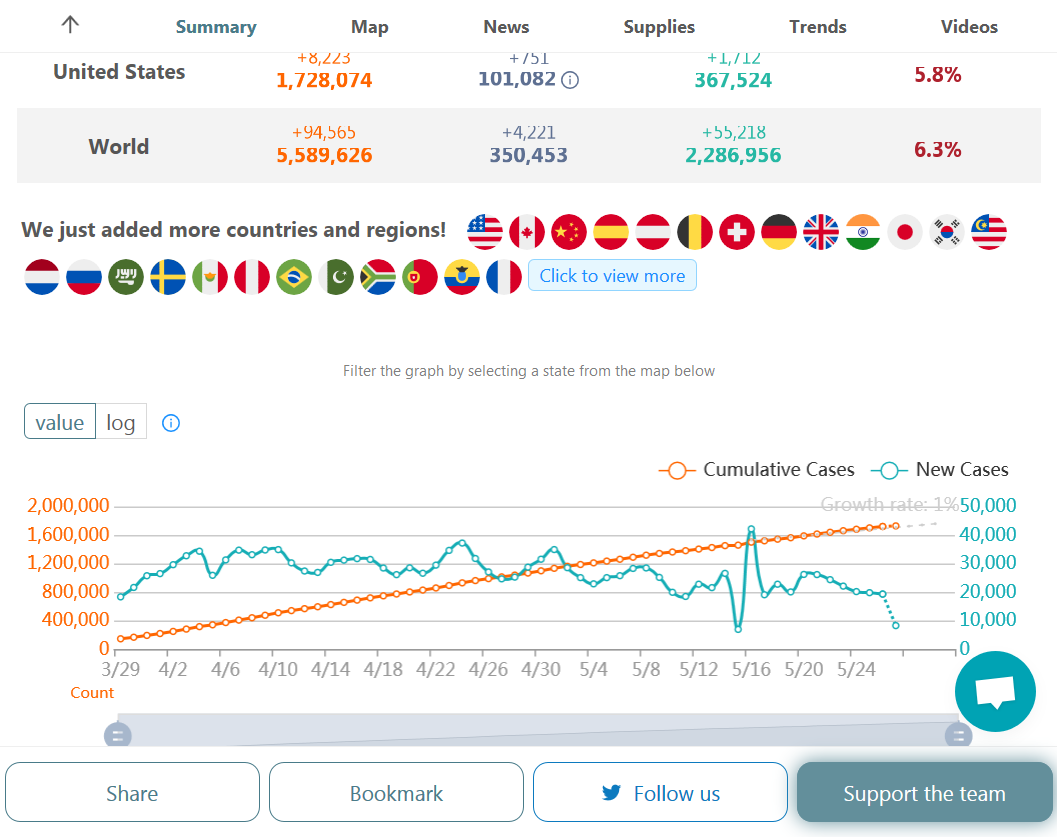
They fixed the data glitch from the map earlier today.
Numbers continue to slowly fall.
Find this data here: https://coronavirus.1point3acres.com/en
Daily new cases in blue below. Cumulative new cases in orange. Testing has doubled in the last month which is keeping the measured rate from falling faster.
https://www.marketforum.com/forum/topic/52242/
.png)
Info For these charts gleaned from https://www.worldometers.info/coronavirus/country/us/
The end date is 5-28.
Current rate 1.1028, 5 day moving average 1.009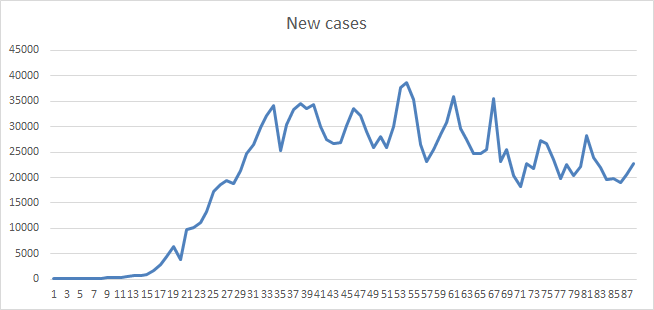

Thanks cutworm!
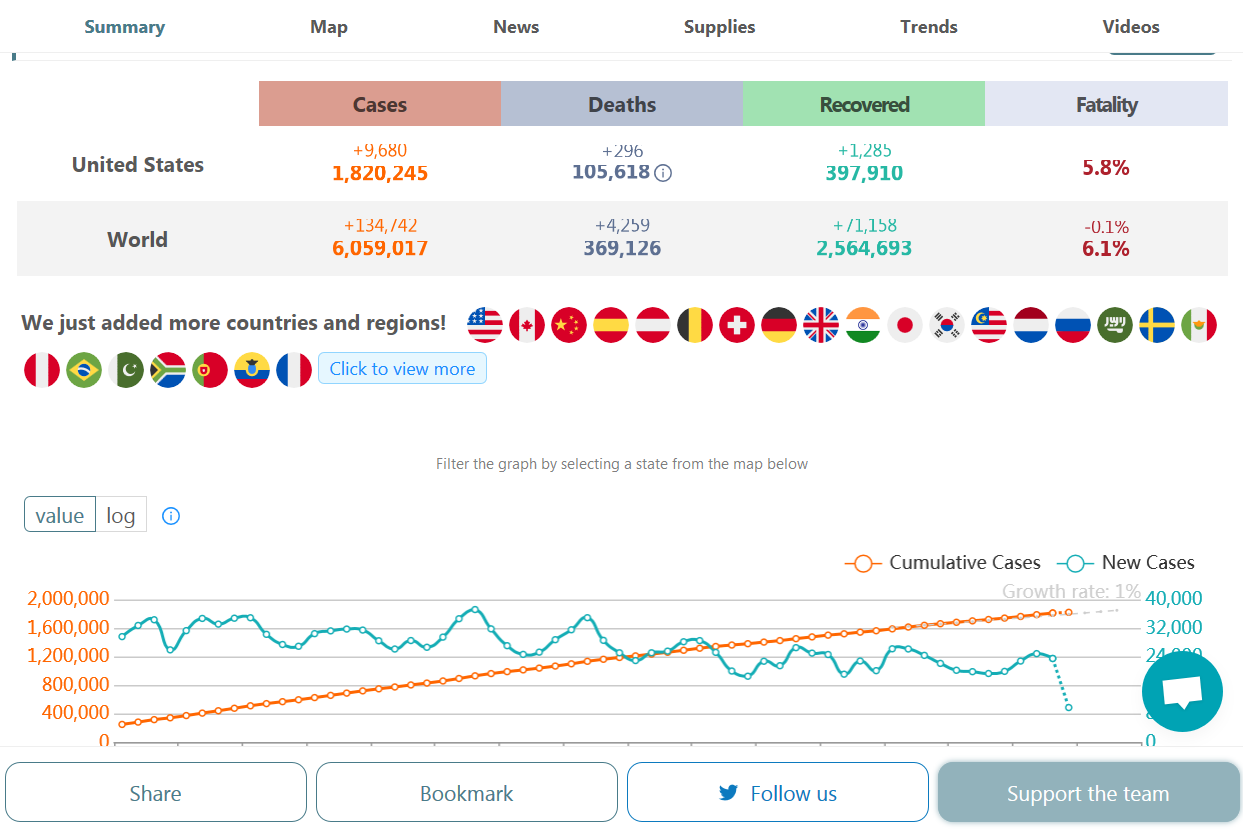
New daily positives on the much higher rate of testing is steady.
Find this data here: https://coronavirus.1point3acres.com/en
Daily new cases in blue below. Cumulative new cases in orange. Testing has doubled in the last month which is keeping the measured rate from falling..
https://www.marketforum.com/forum/topic/52242/
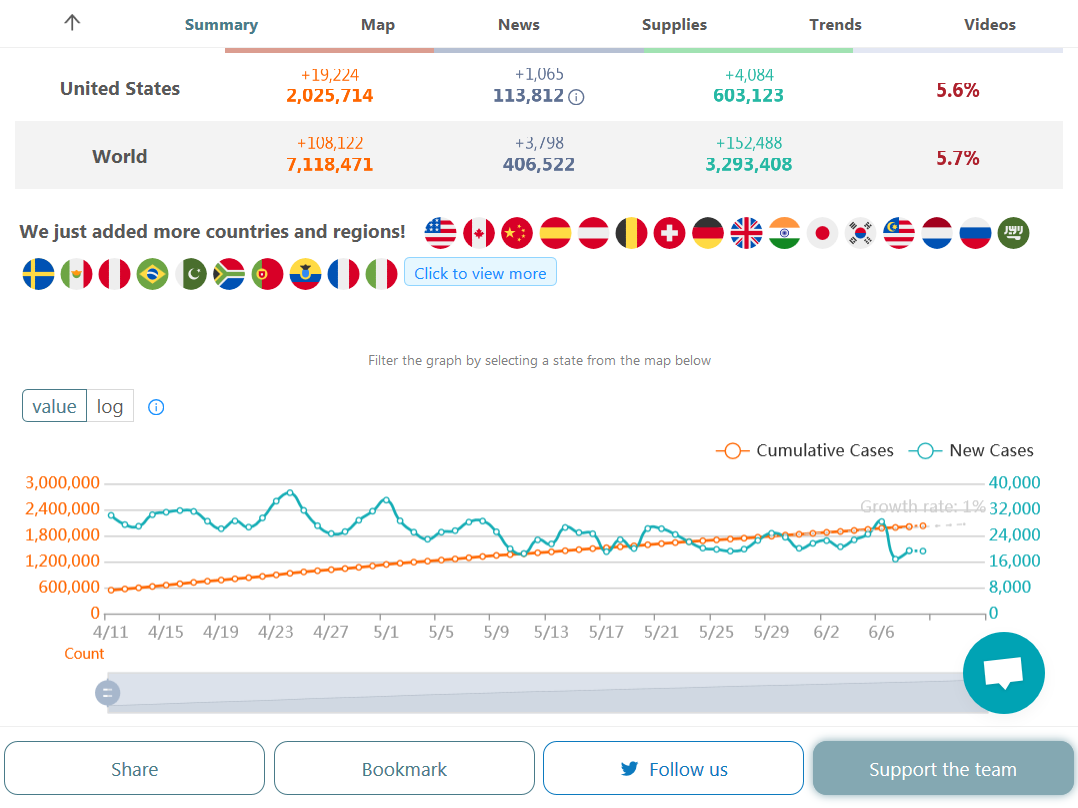
New daily positives with the much higher rate of testing and opening up is steady.
Find this data here: https://coronavirus.1point3acres.com/en
Daily new cases in blue below. Cumulative new cases in orange. Testing has doubled in the last month which is keeping the measured rate from falling..
https://www.marketforum.com/forum/topic/52242/
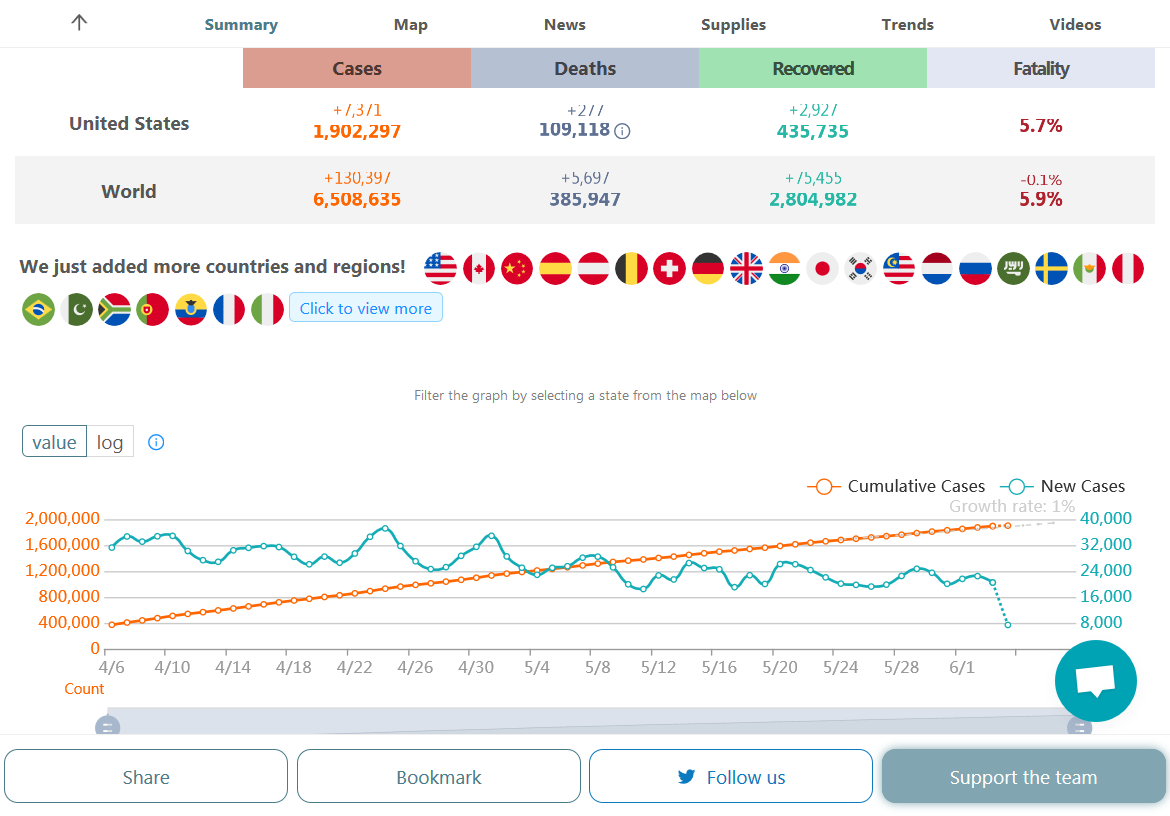
June: We have a new legit concern that millions of people discarding the known benefits of social distancing to protest, especially in urban areas that have the highest risk/incidence of COVID-19 will cause the infection rate to increase again. At the very least, it may keep numbers from falling as fast as they would have. This is not an anti protesting message. I went to a protest in our low risk community on Saturday with an N-95 mask. It's just a statement based on science. New daily positives with the much higher rate of testing and opening up is steady.
Find this data here: https://coronavirus.1point3acres.com/en
Daily new cases in blue below. Cumulative new cases in orange. Testing has doubled in the last month which is keeping the measured rate from falling..
https://www.marketforum.com/forum/topic/52242/
.png)
Info For these charts gleaned from https://www.worldometers.info/coronavirus/country/us/
The end date is 6-3.
Current rate 0.9404, 5 day moving average 0.964
Also at the site above there is a chart of deaths.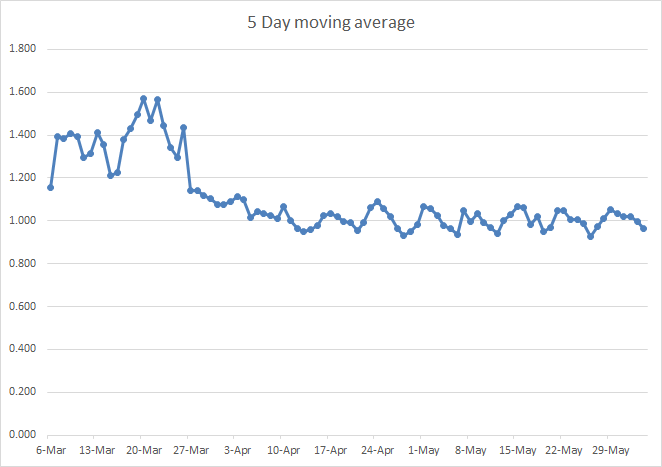

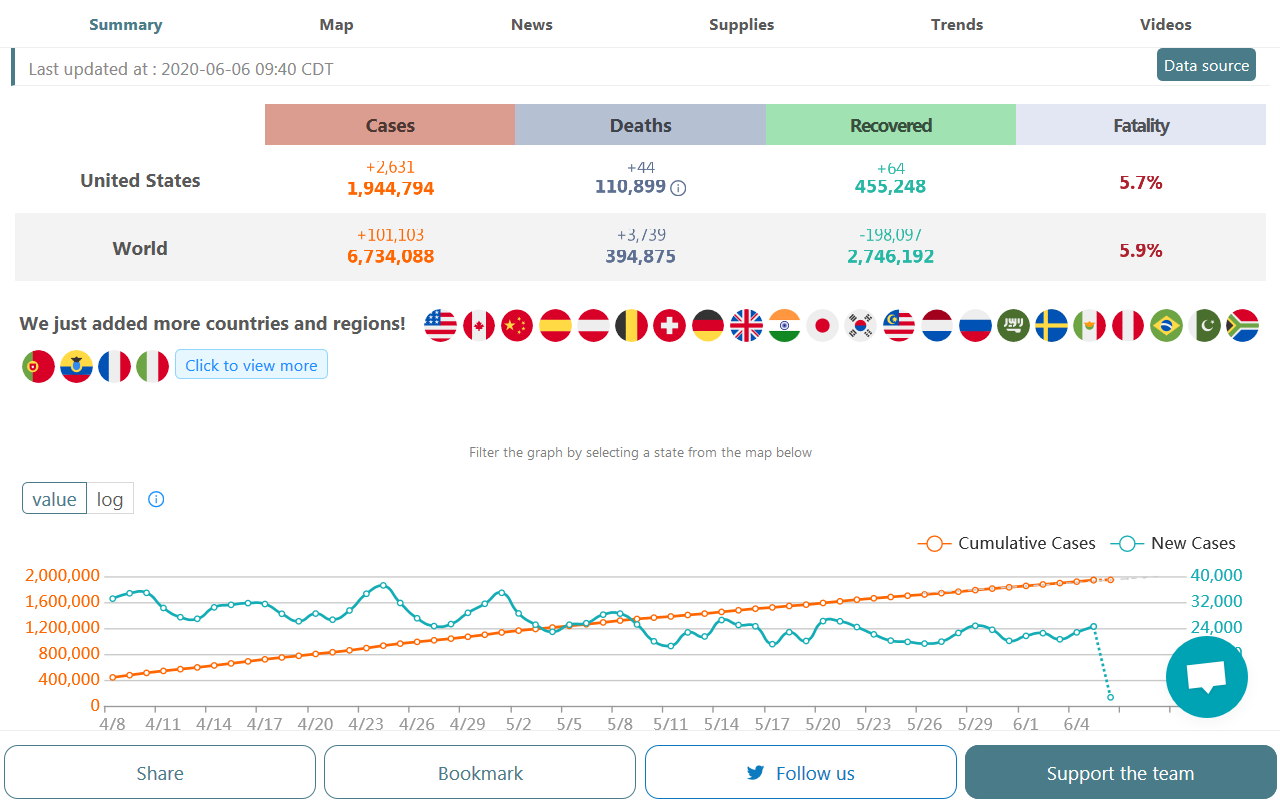
June: We have a new legit concern that millions of people discarding the known benefits of social distancing to protest, especially in urban areas that have the highest risk/incidence of COVID-19 will cause the infection rate to increase again. At the very least, it may keep numbers from falling as fast as they would have. This is not an anti protesting message. I went to a protest in our low risk community on Saturday with an N-95 mask. It's just a statement based on science.
Thanks very much cutworm!
New daily positives with the much higher rate of testing and opening up is steady.
Find this data here: https://coronavirus.1point3acres.com/en
Daily new cases in blue below. Cumulative new cases in orange. Testing has doubled in the last month which is keeping the measured rate from falling..
https://www.marketforum.com/forum/topic/52242/
We have a new legit concern that millions of people discarding the known benefits of social distancing to protest, especially in urban areas that have the highest risk/incidence of COVID-19 will cause the infection rate to increase again. At the very least, it will keep numbers from falling as fast as they would. This is not an anti protesting message. I am going to a protest in our low risk community tonight with an N-95 mask. It's just a statement based on science.
New daily positives with the much higher rate of testing and opening up is steady.
Find this data here: https://coronavirus.1point3acres.com/en
Daily new cases in blue below. Cumulative new cases in orange. Testing has doubled in the last month which is keeping the measured rate from falling..
https://www.marketforum.com/forum/topic/52242/
June 7th.............sadly, new cases may be climbing higher as we have speculated they might for the last week+. New cases Saturday were the highest in over a month.......... since May 1st.
But wait, Sunday's new case number was the LOWEST in 2 months!
WTHeck is going on?
Sundays have often featured anomalously low numbers. Based on that we can toss out the Sunday number and wait to see what the numbers are the next few days. We could be at a critical juncture.
Previous message:
June: We have a new legit concern that millions of people discarding the known benefits of social distancing to protest, especially in urban areas that have the highest risk/incidence of COVID-19 will cause the infection rate to increase again. At the very least, it may keep numbers from falling as fast as they would have. This is not an anti protesting message. I went to a protest in our low risk community on Saturday with an N-95 mask. It's just a statement based on science.
New daily positives with the much higher rate of testing and opening up is steady.
Find this data here: https://coronavirus.1point3acres.com/en
Daily new cases in blue below. Cumulative new cases in orange. Testing has doubled in the last month which is keeping the measured rate from falling..
.png)
June 8. Sometimes the numbers are hard to make sense of. Saturday was the highest number in over a month, then Sunday was the lowest number in over 2 months????? The Monday number was just a tad above Sunday.
Previous message:
June: We have a new legit concern that millions of people discarding the known benefits of social distancing to protest, especially in urban areas that have the highest risk/incidence of COVID-19 will cause the infection rate to increase again. At the very least, it may keep numbers from falling as fast as they would have. This is not an anti protesting message. I went to a protest in our low risk community on Saturday with an N-95 mask. It's just a statement based on science.
New daily positives with the much higher rate of testing and opening up is steady.
Find this data here: https://coronavirus.1point3acres.com/en
Daily new cases in blue below. Cumulative new cases in orange. Testing has doubled in the last month which is keeping the measured rate from falling.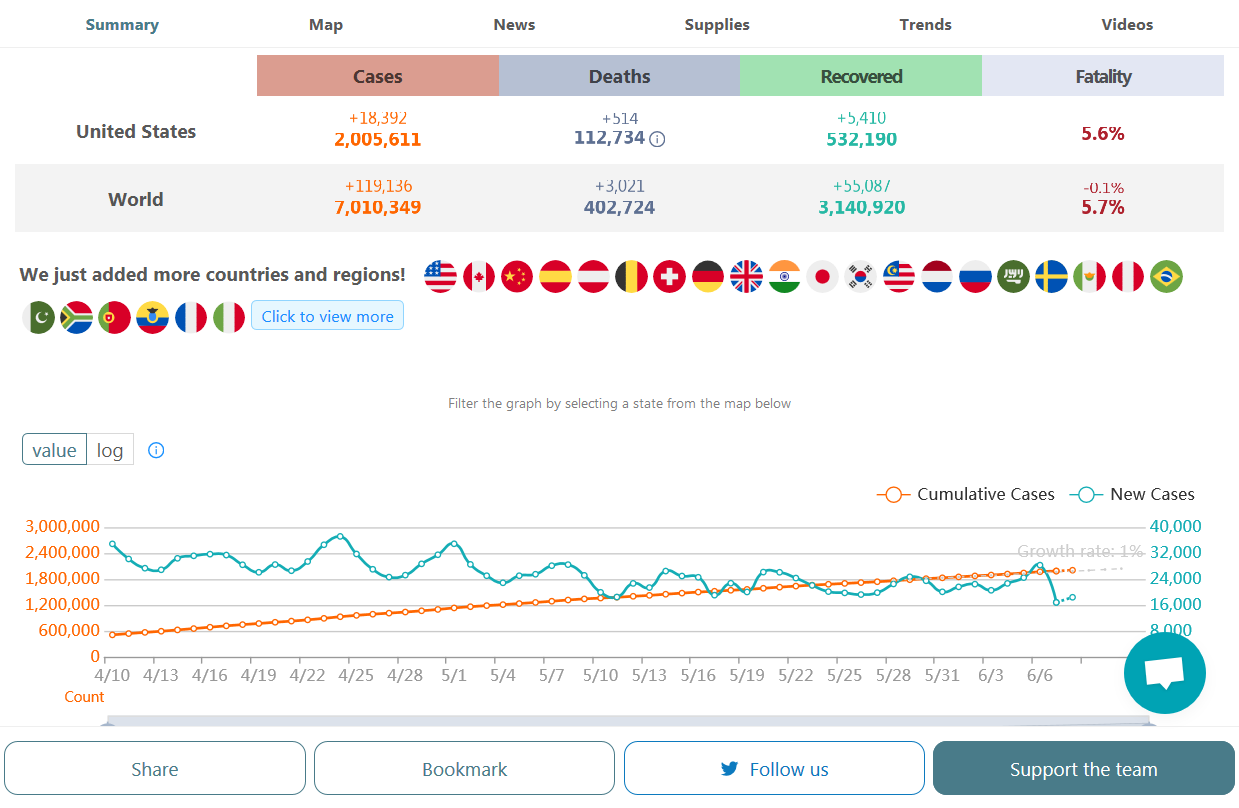
Aha! I figured out where most of the spike higher for Saturday in the national number came from............the state of Michigan.
For some strange reason, in Michigan after several days below 300 new cases last week, Saturday spiked to almost 5,500 cases(almost 20 times higher) in one day, then came back down. That's much higher than any days during the peak back in April and makes ZERO sense.
Michigan's spike higher on June 6th below sticks out as an aberration and has to be a huge mistake.
.png)
June 10. Sometimes the numbers are hard to make sense of. Saturday was the highest number in over a month, then Sunday was the lowest number in over 2 months?????
The Monday and Tuesday number was just above Sunday and still low.
Previous message:
June: We have a new legit concern that millions of people discarding the known benefits of social distancing to protest, especially in urban areas that have the highest risk/incidence of COVID-19 will cause the infection rate to increase again. At the very least, it may keep numbers from falling as fast as they would have. This is not an anti protesting message. I went to a protest in our low risk community on Saturday with an N-95 mask. It's just a statement based on science.
New daily positives with the much higher rate of testing and opening up is steady.
Find this data here: https://coronavirus.1point3acres.com/en
Daily new cases in blue below. Cumulative new cases in orange. Testing has doubled in the last month which is keeping the measured rate from falling.
 t a tad above Sunday.
Info For these charts gleaned from https://www.worldometers.info/coronavirus/country/us/
The end date is 6-9-2020.
6-9 rate ,1.0006 5 day moving average .879
I calculated the average rate for ;
March 1.3197
April at 1.015
May average rate .999204
and the rate so far in June throw out June 4th and 5th 0.96455
(ft note June 4th was a problem with reporting and possibly june 5th see Metmike post above)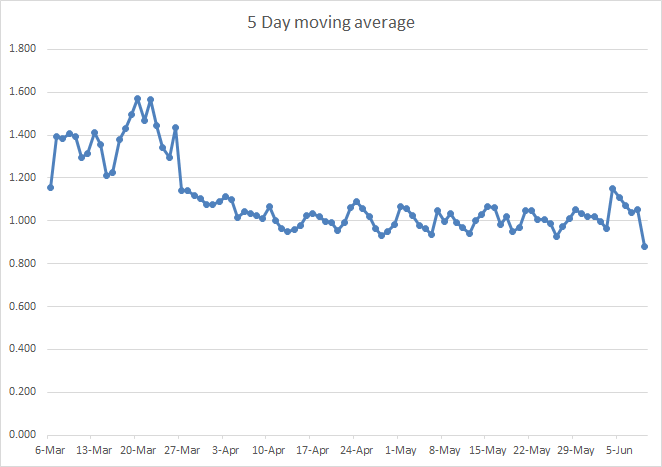
Thanks cutworm!
New daily positives with the much higher rate of testing and opening up.............and widespread protesting with no social distancing is steady.
Find this data here: https://coronavirus.1point3acres.com/en
Daily new cases in blue below. Cumulative new cases in orange. Testing has doubled in the last month which is keeping the measured rate from falling.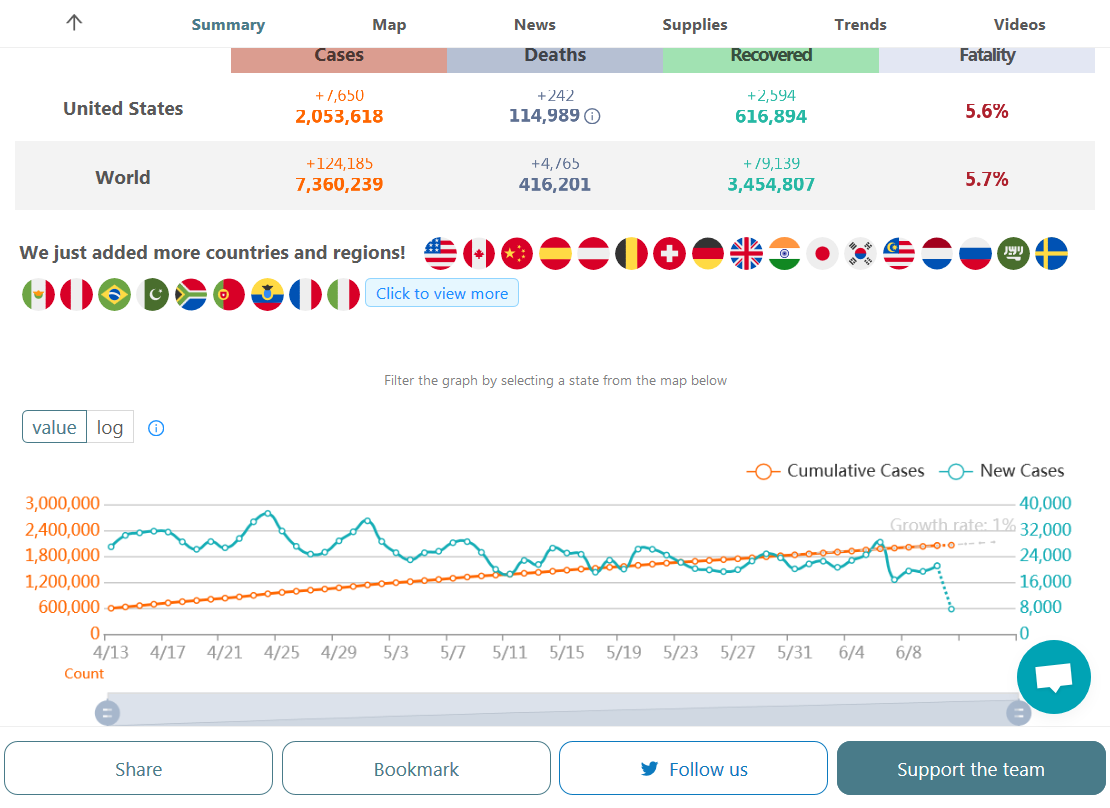
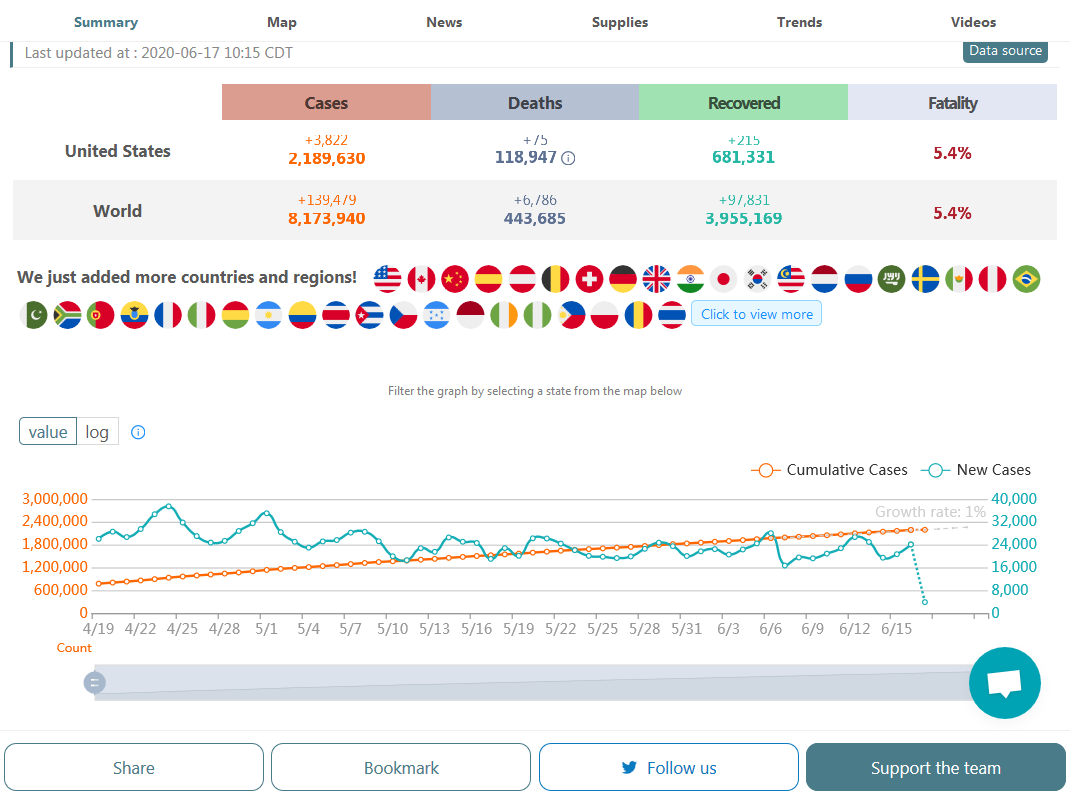
End of day on Saturday: New daily positives with the much higher rate of testing and opening up.............and widespread protesting with no social distancing is slowly/slightly increasing the last several days.
Find this data here: https://coronavirus.1point3acres.com/en
Daily new cases in blue below. Cumulative new cases in orange. Testing has doubled in the last month which is capturing many new cases that we didn't know about previously this year..png)
New daily positives with the much higher rate of testing and opening up.............and widespread protesting with no social distancing was slowly/slightly increasing last week but weekend numbers are usually unreliable, especially Sunday's that almost always report very low numbers...........so we can probably throw out today's lower number.
Find this data here: https://coronavirus.1point3acres.com/en
Daily new cases in blue below. Cumulative new cases in orange. Testing has doubled in the last month which is capturing many new cases that we didn't know about previously this year..png)
New daily positives with the much higher rate of testing and opening up.............and widespread protesting with no social distancing was increasing last week but the last few days may have dropped again?
Hasn't been a real discernible pattern this month.
Find this data here: https://coronavirus.1point3acres.com/en
Daily new cases in blue below. Cumulative new cases in orange. Testing has doubled in the last month which is capturing many new cases that we didn't know about previously this year..png)
New daily positives with the much higher rate of testing and opening up.............and widespread protesting with no social distancing was up a bit the last 2 days...........pretty steady this month.
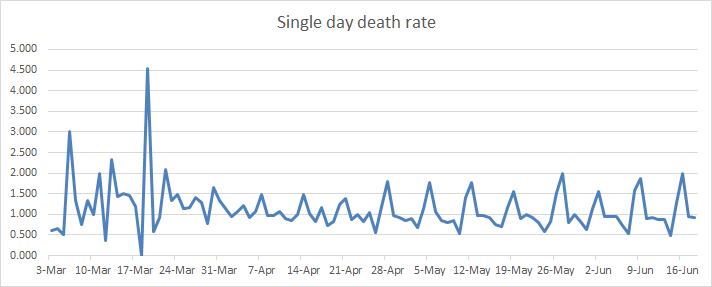
Deaths have been going down steadily for 2 months but not the last 2 days.
Find this data here: https://coronavirus.1point3acres.com/en
Daily new infection cases in zig zag blue below. Cumulative new cases in orange on graph 1.
On graph 2, deaths in zig zag purple. Totals deaths in red.
Testing has gone way up which is capturing many new cases that we didn't know about previously this year.
.png)
New daily positives with the much higher rate of testing and opening up.............and widespread protesting with no social distancing was up a bit the last several days...........pretty steady this month.
Deaths have been going down steadily for 2 months but not the last 2 days.
Find this data here: https://coronavirus.1point3acres.com/en
Daily new infection cases in zig zag blue below. Cumulative new cases in orange on graph 1.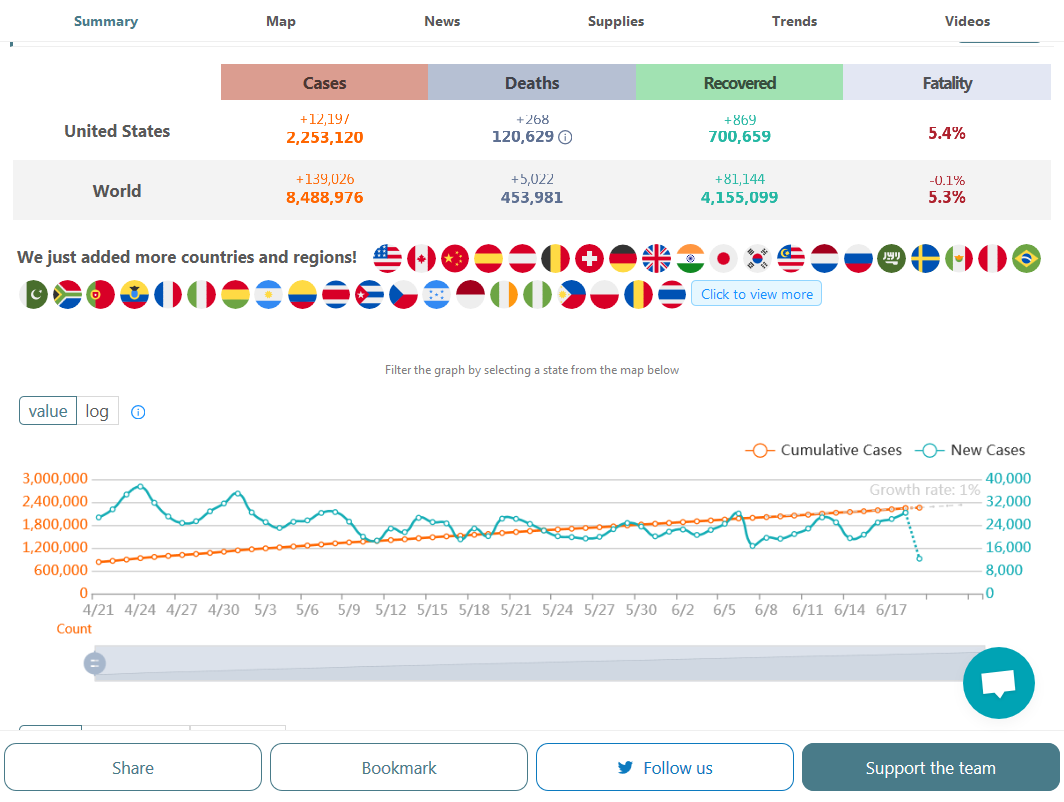
Info For these charts gleaned from https://www.worldometers.info/coronavirus/country/us/
The end date is 6-18-2020.
6-18 rate ,1.1193 5 day moving average 1.034
I calculated the average rate for ;
March 1.3197
April at 1.015
May average rate .999204
and the rate so far in June 1.0279
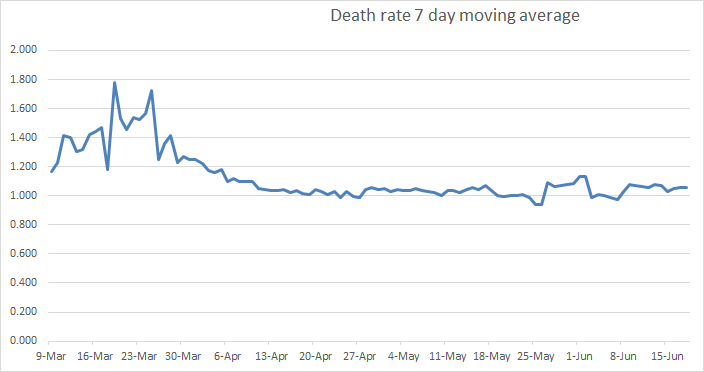
I wonder what a graph plotting Covid deaths would look like?
Tim: "I wonder what a graph plotting Covid deaths would look like?"
https://www.worldometers.info/coronavirus/country/us/
Scroll down to the next to the last plot.
That's about what I was looking for. Moving averages would be a nice addition but the trend is apparent.
Thanks PJ ..
Tim if you want just daily deaths you can go here https://www.worldometers.info/coronavirus/country/us/
I will do some death rate charts. Also PJ had some good info in another thread
Info For these charts gleaned from https://www.worldometers.info/coronavirus/country/us/
The end date is 6-18\
*fn March 18th reported 0 deaths. march 19 had 118 . That's the reason for that spike. Reported deaths spike in Tuesdays. Therefore the 7 day average.
Tim,
I can add deaths to the daily charts for you again, like I did for the previous posting before today above. Deaths are clearly still in a downtrend, where as new infections DETECTED are starting to increase a bit.
Find this data here: https://coronavirus.1point3acres.com/en
Daily new infection cases in zig zag blue below. Cumulative new cases in orange on graph 1.
On graph 2, deaths in zig zag purple. Totals deaths in red.
Testing has gone way up which is capturing many new cases that we didn't know about previously this year.
.png)
Also PJ had some good info in another thread
PJ, as usual, had some amazing stuff. I expect nothing less of him :-) But, over the years, I've become very fond of data presented with moving averages.
Moving averages and technical indicators for stocks and commodities often are followed by so many people that reactions can sometimes be a self fulfilling prophesy.
Many things in science and nature do not follow human psychology but for sure we an use graphs and technical indicators to try to interpret what is going on.
In this case, however we have a metric that is totally messing up the new infection numbers graphed and compared to the old numbers.
If we are testing 3 times as many people as we were 6 weeks ago and the rate new reported cases are down just a bit, we know that the real numbers out there are actually down much more than that but by how much?
Are the states that are increasing right now, really just staying the same and we are only seeing more testing?
Deaths is a solid indicator not affected much by that and hospitalizations. We aren't detecting a higher % of deaths now than we were in the past because of an increase in testing.
In the past..............and now, the really sick people went into the hospital and some dies, pretty similar to now.
Now, we are probably measuring a ton of people that are not that sick, that never went to the hospital before.
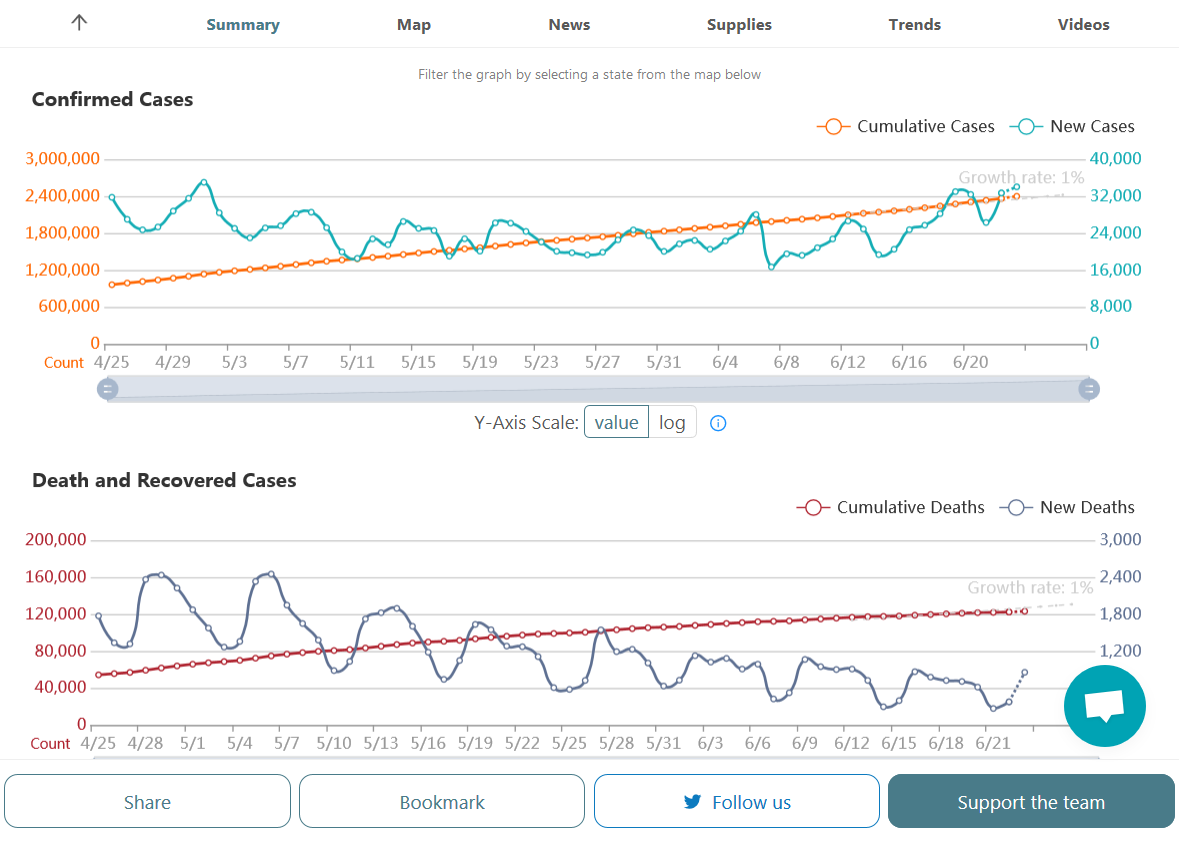
New daily positives with the much higher rate of testing and opening up.............and widespread protesting with no social distancing has gone up this past week. Friday was the highest number since May 1. Possibly, half of this is from the increase in testing. Some is surely from opening up and some from the protests.
Deaths have been going down steadily for 2 months, including last week.
Find this data here: https://coronavirus.1point3acres.com/en
Daily new infection cases in zig zag blue below. Cumulative new cases in orange on graph 1.
On graph 2, deaths in zig zag purple. Totals deaths in red.

New daily positives with the much higher rate of testing and opening up.............and widespread protesting with no social distancing has gone up this past week. Friday/Saturday were the highest numbers since May 1. Possibly, half of this is from the increase in testing. Some is surely from opening up and some from the protests.
Deaths have been going down steadily for 2 months, including last week.
Find this data here: https://coronavirus.1point3acres.com/en
Daily new infection cases in zig zag blue below. Cumulative new cases in orange on graph 1.
On graph 2, deaths in zig zag purple. Totals deaths in red.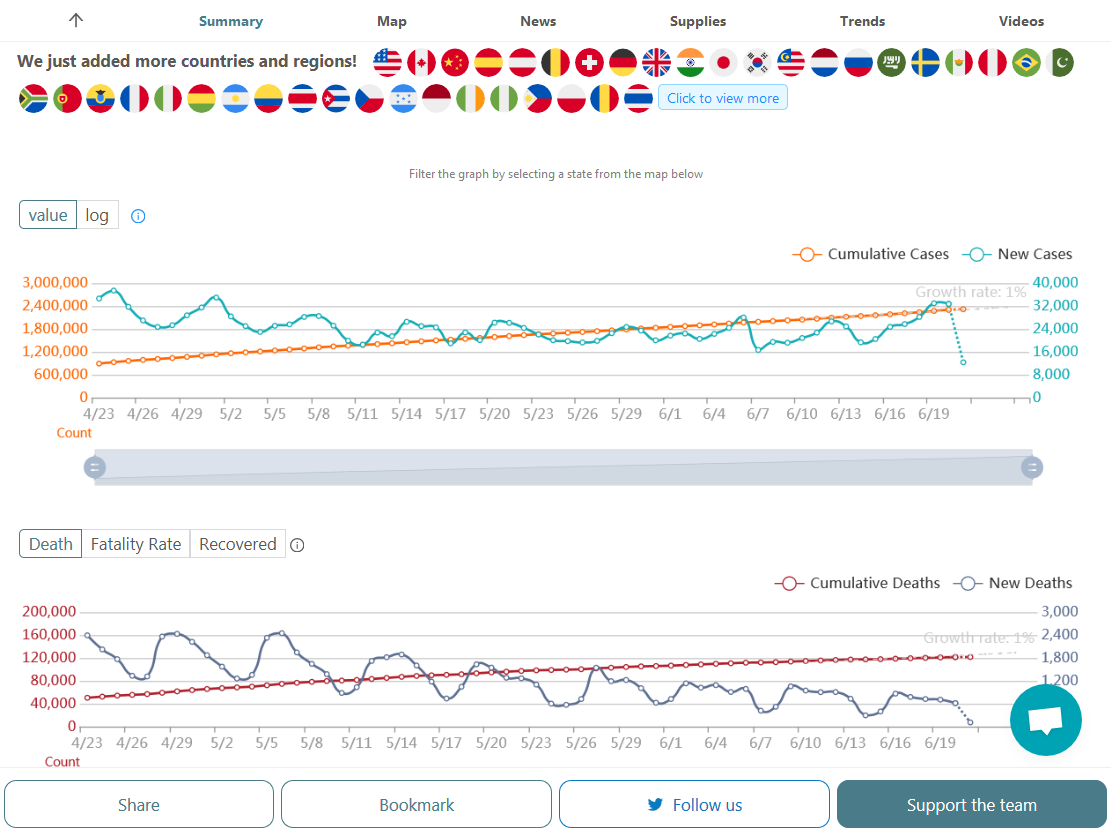
New daily positives with the much higher rate of testing and opening up.............and widespread protesting with no social distancing went up last week. Friday/Saturday were the highest numbers since May 1. Possibly, half of this is from the increase in testing. Some is surely from opening up and some from the protests.
Deaths have been going down steadily for 2 months, including last week.
Find this data here: https://coronavirus.1point3acres.com/en
Daily new infection cases in zig zag blue below. Cumulative new cases in orange on graph 1.
On graph 2, deaths in zig zag purple. Totals deaths in red..png)
New daily positives with the much higher rate of testing and opening up.............and widespread protesting with no social distancing have been going up the last 2 weeks. Todays number is the highest since May 1. Possibly, half of this is from the increase in testing. Some is surely from opening up and poor habits and some from the protests.
Deaths have been going down steadily for 2 months but spiked higher today.
Find this data here: https://coronavirus.1point3acres.com/en
Daily new infection cases in zig zag blue below. Cumulative new cases in orange on graph 1.
On graph 2, deaths in zig zag purple. Totals deaths in red.
New daily positives with the much higher rate of testing and opening up.............and widespread protesting with no social distancing have been going up the last 2 weeks. Thursday set a new high for new cases. Possibly, over half of this is from the increase in testing. Some is surely from opening up and poor habits and some from the protests.
Deaths have been going down steadily for 2 months but those spiked higher on Thursday.
Find this data here: https://coronavirus.1point3acres.com/en
Daily new infection cases in zig zag blue below. Cumulative new cases in orange on graph 1.
On graph 2, deaths in zig zag purple. Totals deaths in red.
.png)
https://www.worldometers.info/coronavirus/country/us/
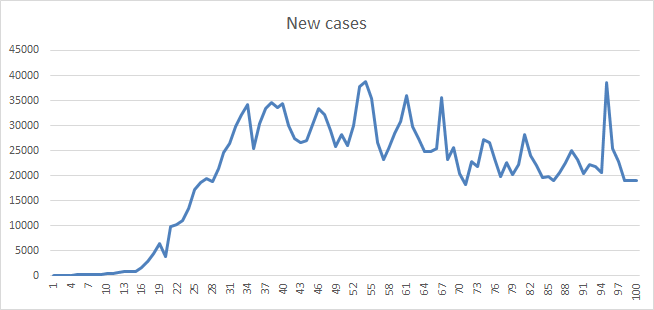
The data that I relied on to make the above charts has been changed! The data that I stored on my computer no longer matches the info given on the above site that they reported on a daily biases. I don't know why, I did not see anything about updating the data.
Below is the total cases I have on my computer; it is new cases.
| 1-Mar | 75 |
| 2-Mar | 100 |
| 3-Mar | 124 |
| 4-Mar | 158 |
| 5-Mar | 221 |
| 6-Mar | 319 |
| 7-Mar | 435 |
| 8-Mar | 541 |
| 9-Mar | 704 |
| 10-Mar | 994 |
| 11-Mar | 1,301 |
| 12-Mar | 1,697 |
| 13-Mar | 2,247 |
| 14-Mar | 2,943 |
| 15-Mar | 3,680 |
| 16-Mar | 4,503 |
| 17-Mar | 6,196 |
| 18-Mar | 9,003 |
| 19-Mar | 13,474 |
| 20-Mar | 19,871 |
| 21-Mar | 23,729 |
| 22-Mar | 33,566 |
| 23-Mar | 43,781 |
| 24-Mar | 54,856 |
| 25-Mar | 68,211 |
| 26-Mar | 85,435 |
| 27-Mar | 104,126 |
| 28-Mar | 123,578 |
| 29-Mar | 142,460 |
| 30-Mar | 163,844 |
| 31-Mar | 188,530 |
| 1-Apr | 215,003 |
| 2-Apr | 244,877 |
| 3-Apr | 277,161 |
| 4-Apr | 311,357 |
| 5-Apr | 336,673 |
| 6-Apr | 367,004 |
| 7-Apr | 400,355 |
| 8-Apr | 434,927 |
| 9-Apr | 468,566 |
| 10-Apr | 502,876 |
| 11-Apr | 532,879 |
| 12-Apr | 560,300 |
| 13-Apr | 586,941 |
| 14-Apr | 613,886 |
| 15-Apr | 644,089 |
| 16-Apr | 677,570 |
| 17-Apr | 709,735 |
| 18-Apr | 738,792 |
| 19-Apr | 764,636 |
| 20-Apr | 792,759 |
| 21-Apr | 818,744 |
| 22-Apr | 848,717 |
| 23-Apr | 886,442 |
| 24-Apr | 925,232 |
| 25-Apr | 960,651 |
| 26-Apr | 987,160 |
| 27-Apr | 1,010,356 |
| 28-Apr | 1,035,765 |
| 29-Apr | 1,064,194 |
| 30-Apr | 1,095,023 |
| 1-May | 1,131,030 |
| 2-May | 1,160,744 |
| 3-May | 1,188,122 |
| 4-May | 1,212,835 |
| 5-May | 1,237,633 |
| 6-May | 1,263,092 |
| 7-May | 1,298,623 |
| 8-May | 1,321,785 |
| 9-May | 1,347,309 |
| 10-May | 1,367,638 |
| 11-May | 1,385,834 |
| 12-May | 1,408,636 |
| 13-May | 1,430,347 |
| 14-May | 1,457,593 |
| 15-May | 1,484,285 |
| 16-May | 1,507,773 |
| 17-May | 1,527,664 |
| 18-May | 1,550,294 |
| 19-May | 1,570,583 |
| 20-May | 1,592,723 |
| 21-May | 1,620,897 |
| 22-May | 1,644,899 |
| 23-May | 1,666,828 |
| 24-May | 1,686,436 |
| 25-May | 1,706,226 |
| 26-May | 1,725,257 |
| 27-May | 1,745,803 |
| 28-May | 1,768,461 |
| 29-May | 1,793,530 |
| 30-May | 1,816,820 |
| 31-May | 1,837,170 |
| 1-Jun | 1,859,323 |
| 2-Jun | 1,881,205 |
| 3-Jun | 1,901,783 |
| 4-Jun | 1,940,315 |
| 5-Jun | 1,965,708 |
| 6-Jun | 1,988,544 |
| 7-Jun | 2,007,449 |
| 8-Jun | 2,026,493 |
| 9-Jun | 2,045,548 |
| 10-Jun | 2,066,401 |
| 11-Jun | 2,089,701 |
| 12-Jun | 2,115,922 |
| 13-Jun | 2,142,224 |
| 14-Jun | 2,162,228 |
| 15-Jun | 2,182,950 |
| 16-Jun | 2,208,400 |
| 17-Jun | 2,234,471 |
| 18-Jun | 2,263,651 |
Thanks cutworm!
New daily positives with the much higher rate of testing and opening up.............and widespread protesting with no social distancing have been going up the last 2 weeks. Thursday set a new high for new cases. Possibly, over half of this is from the increase in testing. Some is surely from opening up and poor habits and some from the protests.
Deaths have been going down steadily for 2 months but those spiked higher on Thursday.
Find this data here: https://coronavirus.1point3acres.com/en
Daily new infection cases in zig zag blue below. Cumulative new cases in orange on graph 1.
On graph 2, deaths in zig zag purple. Totals deaths in red.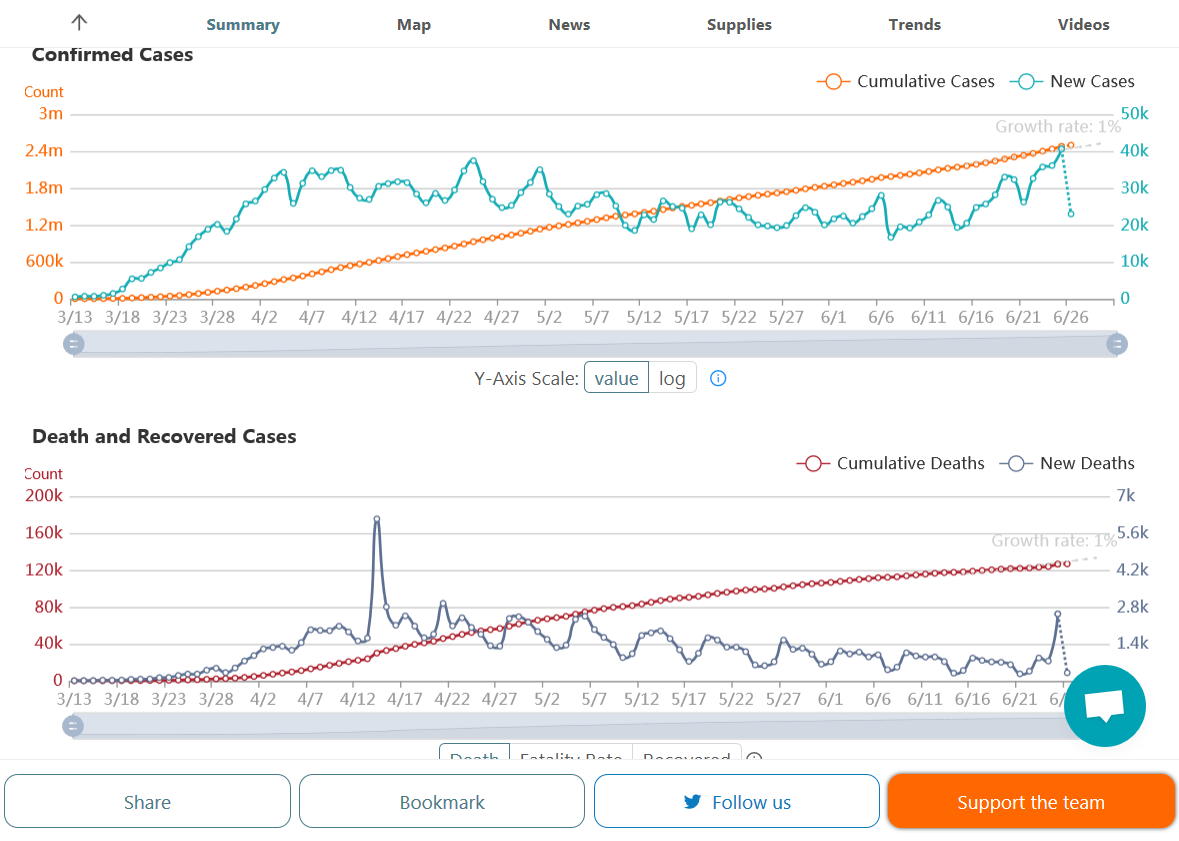
New daily positives with the much higher rate of testing and opening up.............and widespread protesting with no social distancing have been going up the last 2 weeks. Friday set a new high for new cases. Possibly, over half of this is from the increase in testing. Some is surely from opening up and poor habits and some from the protests.
Deaths have been going down steadily for 2 months but those spiked higher for 1 day, on Thursday.
Find this data here: https://coronavirus.1point3acres.com/en
Daily new infection cases in zig zag blue below. Cumulative new cases in orange on graph 1.
On graph 2, deaths in zig zag purple. Totals deaths in red.
New daily positives with the much higher rate of testing and opening up.............and widespread protesting with no social distancing have been going up the last 2 weeks. Friday set a new high for new cases. Saturday and Sundays new cases were still aboe the old highs back in April. Possibly, over half of this is from the increase in testing. Some is surely from opening up and poor habits and some from the protests.
Deaths have been going down steadily for 2 months but those spiked higher for 1 day, on Thursday.
Find this data here: https://coronavirus.1point3acres.com/en
Daily new infection cases in zig zag blue below. Cumulative new cases in orange on graph 1.
On graph 2, deaths in zig zag purple. Totals deaths in red..png)
New daily positives with the much higher rate of testing and opening up.............and widespread protesting with no social distancing have been going up the last 2 weeks. Possibly, over half of this is from the increase in testing. Some is surely from opening up and poor habits and some from the protests.
Deaths have been going down steadily for 2 months but those spiked higher for 1 day, on Thursday.
Find this data here: https://coronavirus.1point3acres.com/en
Daily new infection cases in zig zag blue below. Cumulative new cases in orange on graph 1.
On graph 2, deaths in zig zag purple. Totals deaths in red.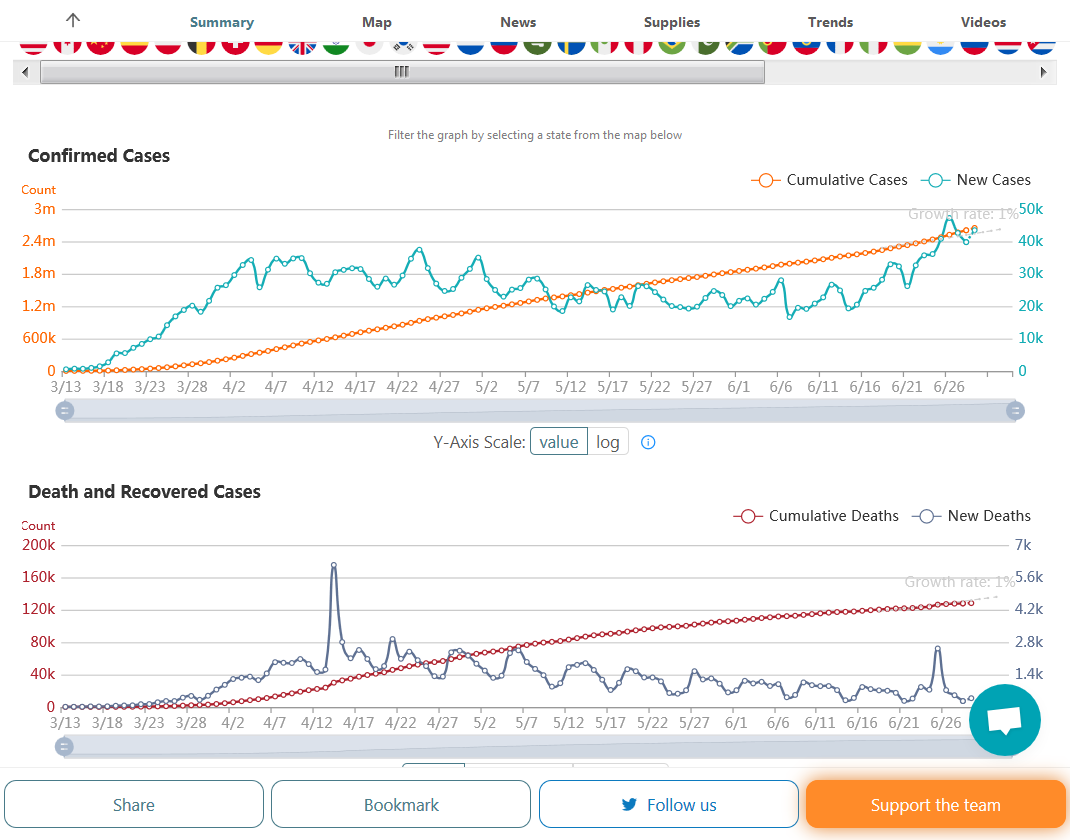
New daily positives with the much higher rate of testing and opening up.............and widespread protesting with no social distancing have been going up the last 2 weeks. Possibly, over half of this is from the increase in testing. Some is surely from opening up and poor habits and some from the protests.
Deaths have been going down steadily for 2 months those spiked higher for 1 day, last Thursday but have not been increasing.
Find this data here: https://coronavirus.1point3acres.com/en
Daily new infection cases in zig zag blue below. Cumulative new cases in orange on graph 1.
On graph 2, deaths in zig zag purple. Totals deaths in red.
New daily positives with the much higher rate of testing and opening up.............and widespread protesting with no social distancing have been going up the last 2 weeks. Possibly, over half of this is from the increase in testing. Some is surely from opening up and poor habits/lack of precautions and some from the protests.
Deaths had been going down steadily for 2 months but could be turning higher. The next 2 weeks will tell us a great deal(the time lag between testing positive and dying in many cases).
Find this data here: https://coronavirus.1point3acres.com/en
Daily new infection cases in zig zag blue below. Cumulative new cases in orange on graph 1.
On graph 2, deaths in zig zag purple. Totals deaths in red..png)
MIke come on man...
the data is clear.... the BLM protesting had NO impact at all on the rising Covid 19 cases in the conservative southern ignore science states. In fact there very few if any significant BLM protests in GA SC NC FL TX AZ LA MO TN AL
https://apnews.com/a7acb77702b740cfb17d84023482417a
or here
https://www.kqed.org/science/1966378/no-coronavirus-spike-from-black-lives-matter-protests-experts-say
Right Dave,
The most contagious virus in our lifetime with a million people, often packed together for long periods but most of them wearing masks and there was no spread of the virus?
Fortunately the science is telling us that its much harder to spread the virus outdoors vs indoors and this was a great real life laboratory experiment with the protestors as the guinea pigs.
When I attended a local BLM protest last month, I wore an N-95 mask. Every body there had masks. There were around 300 people there.
They took them off to speak in to the microphone but that was about the only time.
I was not worried about getting COVID, for numerous reasons.......outdoors........ people wore masks and we have very low numbers in this county of Indiana.
I have not been wearing a mask to when going to the store because I don't have it and numbers are so low here.
However, when I go to visit my Dad in Detroit in a month, I will be wearing a mask EVERYWHERE that I go because COVID cases are so much higher.
In his county Wayne county, during April cases were so high that they were coming in higher than 41 entire states..........just that one county.
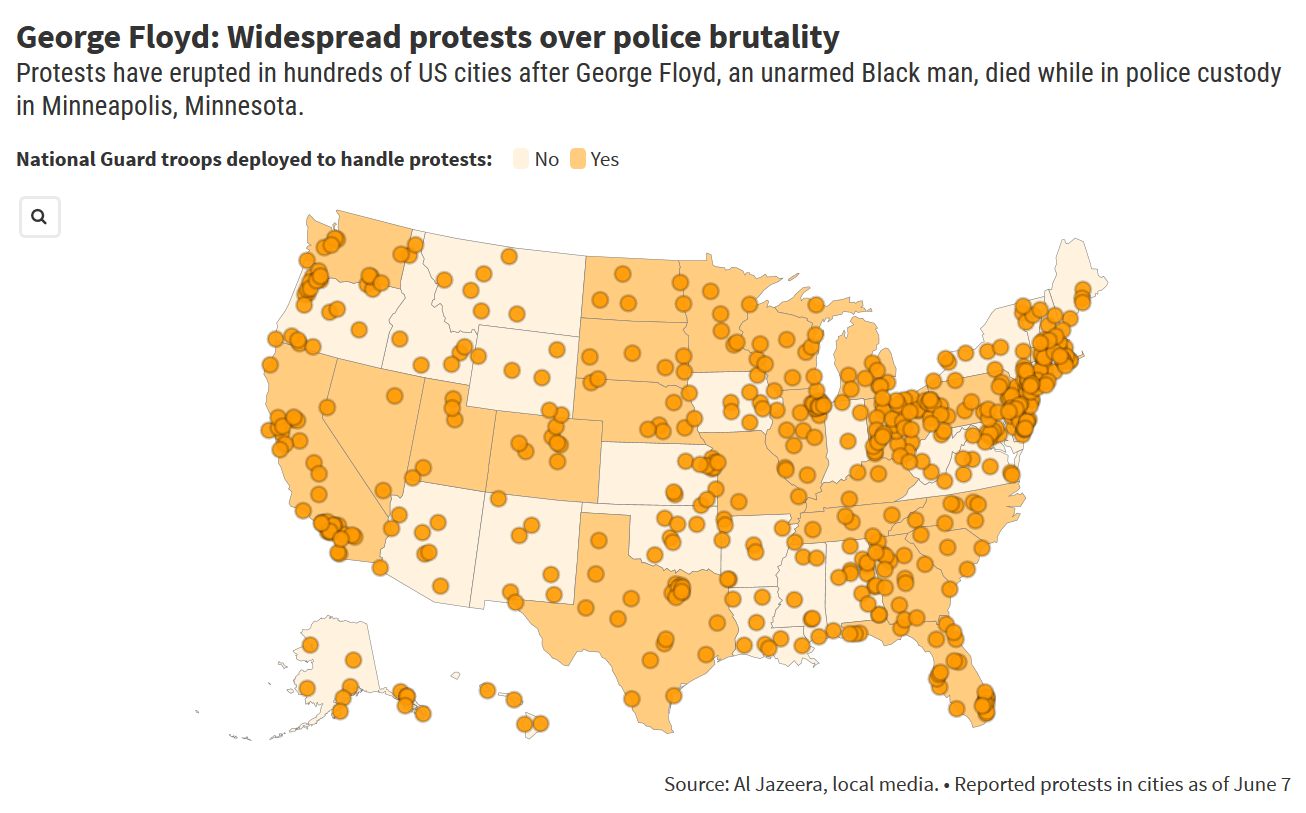
I don't know about the rest of those states, 1st hand, but anyone who says there are no BLM or assorted other protests in Atlanta Ga is obviously not paying attention. I'll leave the rest of my comments to your imagination,
Good point Tim!
Let's put wxdavid's superior science to the test.
"ignore science states. In fact there very few if any significant BLM protests in GA SC NC FL TX AZ LA MO TN AL"
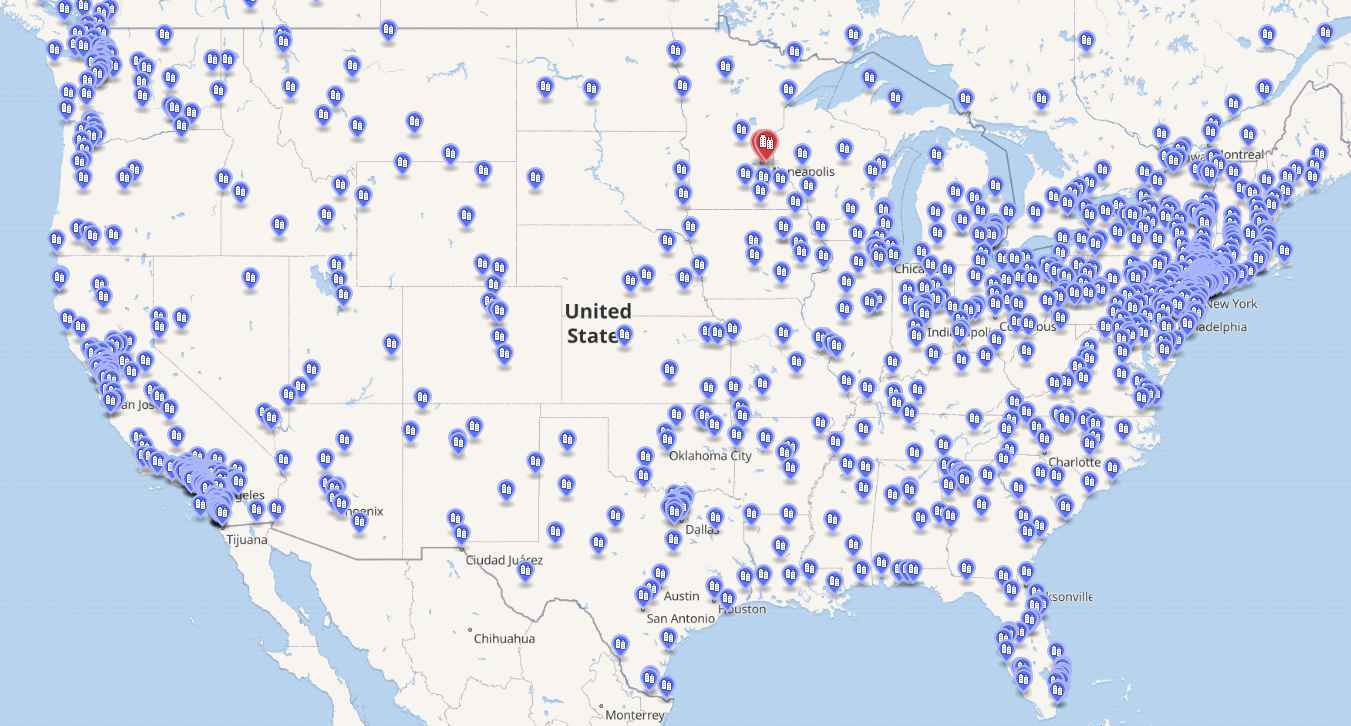
Checking the actual data, I found protests in cities of each state listed by Dave, with the number of cities listed . Actual protest numbers are much higher because many of these cities feature ongoing protests-more than 1 protest:
GA-15 cities
SC-9 cities
NC-15 cities
FL-29 cities
TX-25 cities
AZ-10 cities
LA-7 cities
MO-7 cities
TN-6 cities
AL-11 cities
That would be 135 cities where significant protests are being held in the 10 states that Dave said this about: "there very few if any significant BLM protests"
Many of those cities have been having numerous protests.
https://en.wikipedia.org/wiki/List_of_George_Floyd_protests_in_the_United_States
"One report, by the Bellevue-based Institute for Disease Modeling, examined the ages of people becoming infected by the coronavirus pandemic. It found that people under age 35 represented 22% of cases from January to March, but by May and June that younger population represented 46 percent of cases.
That report also found that infection rates are rising faster among communities of color than among the white population"
metmike: What a strange coincidence. That's EXACTLY the age and racial distribution of the protesters.
For people to think that a million protesters can be smashed together for long periods during the pandemic with the most contagious virus in our life time rampant and only need for most of them to wear masks for hardly anyone to get COVID is not using critical thinking.
Trumps rally in OK was really, really, really dumb, especially with very few people wearing masks(add a few more really's because of that).
Out of 6,000 people that showed up, certainly some had COVID(maybe none of them knew it) and for sure others sitting by them got it from them.
Let's just say that less than 1% had COVID, hypothetical very conservative number of 30.
Out of those 30, many could have been contagious and some super carriers. So they could have easily spread it to 100+ other people(again, being conservative because the numbers could have been much higher).
Out of those 100 that get/got it, they will then spread it to hundreds of others after the rally...........and its out of control. Some of those people will die.
With the protests, wearing a mask makes it much safer(small risk) but not completely safe. You are multiplying the rally numbers by 200!
If you have a small number and multiply it by a big enough number............that number becomes BIG!
The people exposed to COVID from the protests was a big number.
We see reports of dozens, even hundreds getting positive results from a bar in Kalamazoo. Wouldn't the press be all over incidents resulting from a Trump rally? Weird Huh?