KEY EVENTS TO WATCH FOR:
Thursday, May 21, 2020
8:30 AM ET. Unemployment Insurance Weekly Claims Report - Initial Claims
Jobless Claims (expected 2450K; previous 2981K)
Jobless Claims, Net Chg (previous -195K)
Continuing Claims (previous 22833000)
Continuing Claims, Net Chg (previous +456K)
8:30 AM ET. U.S. Weekly Export Sales
Corn (Metric Tons) (previous 1627.7K)
Soybeans (Metric Tons) (previous 1095.5K)
Wheat (Metric Tons) (previous 353.3K)
8:30 AM ET. May Philadelphia Fed Business Outlook Survey
Business Activity (expected -45.0; previous -56.6)
Prices Paid (previous -9.3)
Employment (previous -46.7)
New Orders (previous -70.9)
Prices Received (previous -10.6)
Delivery Times (previous 4.1)
Inventories (previous -10.2)
Shipments (previous -74.1)
9:45 AM ET. Bloomberg Consumer Comfort Index
9:45 AM ET. May US Flash Manufacturing PMI
PMI, Mfg (expected 38.0; previous 36.9)
9:45 AM ET. May US Flash Services PMI
PMI, Services (expected 28.8; previous 27.0)
10:00 AM ET. April Existing Home Sales
Existing Sales (expected 4.35M; previous 5.27M)
Existing Sales, M/M% (expected -17.5%; previous -8.5%)
Unsold Homes Month's Supply (previous 3.4)
Median Price (USD) (previous 280600)
Median Home Price, Y/Y% (previous +8.0%)
10:00 AM ET. April Leading Indicators
Leading Index, M/M% (expected -5.1%; previous -6.7%)
Leading Index (previous 104.2)
Coincident Index, M/M% (previous -0.9%)
Lagging Index, M/M% (previous +1.2%)
10:00 AM ET. SEC Investor Advisory Committee Quarterly Meeting
10:30 AM ET. EIA Weekly Natural Gas Storage Report
Working Gas In Storage (Cbf) (previous 2422B)
Working Gas In Storage, Net Chg (Cbf) (previous +103B)
4:30 PM ET. Foreign Central Bank Holdings
4:30 PM ET. Federal Discount Window Borrowings
4:30 PM ET. Money Stock Measures
Friday, May 22, 2020
10:00 AM ET. April Regional & State Employment & Unemployment
Monday, May 25, 2020
N/A U.S.: Memorial Day. Financial markets closed
N/A U.S: Jefferson Davis' Birthday holiday in Mississippi
The STOCK INDEXES http://quotes.ino.com/exchanges/?c=indexes"
The STOCK INDEXES:The June NASDAQ 100 was lower in late-overnight trading as it consolidates some of this week's gains. The low-range trade sets the stage for a steady to lower opening when the day session begins trading. Stochastics and the RSI are overbought but remain neutral to bullish signaling that sideways to higher prices are possible near-term. If June extends the rally off March's low, February's high crossing at 9780.50 is the next upside target. Closes below the 20-day moving average crossing at 9054.81 would confirm that a short-term top has been posted. First resistance is the overnight high crossing at 9503.25. Second resistance is February's high crossing at 9780.50. First support is the 20-day moving average crossing at 9054.81. Second support is the May 14th low crossing at 8847.00.
The June S&P 500 was lower in late-overnight trading. The low-range overnight trade sets the stage for a steady to lower opening when the day session begins trading later this morning.Stochastics and the RSI are overbought but remain neutral to bullish signaling that sideways to higher prices are possible near-term. If June extends the rally off March's low, the 75% retracement level of the February-March-decline crossing at 3081.80 is the next upside target. Closes below the May 14th low crossing at 2780.70 would confirm that a short-term top has been posted. First resistance is the overnight high crossing at 2971.50. Second resistance is the 75% retracement level of the February-March-decline crossing at 3081.80. First support is May 14th low crossing at 2780.70. Second support is the reaction low crossing at 2720.20.
INTEREST RATES http://quotes.ino.com/ex changes/?c=interest"
INTEREST RATES: June T-bonds were slightly higher in late-overnight trading. Stochastics and the RSI are turning neutral to bullish signaling that sideways to higher prices are possible near-term. Closes above the 20-day moving average crossing at 180-10 would temper the near-term bearish outlook. If June extends the decline off last-Friday's high, April's low crossing at 177-14 is the next downside target. Multiple closes below April's low crossing at 177-14 would mark a downside breakout of the April-May trading range. First resistance is the March 12th high crossing at 184-07. Second resistance is March's high crossing at 191-22. First support is Tuesday's low crossing at 177-26. Second support is April's low crossing at 177-14.
June T-notes were slightly higher overnight. The mid-range overnight trade sets the stage for a steady to higher opening with the day session begins trading. Stochastics and the RSI are turning neutral to bullish signaling that sideways to higher prices are possible near-term. If June extends the rally off Monday's low, March's high crossing at 140.240 is the next upside target. Closes below the April 7th low crossing at 137.160 would mark a downside breakout of the April-May trading range while opening the door for additional weakness near-term. First resistance is the April 21st high crossing at 139.220. Second resistance is March's high crossing at 140.240. First support is the 50-day moving average crossing at 138.124. Second support is the April 7th low crossing at 137.160.
ENERGY MARKETS? http://quotes.ino.com/ex?changes/?c=energy ""
July crude oil was slightly higher in overnight trading.The high-range overnight trade sets the stage for a steady to higher opening when the day session begins trading. Stochastics and the RSI are overbought but remain neutral to bullish signaling that sideways to higher prices are possible near-term. If July extends the rally off April's low, the 50% retracement level of the February-April-decline crossing at $40.12 is the next upside target. Closes below the 20-day moving average crossing at $25.74 would signal that a short-term top has been posted. First resistance is the 38% retracement level of the February-April-decline crossing at $34.74. Second resistance is the 50% retracement level of the February-April-decline crossing at $40.12. First support is the 10-day moving average crossing at $29.28. Second support is the 20-day moving average crossing at $25.74.
July heating oil was higher overnight. The high-range overnight trade sets the stage for a steady to higher opening when the day session begins trading. Stochastics and the RSI are overbought but remain neutral to bullish signaling that sideways to higher prices are possible near-term. If July extends the rally off April's low, April's high crossing at $118.84 is the next upside target. First resistance is the 25% retracement level of the February-April-decline crossing at $107.30. Second resistance is the 38% retracement level of the February-April-decline crossing at $124.97. First support is the 20-day moving average crossing at $90.91. Second support is April's low crossing at $74.39.
July unleaded gas was higher overnight as it extends the rally off April's low. The high-range late-overnight trade sets the stage for a steady to higher opening when the day session begins trading. Stochastics and the RSI are overbought but remain neutral to bullish signaling that sideways to higher prices are possible near-term. If July extends the rally off April's low, the 50% retracement level of the January-March-decline crossing at $125.43 is the next upside target. Closes below the 20-day moving average crossing at $90.35 would confirm that a short-term top has been posted. First resistance is the 38% retracement level of the February-April-decline crossing at $109.27. Second resistance is the 50%retracement level of the January-March-decline crossing at $125.43. First support is the 10-day moving average crossing at $98.83. Second support is the 20-day moving average crossing at $90.35.
July Henry natural gas was lower in late-overnight trading as it extends Wednesday's decline. The low-range overnight trade sets the stage for a steady to lower opening when the day session begins trading.Stochastics and the RSI have turned neutral to bearish signaling that sideways to lower prices are possible near-term. If July extends the decline off May's high, weekly support crossing at 1.595 is the next downside target. Closes above the 20-day moving average crossing at 2.050 would signal that a short-term low has been posted. First resistance is the 20-day moving average crossing at 2.050. Second resistance is the April 13th high crossing at 2.126. First support is last-Friday's low crossing at 1.822. Second support is weekly support crossing at 1.595.
CURRENCIEShttp://quotes.ino.com/ex changes/?c=currencies"
CURRENCIES:The June Dollar was lower in late-overnight trading while extending the April-May trading range. The low-range overnight trade sets the stage for a steady to lower opening when the day session begins trading. Stochastics and the RSI are neutral to bearish signaling that sideways to lower prices are possible near-term. If June extends this week's decline, May's low crossing at 98.76 is the next downside target. Closes above the 50-day moving average crossing at 100.03 would temper the near-term bearish outlook. First resistance is the April 6th high crossing at 101.03. Second resistance is March's high crossing at 103.96. First support is May's low crossing at 98.76. Second support is the 62% retracement level of March's rally crossing at 98.13.
The June Euro was higher in late-overnight trading as it extends the rally off May's low. The high-range overnight trade sets the stage for a steady to higher opening when the day session begins trading. Stochastics and the RSI are neutral to bullish signaling that sideways to higher prices are possible near-term. If June extends the rally off May's low, May's high crossing at 110.29 is the next upside target. Closes below the 20-day moving average crossing at 108.79 would temper the near-term friendly outlook. First resistance is May's high crossing at 110.29. Second resistance is the March 27th high crossing at 111.88. First support is April's low crossing at 107.39. Second support is March's low crossing at 106.71.
The June British Pound was steady to slightly lower overnight.The high-range overnight trade sets the stage for a steady to higher opening when the day session beings trading. Stochastics and the RSI have turned neutral to bullish signaling that sideways to higher prices are possible near-term. Closes above the 20-day moving average crossing at 1.2344 would confirm that a short-term low has been posted. If June renews the decline off April's high, the 50% retracement level of the March-April rally crossing at 1.2045 is the next downside target. First resistance is the 20-day moving average crossing at 1.2344. Second resistance is the April 14th high crossing at 1.2653. First support is the 50% retracement level of the March-April rally crossing at 1.2045. Second support is the 62% retracement level of the March-April rally crossing at 1.1900.
The June Swiss Franc was lower in late-overnight trading while extending the April-May trading range. The mid-range overnight trade sets the stage for a steady to lower opening when the day session begins trading. Stochastics and the RSI are neutral to bullish signaling that sideways to higher prices are possible near-term. If June extends this week's rally, May's high crossing at 1.0441 is the next upside target. If June renews the decline off April's high, April's low crossing at 1.0216 is the next downside target. First resistance is the April 14th high crossing at 1.0443. Second resistance is the March 30th high crossing at 1.0566. First support is April's low crossing at 1.0216. Second is March's low crossing at 1.0138.
The June Canadian Dollar was steady to slightly lower overnight while extending the March-May trading range. The high-range trade sets the stage for a steady to higher opening when the day session begins trading. Stochastics and the RSI are neutral to bullish signaling that sideways to higher prices are possible near-term. Closes above the April 13th high crossing at 72.25 would confirm an upside breakout of the aforementioned trading range. Closes below the April 21st low crossing at 70.12 would mark a downside breakout of the aforementioned trading range. First resistance is 50% retracement level of the January-March-decline crossing at 72.73. Second resistance is the 62% retracement level of the January-March-decline crossing at 73.80. First support is the April 21st low crossing at 70.12. Second support is the March 31st low crossing at 69.74. Third support is March's low crossing at 68.20.
The June Japanese Yen was slightly lower in late-overnight trading. The low-range overnight trade sets the stage for a steady to lower opening when the day session begins trading. Stochastics and the RSI are neutral to bearish signaling that sideways to lower prices are possible near-term. If June extends the decline off May's high, April's low crossing at 0.0916 is the next downside target. If June renews the rally off March's low, the September 2019 high crossing at 0.0951 is the next upside target. First resistance is the 25% retracement level of the 2016-2020-decline crossing at 0.0943. Second resistance is the September 2019 high crossing at 0.0951. First support is Tuesday's low crossing at 0.0925. Second support is April's low crossing at 0.0916. Third support is March's low crossing at 0.0900.
PRECIOUS METALS http://quotes.ino.com/ex changes/?c=metals"
PRECIOUS METALS:June gold was lower in late-overnight trading. The low-range overnight trade sets the stage for a steady to lower opening when the day session begins trading. Stochastics and the RSI are neutral to bearish signaling that sideways to lower prices are possible near-term. Closes below the 20-day moving average crossing at $1723.10 would temper the friendly outlook. If June extends the rally off April's low, the April 14th high crossing at $1788.80 is the next upside target. First resistance is Monday's high crossing at $1775.80. Second resistance is the April 14th high crossing at $1788.80. First support is the May 1st low crossing at $1676.00. Second support is the April 21st low crossing at $1666.20.
July silver was steady to slightly lower overnight. The low-range overnight trade sets the stage for a steady to lower opening when the day session begins trading later this morning. Stochastics and the RSI are overbought but remain neutral to bullish signaling that sideways to higher prices are possible near-term. If July extends the rally off March's low, February's high crossing at $19.075 is the next upside target. Closes below the 20-day moving average crossing at $15.980 would confirm that a short-term top has been posted. First resistance is the 87% retracement level of the February-March-decline crossing at $18.134. Second resistance is February's high crossing at $19.075. First support is the 10-day moving average crossing at $16.712. Second support is the 20-day moving average crossing at $15.980.
July copper was lower in late-overnight trading. The low-range overnight trade sets the stage for a steady to lower opening when the day session begins trading. Stochastics and the RSI are neutral to bullish signaling that sideways to higher prices are possible near-term. If July extends the rally off March's low, the 62% retracement level of the January-March-decline crossing at 2.5468 is the next upside target. Closes below the May 14th low crossing at 2.3140 would confirm that a short-term top has been posted. First resistance is the 50% retracement level of the January-March-decline crossing at 2.4380. Second resistance is the 62% retracement level of the January-March-decline crossing at 2.5468. First support is the May 14th low crossing at 2.3140. Second support is the April 21st low crossing at 2.2170. Third support is March's low crossing at 1.9795.
GRAINS http://quotes.ino.com/ex changes/?c=grains
July corn was steady to fractionally lower overnight. Thelow-range trade sets the stage for a steady to lower opening when the day sessions begins trading. Stochastics and the RSI are turning neutral to bearish signaling that sideways to lower prices are possible near-term. If July resumes the decline off December's high, psychological support crossing at $3.00 is the next downside target. If July extends the rally off April's low, the April 23rd high crossing at $3.31 is the next upside target. First resistance is the April 23rd high crossing at $3.31. Second resistance is the 50-day moving average crossing at $3.32. First support is April's low crossing at $3.09. Second support is psychological support crossing at $3.00.
July wheat was higher overnight as it extended the rally off Monday's low. The high-range trade sets the stage for a steady to higher opening when the day session begins trading. Stochastics and the RSI are neutral to bullish signaling that sideways to higher prices are possible near-term. Closes above the 20-day moving average crossing at $5.15 1/4 would confirm that a short-term low has been posted. If July extends the decline off March's high, last-September's low crossing at $4.81 is the next downside target. First resistance is the 20-day moving average crossing at $5.15 1/4. Second resistance is the 50-day moving average crossing at $5.30 3/4. First support is Monday's low crossing at $4.93 3/4. Second support is last-September's low crossing at $4.81.
July Kansas City Wheat closed up $0.11 3/4-cents at $4.53 1/4.
July Kansas City wheat closed higher on Wednesday as it consolidates some of the decline off April's high. The high-range close sets the stage for a steady to higher opening when Thursday night session begins trading. Stochastics and the RSI are oversold but remain neutral to bearish signaling that sideways to lower prices are possible near-term. If July extends the decline off April's high, March's low crossing at $4.27 1/4 is the next downside target. Closes above the 20-day moving average crossing at $4.71 3/4 are needed to confirm that a short-term low has been posted. First resistance is the 10-day moving average crossing at $4.60 1/4. Second resistance is the 20-day moving average crossing at $4.71 3/4. First support is today's low crossing at $4.38 3/4. Second support is March's low crossing at $4.27 1/4.
July Minneapolis wheat was higher in overnight trading. The high-range overnight trade sets the stage for a steady to higher opening when the day session begins trading. Stochastics and the RSI are turning neutral to bullish signaling that sideways to higher prices are possible near-term. Closes above the 50-day moving average crossing at $5.23 1/2 would open the door for additional short-term gains. If July renews this year's decline, psychological support crossing at $5.00 is the next downside target. First resistance is the 50-day moving average crossing at $5.23 1/2. Second resistance is April's high crossing at $5.48 1/4. First support is May's low crossing at $5.02. Second support is psychological support crossing at $5.00.
SOYBEAN COMPLEX? http://quotes.ino.com/ex?changes/?c=grains "
July soybeans were lower overnight as it extends the April-May trading range. The low-range trade sets the stage for a steady to lower opening when the day session begins trading. Stochastics and the RSI are turning neutral to bullish signaling that sideways to higher prices are possible near-term. If July extends the rally off April's low, the April 13th high crossing at $8.77 1/2 is the next upside target. If July resumes last-week's decline, April's low crossing at $8.18 1/2 is the next downside target. First resistance is the 50-day moving average crossing at $8.52 3/4. Second resistance is the April 13th high crossing at $8.77 1/2. First support is April's low crossing at $8.18 1/2. Second support is psychological support crossing at $8.00.
July soybean meal was lower overnight. The low-range trade sets the stage for a steady to lower opening when the day session begins trading. Stochastics and the RSI are oversold but remain neutral to bearish signaling that sideways to lower prices are possible near-term. If July extends this year's decline, monthly support crossing at $283.10 is the next downside target. Multiple closes above last-Monday's high crossing at $294.30 would confirm that a short-term low has been posted. First resistance is May's high crossing at $295.80. Second resistance is the 50-day moving average crossing at 298.00. First support is Tuesday's low crossing at $283.50. Second support is monthly support crossing at $283.10.
July soybean oil was slightly lower overnight while extending the March-May trading range. The mid-range trade sets the stage for a steady to slightly lower opening when the day session begins trading. Stochastics and the RSI are overbought but remain neutral to bullish signaling that sideways to higher prices are possible near-term. Closes above April's high crossing at 28.14 would mark an upside breakout of the aforementioned trading range. Closes below the 20-day moving average crossing at 26.38 would temper the near-term friendly outlook. First resistance is the 25% retracement level of the January-March-decline crossing at 27.84. Second resistance is the 38% retracement level of the January-March-decline crossing at 29.32. First support is May's low crossing at 25.70. Second support is April's low crossing at 25.09. Third support is March's low crossing at 25.02.
LIVESTOCKhttp://quotes.ino.com/exchanges/?c=livestock
June hogs closed up $0.23 at $56.88.
June hogs closed slightly higher on Wednesday. The high-range close sets the stage for a steady to higher opening when Thursday's night session begins trading. Stochastics and the RSI remain neutral to bearish signaling that sideways to lower prices are possible near-term. Closes below last-Thursday's low crossing at $56.17 would confirm that a short-term top has been posted. If June renews the rally, the 50% retracement level of the 2019-2020-decline crossing at $68.55 is the next upside target. First resistance is the 50% retracement level of the 2019-2020 decline crossing at $68.55. Second resistance is the 62% retracement level of the 2019-2020 decline crossing at $74.93. First support is last-Thursday's low crossing at $56.17. Second support is the April 29th low crossing at $54.78.
June cattle closed down $0.38 at $98.40.
June cattle closed slightly lower on Wednesday. The low-range close sets the stage for a steady to lower opening on Thursday. Stochastics and the RSI are overbought but remain neutral to bullish signaling that sideways to higher prices are possible near-term. If June extends the rally off April's low, the 62% retracement level of the January-April-decline crossing at $103.37 is the next upside target. Closes below the 20-day moving average crossing at $90.76 would confirm that a short-term top has been posted. First resistance is Monday's high crossing at $100.00. Second resistance is the 62% retracement level of the January-April-decline crossing at $103.37. First support is the 10-day moving average crossing at $95.94. Second support is the 20-day moving average crossing at $90.76.
August Feeder cattle closed down $2.93-cents at $129.00.
August Feeder cattle closed lower on Wednesday and below the 20-day moving average crossing at $130.64 confirming that a short-term top has been posted. Stochastics and the RSI are neutral to bearish signaling that a short-term top might be in or is near. The low-range close sets the stage for a steady to lower opening when Thursday's session begins trading. If August extends today's decline, the 50-day moving average crossing at 127.36 is the next downside target. If August renews the rally off April's low, the 75% retracement level of the January-April-decline crossing at $144.91 is the next upside target. First resistance is the March 25th high crossing at $139.00. Second resistance is the 75% retracement level of the January-April-decline crossing at $144.91. First support is the 50-day moving average crossing at $127.36. Second support is May's low crossing at $125.30.
FOOD & FIBERhttp://quotes.ino.com/ex changes/?c=food
July coffee closed lower on Wednesday. The low-range close sets the stage for a steady to lower opening on Thursday. Stochastics and the RSI are neutral to bearish signaling that sideways to lower prices are possible near-term. If July resumes the decline off March's high, March's low crossing at 10.31 is the next downside target. Closes above the 50-day moving average crossing at 11.33 would confirm that a low has been posted.
July cocoa closed lower on Wednesday. The low-range close sets the stage for a steady to lower opening on Thursday. Stochastics and the RSI are turning neutral to bullish signaling that sideways to higher prices are possible near-term. If July extends the rally off March's low, the 50% retracement level of the February-March decline crossing at 25.68 is the next upside target. Closes below the 50-day moving average crossing at 23.42 would confirm that a short-term top has been posted.
July sugar closed higher on Wednesday as it renewed the rally off April's low. The high-range close set the stage for a steady to higher opening on Thursday. Stochastics and the RSI are neutral to bullish signaling that sideways to higher prices are possible near-term. If July extends the rally off April's low, the 38% retracement level of the February-April-decline crossing at 11.45 is the next upside target. Closes below last-Tuesday's low crossing at 10.05 would signal that a short-term top has been posted.
July cotton closed lower on Wednesday as it consolidates some of the rally off April's low. The low-range close sets the stage for a steady to lower opening on Thursday. Stochastics and the RSI are overbought but remain neutral to bullish signaling that sideways to higher prices are possible near-term. If July extends the rally off April's low, the 50% retracement level of the January-April-decline crossing at 61.06. Closes below the 50-day moving average crossing at 55.06 would confirm that a short-term top has been posted.
Thanks tallpine:
NG weather in week 2 features a cool down(after some heat) in the East, that wasn't there earlier this week.
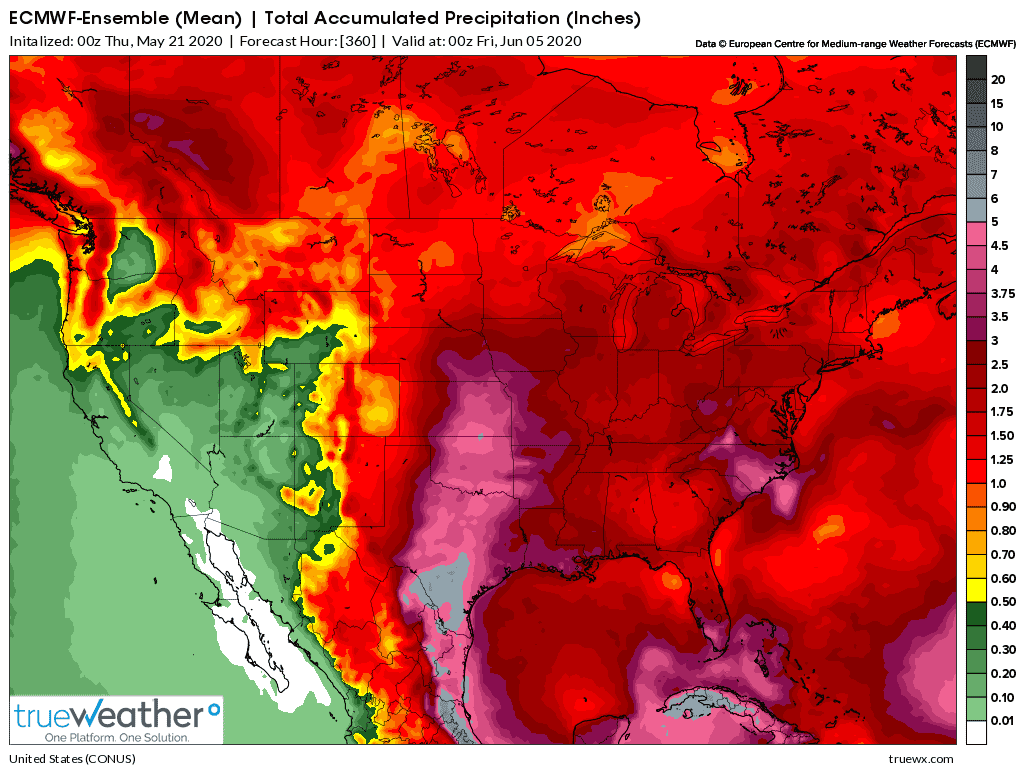
Grains weather looks pretty bearish in the US. Heavy rains from the S.Plains to SW cornbelt. Heating up the next week, then cooling off a bit.
Apparently there is an issue with dryness in Europe around the Black Sea area which is being given for the wheat strength.
2 week rains from the last Euopean model below.