Hello June 10th!
7am: The pattern looks Warmer now late week 2 and has reversed ng higher early this morning.
June 6th update: My Summer Forecast/La Nina this Summer!
Started by metmike - May 23, 2020, 11:33 p.m.
https://www.marketforum.com/forum/topic/52701/
Latest COVID-19 numbers.
https://www.marketforum.com/forum/topic/52243/
Scroll down and enjoy the latest comprehensive weather to the max...... occurring because of the natural physical laws in our atmosphere as life on this greening planet continues to enjoy the best weather/climate in at least 1,000 years(the last time that it was this warm) with the added bonus of extra beneficial CO2.
Reasons to keep being thankful here in 2020!
https://www.marketforum.com/forum/topic/45623/
Go to the link below, then hit the location/county on the map for details.
https://www.spc.noaa.gov/ Go to "hazards"
Here are the latest hazards across the country.
 |
Purple/Pink/blue on land is cold/Winter weather. Brown is wind, Green is flooding. Gray is fog. Reddish is a red flag advisory.
Go to the link below, then hit the location/county on the map for details.
https://www.spc.noaa.gov/ Go to "hazards"
https://www.mesonet.org/index.php/weather/map/us_air_temperature/air_temperature

https://www.mesonet.org/index.php/weather/map/wind_chill_heat_index1/air_temperature

Current Weather Map
| NCEP Days 0-7 Forecast Loop | NCEP Short-Range Model Discussion | NCEP Day 3-7 Discussion |


Current Jet Stream

| Low Temperatures Tomorrow Morning |

Highs today and tomorrow.


Only very slightly bullish. But not enough to render a bullish move in the markets.
Highs for days 3-7:
Cool start to this period Great Lakes/Northeast, with heat in the S.Plains........that spreads slowly northeast next week!.


Temperatures compared to Average for days 3-7
Heat in the Southern Plains! Some spreads northeast next week.
https://www.wpc.ncep.noaa.gov/medr/medr_mean.shtml


Surface Weather features day 3-7:
Cool Canadian High early from Midwest and points southeast.
HEAT on the backside in the S.Plains will spread northeast next week.

Liquid equivalent precip forecasts for the next 7 days are below.
Last of the rains exiting today.........dry for over a week in most places after this.
Day 1 below:
http://www.wpc.ncep.noaa.gov/qpf/fill_94qwbg.gif?1526306199054

Day 2 below:
http://www.wpc.ncep.noaa.gov/qpf/fill_98qwbg.gif?1528293750112

Day 3 below
http://www.wpc.ncep.noaa.gov/qpf/fill_99qwbg.gif?1528293842764

Days 4-5 below:
http://www.wpc.ncep.noaa.gov/qpf/95ep48iwbg_fill.gif?1526306162

Days 6-7 below:
http://www.wpc.ncep.noaa.gov/qpf/97ep48iwbg_fill.gif?1526306162

7 Day Total precipitation below:
https://www.wpc.ncep.noaa.gov/qpf/p168i.gif?1566925971

Excessive rain potential.
Mesoscale Precipitation Discussions
Current Day 1 Forecast Valid 16Z 08/30/19 - 12Z 08/31/19 |
Day 1 Threat Area in Text Format
| Day 2 and Day 3 Forecasts |
Current Day 2 Forecast Valid 12Z 08/31/19 - 12Z 09/01/19 |
Day 2 Threat Area in Text Format
Current Day 3 Forecast |
Severe Storm Risk the next 8 days:
Last of the storm risk today...........for a very long time in most places.
Current Day 1 Outlook | |
Current Day 2 Outlook | |
Current Day 3 Outlook | F |
Current Day 4-8 Outlook |
Current Dew Points

Latest radar loop
http://www.nws.noaa.gov/radar_tab.php


| (3400x1700 pixels - 2.2mb) Go to: Most Recent Image |

Go to: Most Recent Image
You can go to this link to see precipitation totals from recent time periods:
https://water.weather.gov/precip/
Go to precipitation, then scroll down to pick a time frame. Hit states to get the borders to see locations better. Under products, you can hit "observed" or "Percent of Normal"
Soilmoisture anomaly:
These maps sometimes take a day to catch up to incorporate the latest data(the bottom map is only updated once a week).
https://www.cpc.ncep.noaa.gov/products/Soilmst_Monitoring/US/Soilmst/Soilmst.shtml#
![]()


Drought Monitor maps:
Latest: The first map below is the latest. The 2nd one is from last week.
April 23: LOOKY_LOOKY! For the first time this year, its gotten dry enough for a few (small)areas in the Upper Midwest/Western Cornbelt to report slight drought.
April 30: Drought increased a bit......Plains and U.Midwest.
May: 7: Drought increased a bit from KS westward.
May 14: Drought increased a bit again, now, parts of Iowa have slight drought(this dry weather is why planting is ahead of schedule). Rains are coming to the dry spots in the forecast though.......bearish.
May 21: A bit more drought in ND.
May 28: Not much change
June 4: Drought increases a tad in the N.Plains and Upper Midwest.
The maps below are updated on Thursdays.
https://droughtmonitor.unl.edu/


The top map is the Canadian ensemble average, the maps below are the individual members that make up the average at the end of week 2.
+++++++++++++++++++++++++++++++++++++++++
Each member is like the parent, Canadian model operational model.......with a slight tweek/variation in parameters. Since we know the equations to represent the physics of the atmosphere in the models are not perfect, its useful to vary some of the equations that are uncertain(can make a difference) to see if it effects the outcome and how.
The average of all these variations(ensembles) often yields a better tool for forecasting. It's always more consistent. The individual operational model, like each individual ensemble member can vary greatly from run to run.........and represent an extreme end of the spectrum at times. The ensemble average of all the members, because it averages the extremes.............from opposite ends of the spectrum.........changes much less from run to run.
End of week 2....................0z Canadian ensembles:
Last Tuesday: Much wetter than last week. Will there be a heat ridge somewhere? Regardless, MUCH less of the country will be hot vs last weeks maps.
Thursday: Non threatening, mostly zonal flow with no extreme temps.........on the dry side for the Plains.
Saturday: Big disparity in solutions, significant minority have a heat ridge.
Monday: Huge difference in individual solutions. Strong Pacific jet stream across the northern tier on most solutions but will it amplify a downstream heat ridge and where?
Wednesday: The average is misleading and looks sort of zonal as the majority DON'T look like the average. A slight majority of solutions have a heat ridge building in the East. This would turn bullish for ng..........if it happened. Several members have something different. The Canadian model is more bullish on this idea than other models.
372h GZ 500 forecast valid on Jun 26, 2020 00 UTC


Forecasts for the control (GEM 0) and the 20 ensemble members (global model not available)
Individual GFS ensemble solutions for the latest 0z run:
Sunday: Half the solutions have an impressive heat ridge
Monday: Heat ridge with certainty early week 2 around the Plains. Where does it go, what strength can it maintain(or is it transient and goes away) at the end of week 2?

GFS Ensemble mean(average of all the individual solutions above). The first map is a mid/upper level map. The 2nd one is a temperatures map at around 1 mile above the surface. These are anomalies(difference compared to average).
NCEP Ensemble t = 360 hour forecast
Last Thursday: Positive anomalies shift to the high latitudes.
Saturday: Cool at 1 week. Warming late in week 2. Anomalies favor Gulf moisture being cut off/suppressed far south and dry weather.
Monday: Positive anomaly in week 1 in Canada brings cool dry air south of the border along with slight negative in the Southeast which also suppresses moisture from the Gulf of Mexico. Positive anomalies retreat farther north in week 2, leading to some widespread warming. Uncertain how much heat this will result in and where.
Wednesday: Not as hot in the E/SE as the Canadian model.
1 week out below
2 weeks out below

Latest, updated graph/forecast for AO and NAO and PNA here, including an explanation of how to interpret them...............mainly where they stand at the end of 2 weeks.
https://www.marketforum.com/forum/t
Previous analysis, with the latest day at the bottom for late week 2 period.
Discussions, starting with the oldest below.
Saturday: Slight negative AO/NAO cool from mid week 1 into week 2. PNA positive......strong dry influence.
Monday: Near 0 for the AO/NAO. PNA is positive and likely connected with a dry pattern.
Wednesday: Near 0 for the AO/NAO. PNA is positive which is a dry signal.
National Weather Service 6-10 day, 8-14 day outlooks.
Updated daily just after 2pm Central.
Temperature Probability
 Precipitation Probability

| the 8-14 day outlooks ArchivesAnalogsLines-Only FormatGIS Data | |
Temperature Probability | |
 | |
Long range outlook:
NEW: My Summer Forecast/La Nina this Summer!
Started by metmike - May 23, 2020, 11:33 p.m.
https://www.marketforum.com/forum/topic/52701/
The NWS made HUGE changes to the June forecast. REALLY HUGE!
Previously, the Cornbelt had average temps(equal chances of above and below) and above average rains everywhere.
The new forecast has a high chance of above temps and a large pocket of drier than average, surrounded by average. This is HUGE!
This now agrees with my forecast from over a week ago!!!
| Revised OFFICIAL 30-Day Forecasts | |||
| Issued: May 31, 2020 | |||
  | |||
By wglassfo - June 2, 2020, 10:46 a.m.
Looks like some scattered showers , bearish
However, Hot Dry winds with wind is going to dry out quickly
If your La Nina holds true which looks very likely, then conditions will tell the story on dry. Long time before crop is in the bin.
This heat has got crops growing and looking much better
But that can change
Usually in The Great Lakes we might suffer from summer dry but never a crop failure. Some times like this yr looks so far we may miss rain at pollination. That can be as much as 40 bu, but mostly 20-30 less but then some times we get an evening pop up shower, just in the nick of time
So far crops look decent locally, but windy for spraying
No telling where the bulk of crop conditions will be in Aug.
Part of Ill. is struggling. Some other places are already dry
Looks like SA must have finally run out of export beans. SA just finishing up on pre-sold beans for shipment now
China would not be buying beans from us unless everybody else is empty. China needs beans every week 1.5 billion need a lot of food, and much of china land mass will not grow food
+++++++++++++++++++++++++++++++++++++++++++
By metmike - June 2, 2020, 2:11 p.m.
Wayne,
It's interesting because the weather has turned much more bearish but the beans are way up because of exports to China and even the corn is being pulled a bit higher.
Much more rain on the way and much less heat in week 2 in fact, below normal temps in the Midwest in week 2!! Close to perfect
+++++++++++++++++++++++++++++++++++++
By wglassfo - June 2, 2020, 2:46 p.m.
Am I reading weather as
bearish short term
Bullish long term - La Nina
Of coarse china changed things a bit
++++++++++++++++++
Yes Wayne, you are reading that right...........though the longer range forecast is low confidence because of the distant time frame.
++++++++++++++++++++++++++++++++++++++
By MarkB - June 10, 2020, 2:45 a.m.
Only very slightly bullish. But not enough to render a bullish move in the markets.
++++++++++++++++++++++++++++
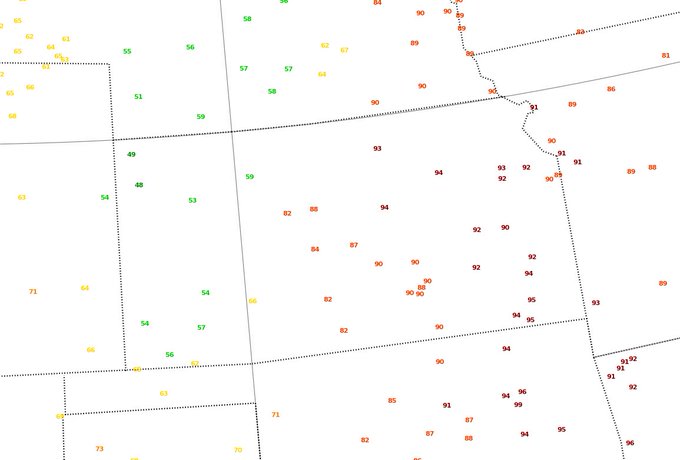
You were just a few hours early on that Mark!
"Only" a 47 degree difference in afternoon highs today across Kansas...as well as winds gusting to over 60 miles per hour.


