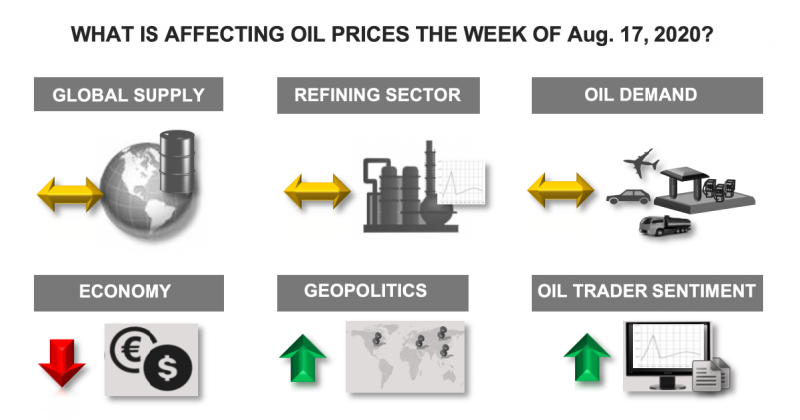
The tip of the iceberg—what comes next for global refining capacity?
Jaime Brito, Stratas Advisors
https://www.investing.com/economic-calendar/eia-crude-oil-inventories-75
| Release Date | Time | Actual | Forecast | Previous | |
|---|---|---|---|---|---|
| Aug 19, 2020 | 10:30 | -4.512M | |||
| Aug 12, 2020 | 10:30 | -4.512M | -2.875M | -7.373M | |
| Aug 05, 2020 | 10:30 | -7.373M | -3.001M | -10.612M | |
| Jul 29, 2020 | 10:30 | -10.612M | 0.357M | 4.892M | |
| Jul 22, 2020 | 10:30 | 4.892M | -2.088M | -7.493M | |
| Jul 15, 2020 | 10:30 | -7.493M | -2.098M | 5.654M | |
| Jul 08, 2020 | 10:30 | 5.654M | -3.114M | -7.195M | |
| Jul 01, 2020 | 10:30 | -7.195M | -0.710M | 1.442M | |
| Jun 24, 2020 | 10:30 | 1.442M | 0.299M | 1.215M | |
| Jun 17, 2020 | 10:30 | 1.215M | -0.152M | 5.720M | |
| Jun 10, 2020 | 10:30 | 5.720M | -1.738M | -2.077M | |
| Jun 03, 2020 | 10:30 | -2.077M | 3.038M | 7.928M |
Weekly US ending stocks of crude oil.
https://www.eia.gov/dnav/pet/hist/LeafHandler.ashx?n=PET&s=WCRSTUS1&f=W
Weekly ending stocks for unleaded gasoline.
https://www.eia.gov/dnav/pet/hist/LeafHandler.ashx?n=PET&s=WGTSTUS1&f=W
Weekly US ending stocks for distillate fuel oil(heating oil-especially used in the Northeast).
https://www.eia.gov/dnav/pet/hist/LeafHandler.ashx?n=PET&s=WDISTUS1&f=W
Crude 3 month chart
| |
Crude 1 year chart below
| |
Crude 5 year chart below
| |
Crude 10 year chart below
| |
Unleaded Gasoline Price Charts:
| |
| |
5 year........are we headed back to the highs?
| |
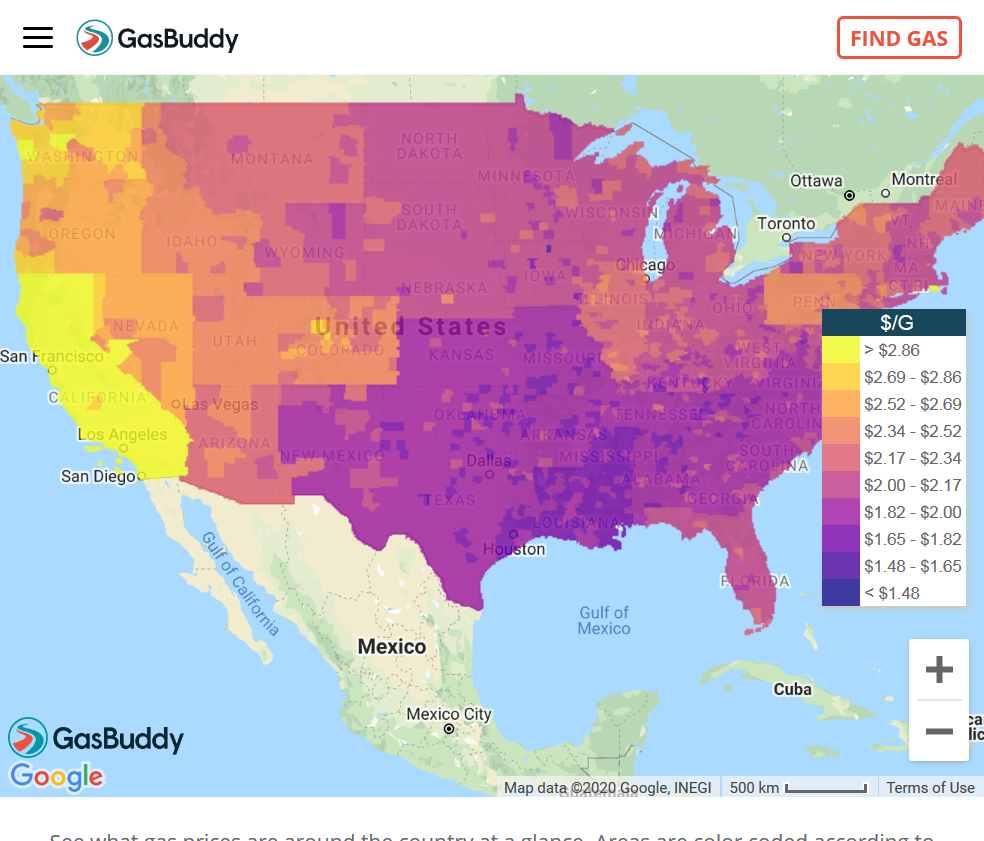
Current gas prices:
https://www.gasbuddy.com/GasPriceMap?z=4&lng=-96.591588&lat=38.822395
https://www.quora.com/Why-are-west-coast-gasoline-prices-higher