Pro Farmer Crop Tour August 17, 2020
25 responses | 1 like
Started by metmike - Aug. 17, 2020, 8:09 p.m.

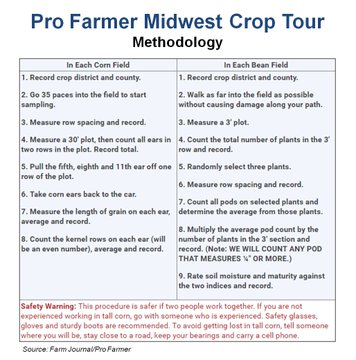
The 2020 Pro Farmer Crop Tour is underway! Scouts are stopping every 15-20 miles along their routes and following the below procedures for #corn and #soybeans. A rough corn yield calculation is also being made at every stop. #pftour20

ImageImage

++++++++++++++++++++++++++++++++++++++

US crop tour to give insight into yield and storm damage


US crop tour to give insight into yield and storm damage 


https://www.agriland.ie/farming-news/us-crop-tour-to-give-insight-into-yield-and-storm-damage/

Comments
By metmike - Aug. 17, 2020, 8:12 p.m.
Like Reply

This is my route in South Dakota this morning. I'll be posting some pictures and results along the way. 

@kannbwx

·

Have to drive almost 50 miles west on I-90 before we start to scout, and the stuff we can see from the highway looks about as good as I have ever seen in South Dakota (this is my 7th time on the western tour).


Image

By metmike - Aug. 17, 2020, 8:14 p.m.
Like Reply

#pftour20 does not compute yield estimates for #soybeans, rather the number of pods in a 3 by 3 foot plot. Average of 4 stops in South Dakota district 6 is 1320 pods. 17-19 avg was 937 2018 was 1081


Image

By metmike - Aug. 17, 2020, 8:15 p.m.
Like Reply


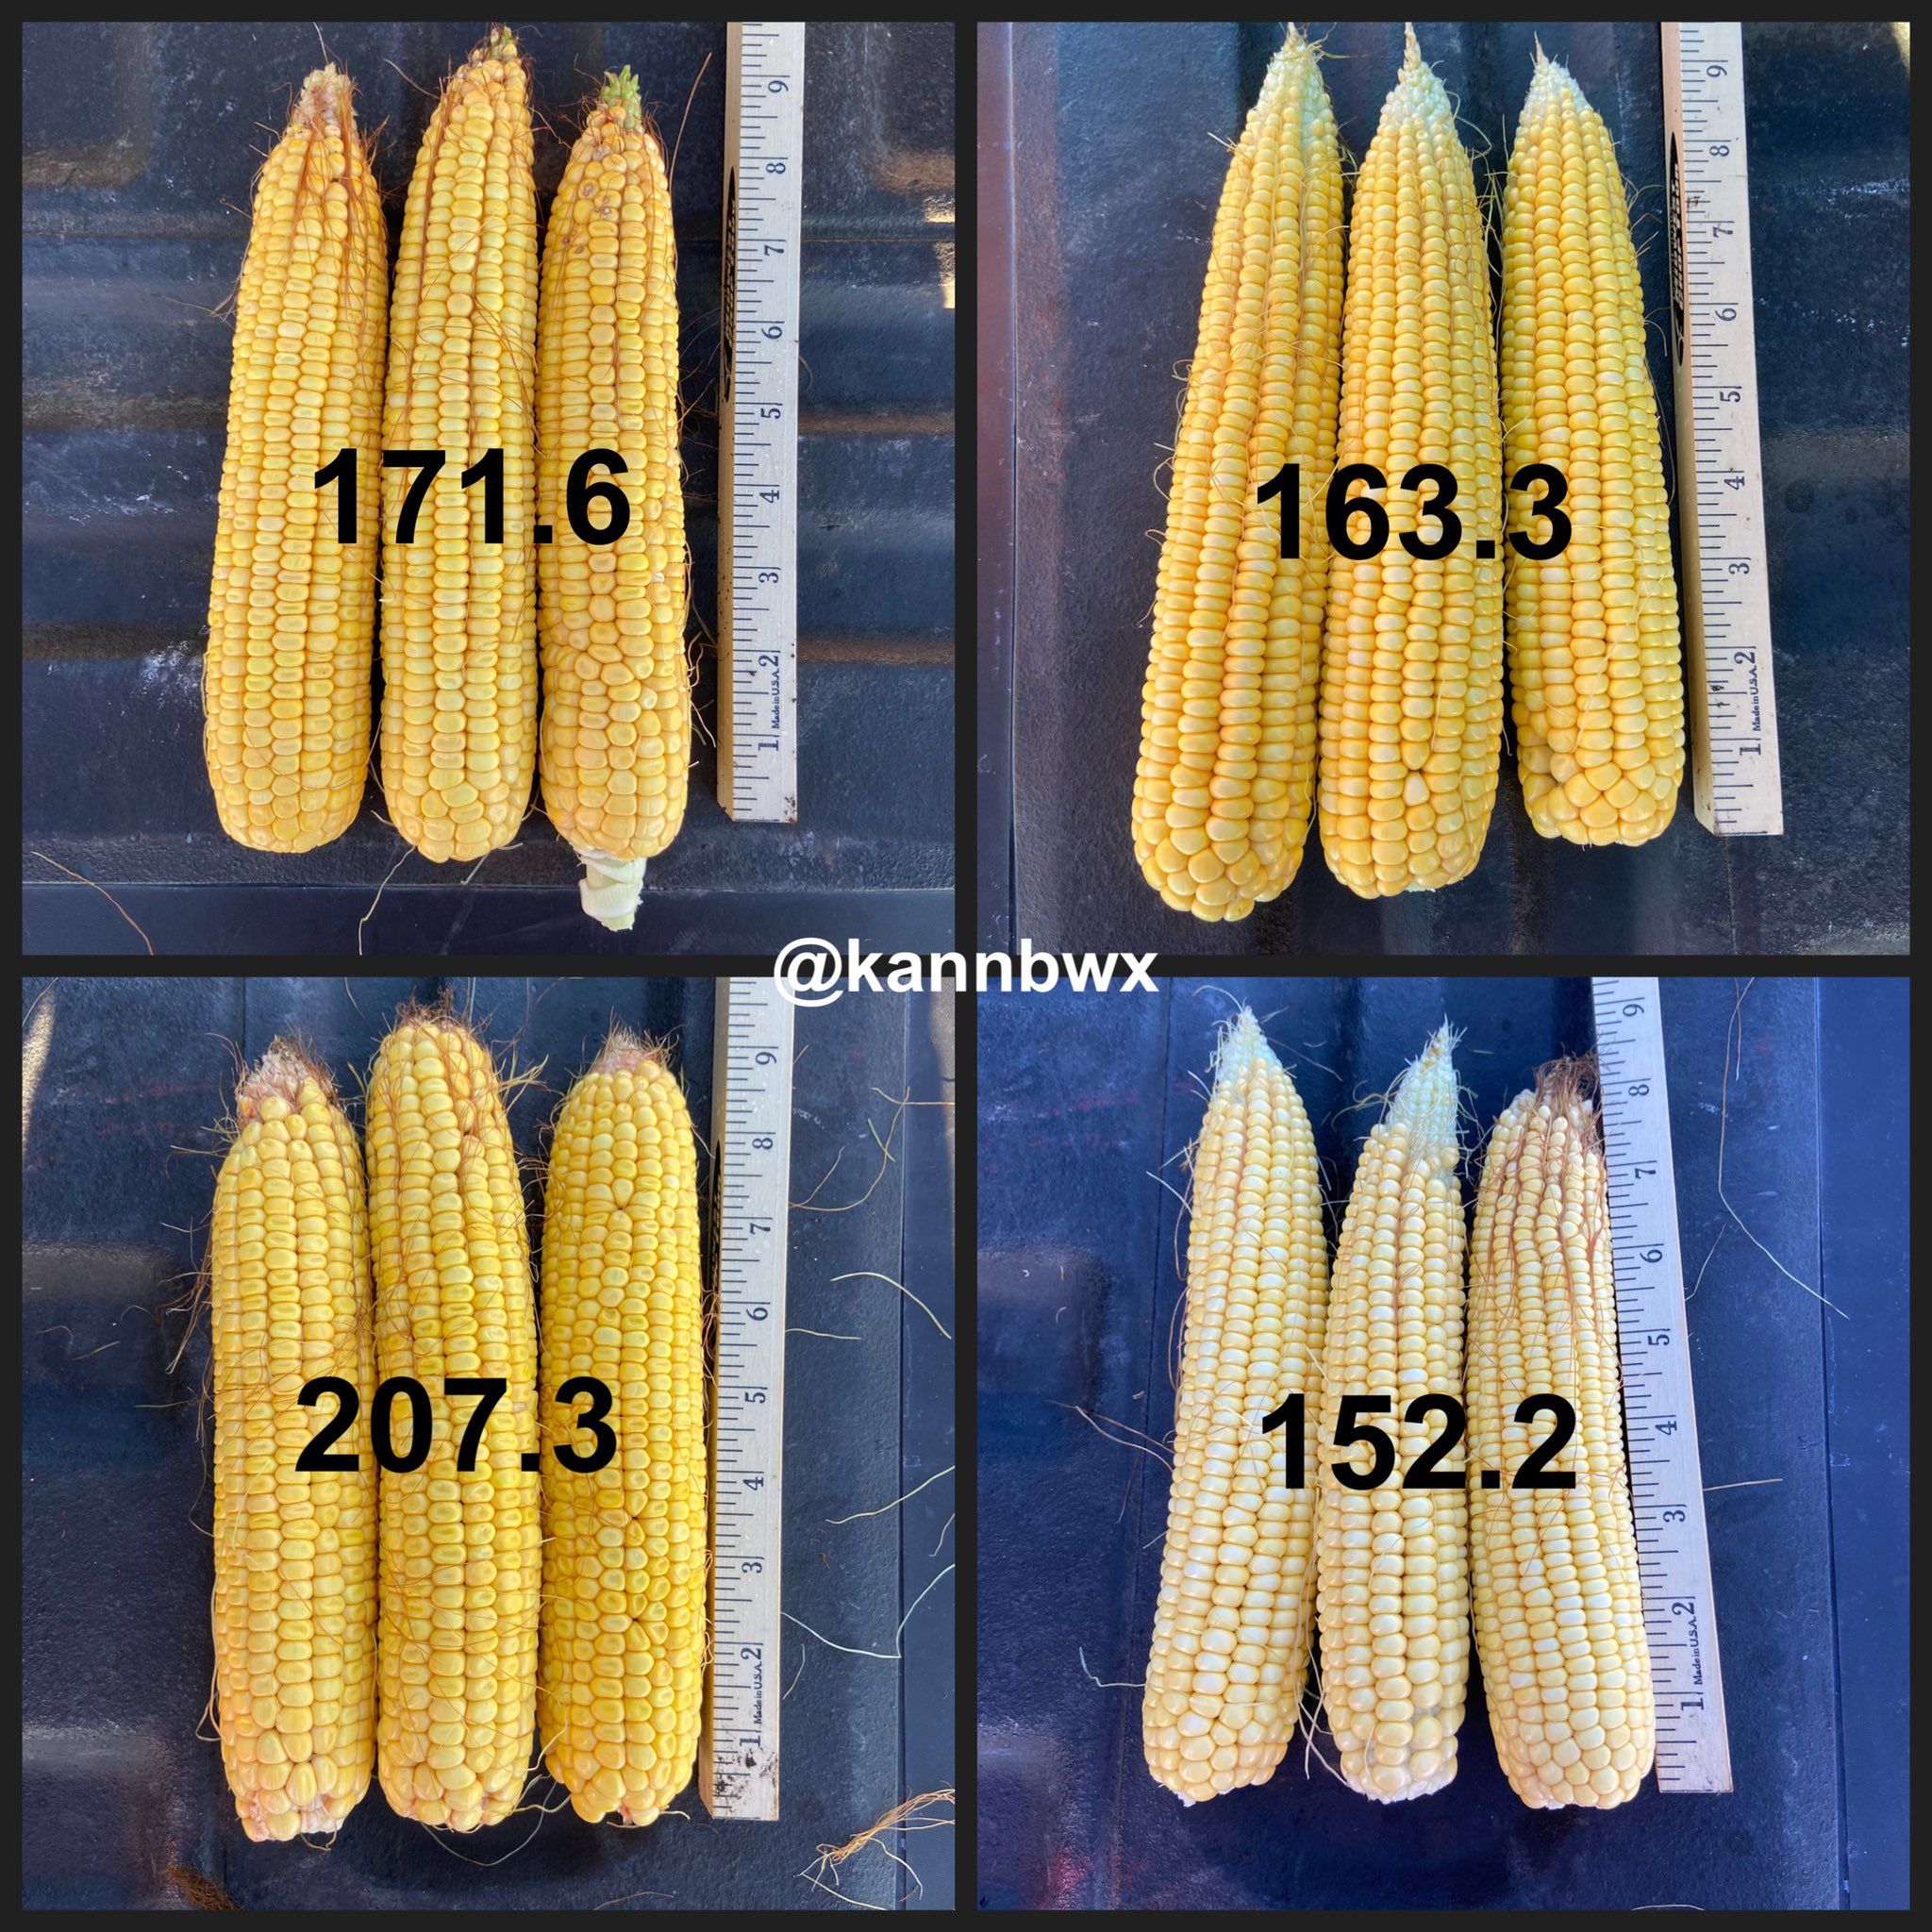
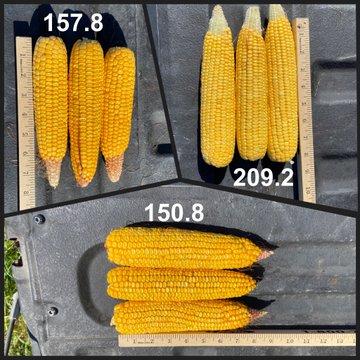
Four #corn stops in district 6 of South Dakota. Average (rough) yield 173.6 bu/acre. Past tour numbers in this district: 17-19 avg: 164.4 2018: 178.7

Image

By metmike - Aug. 17, 2020, 8:19 p.m.
Like Reply

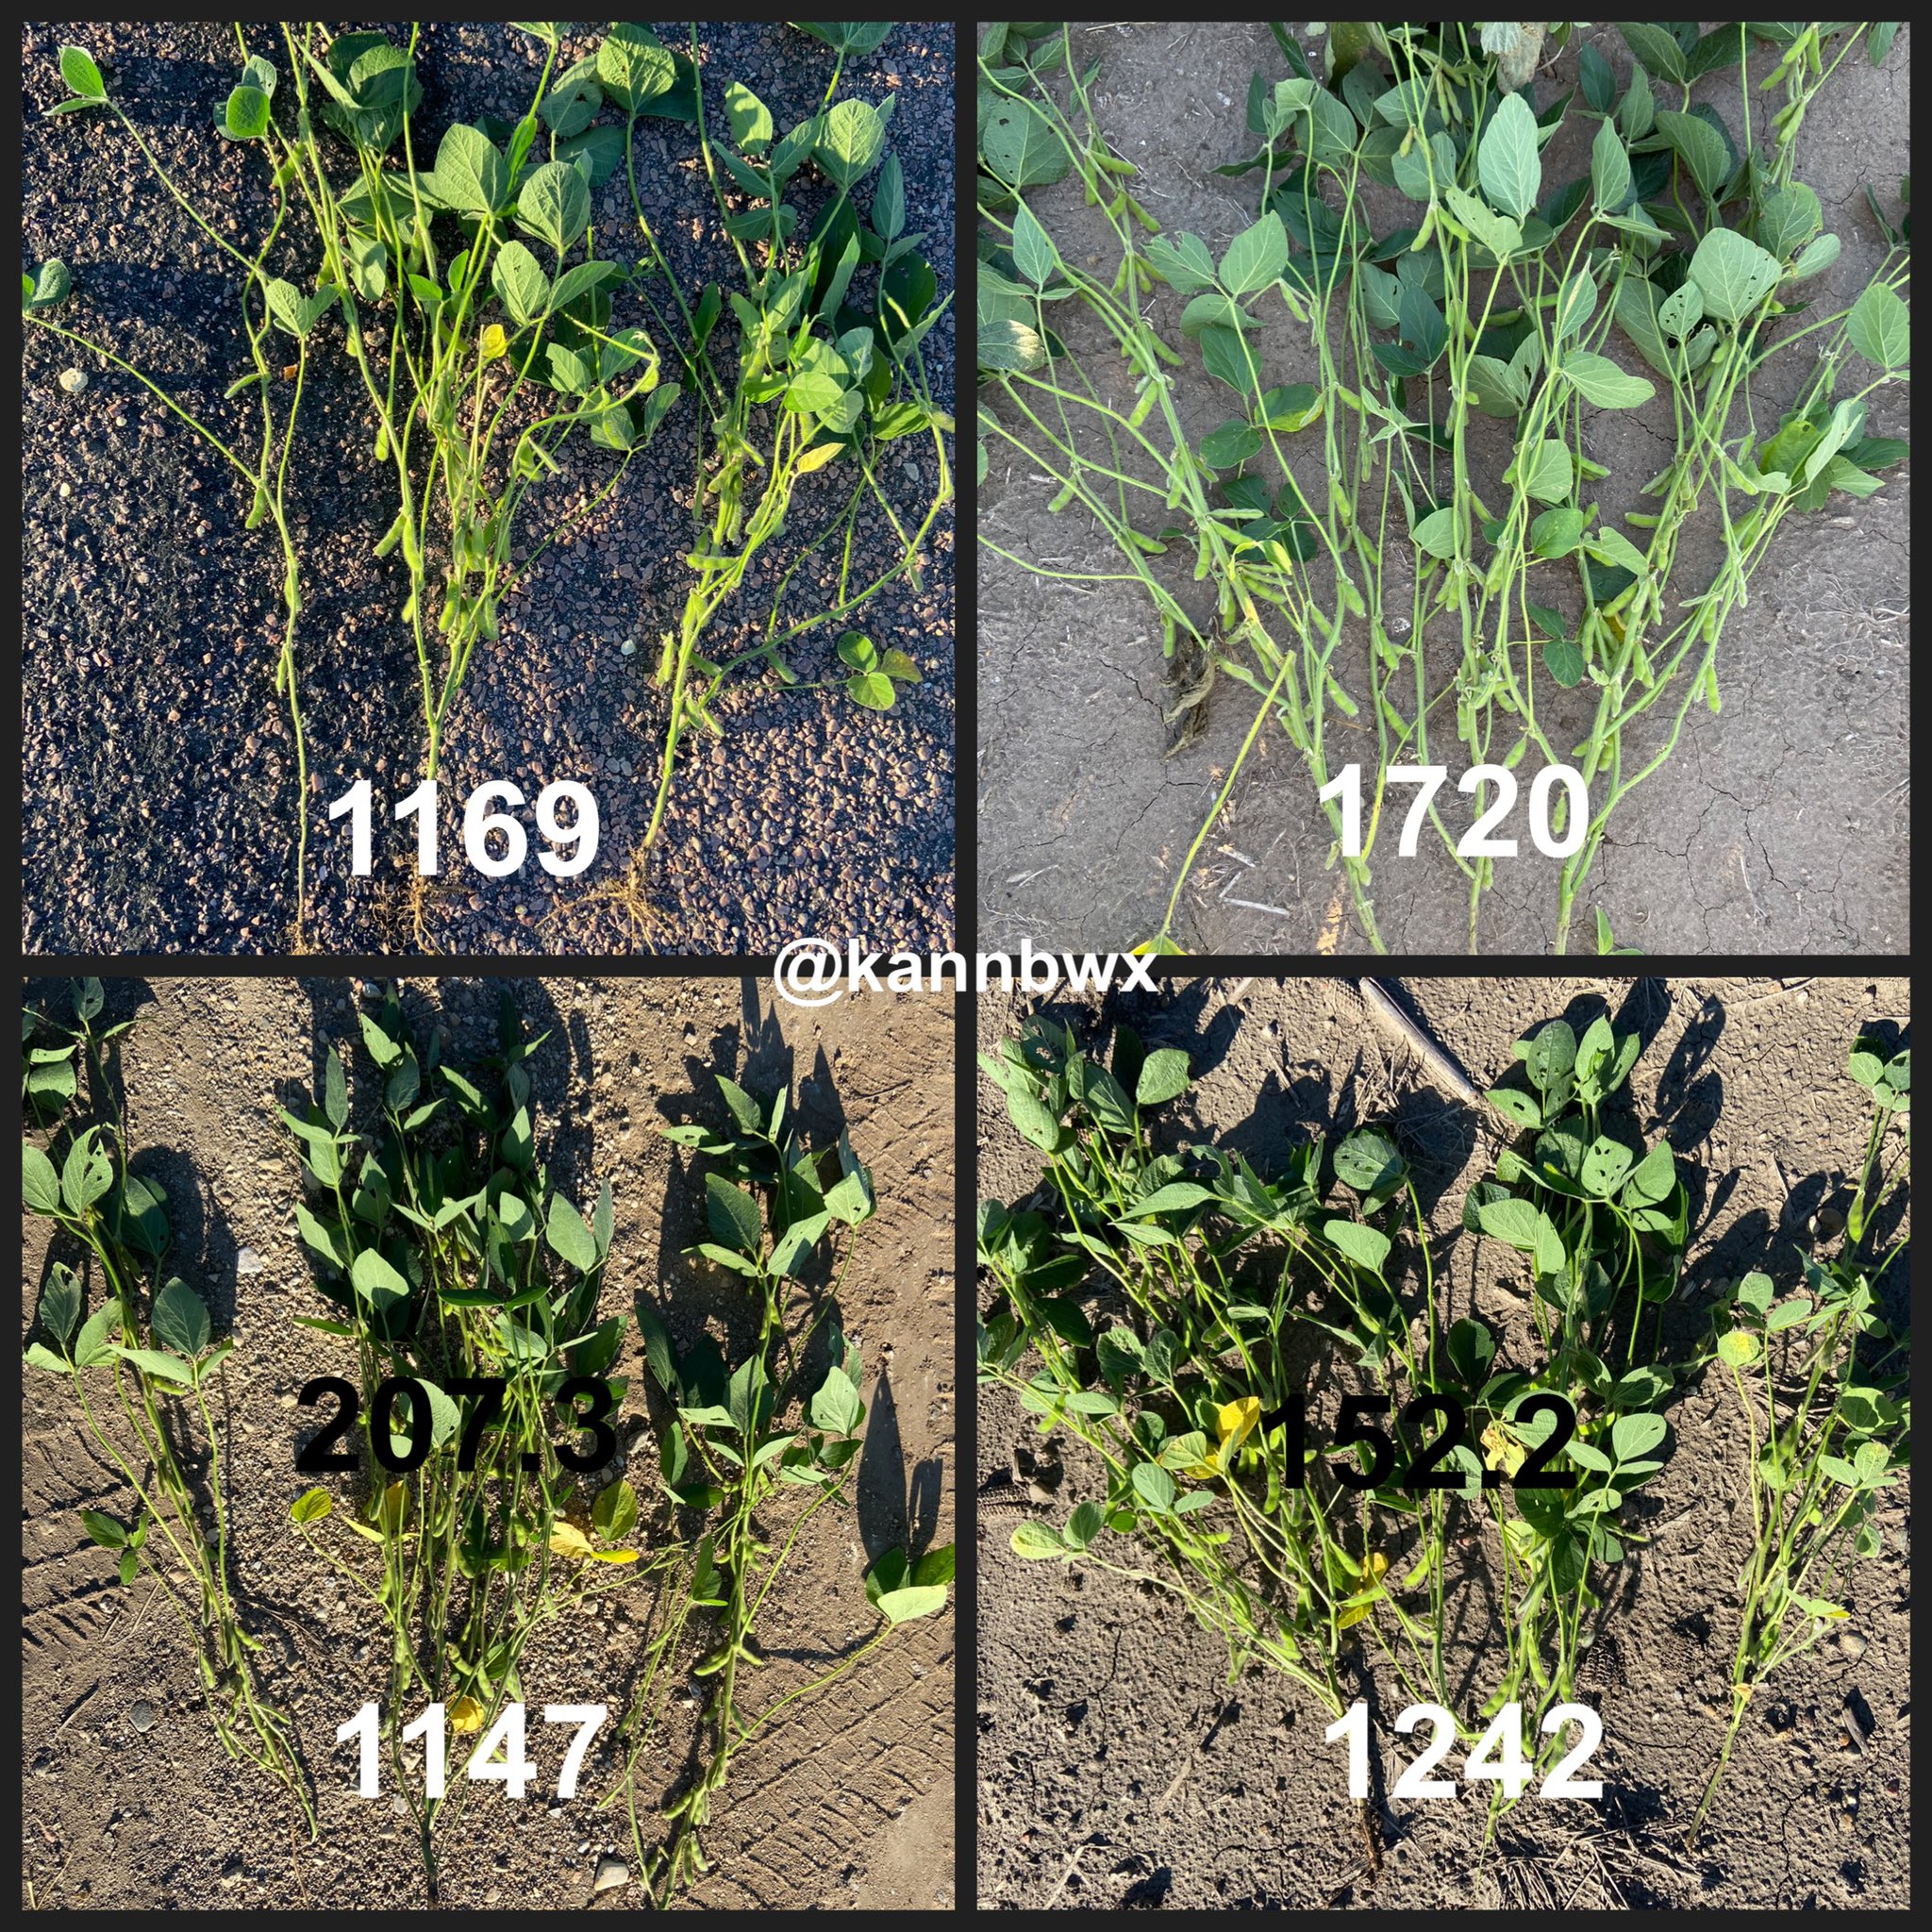
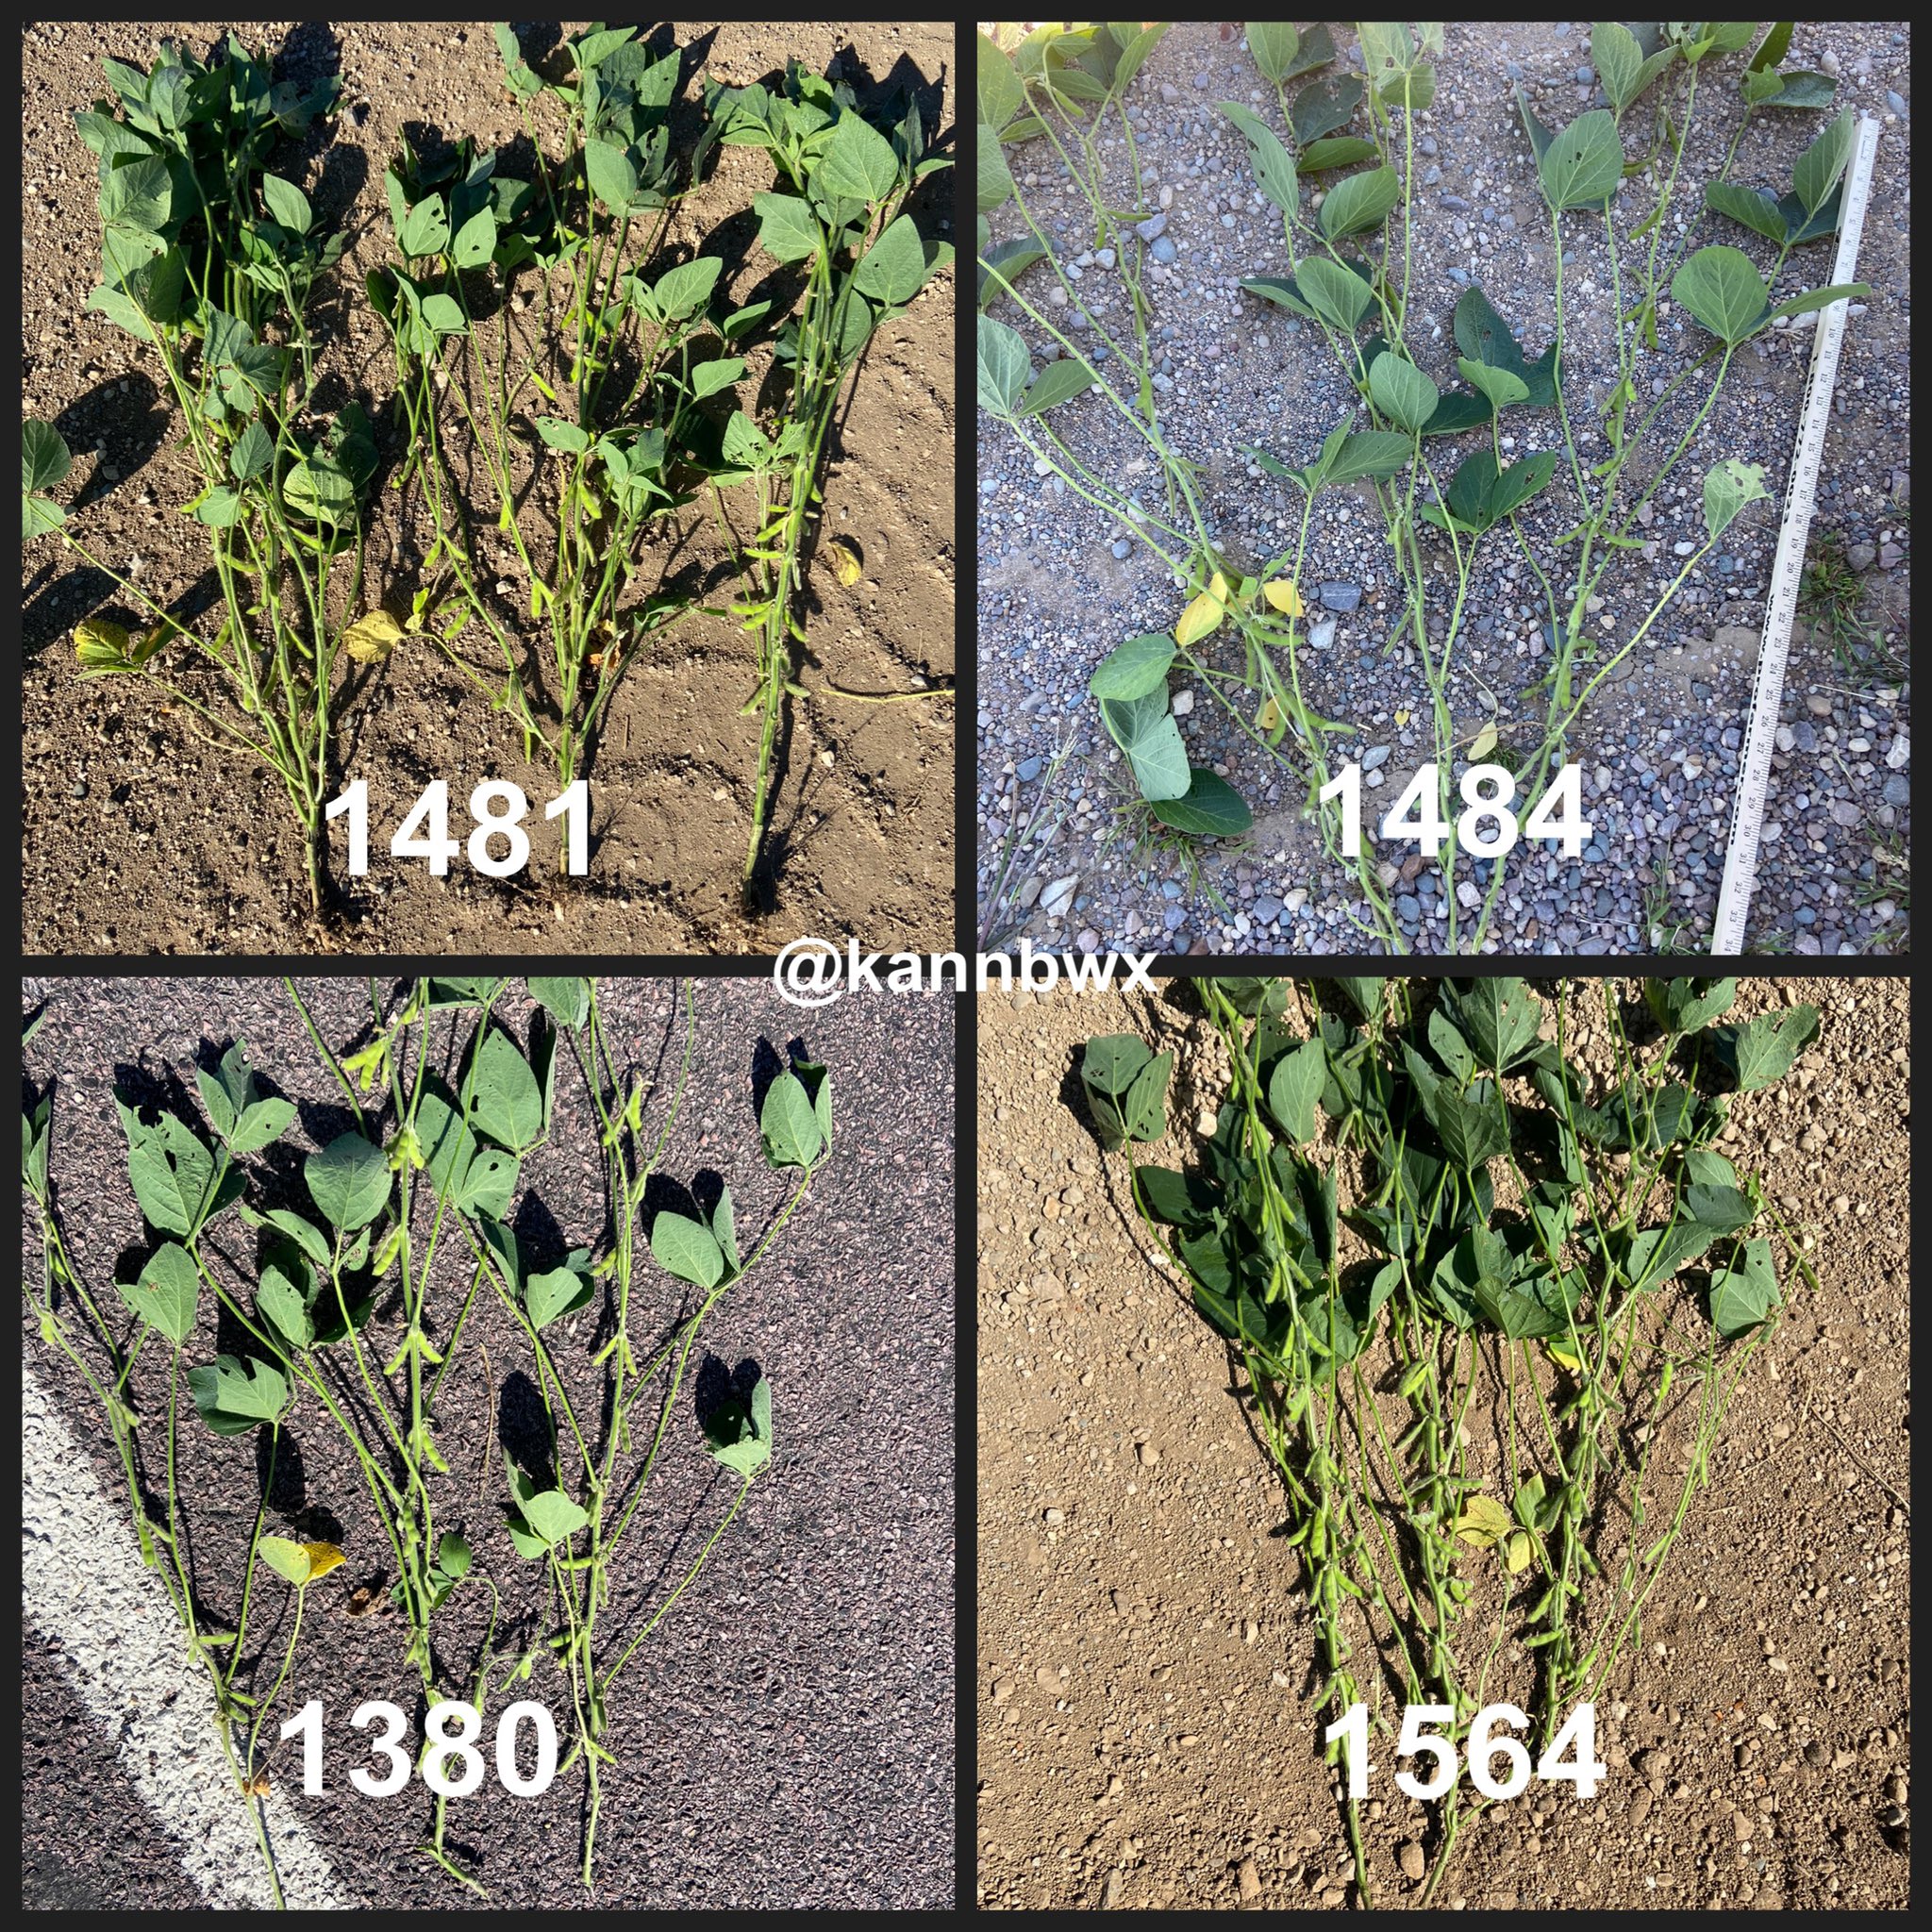
Sanborn, Davison, and Hutchinson counties in southeast South Dakota. #Soybeans are huge. #Corn really solid too though one pretty immature field. Area could use a rain but they aren't hurting either. #pftour20 Reminder, bean numbers is # of pods in 3 by 3 feet (0.84 sq meter)


ImageImage


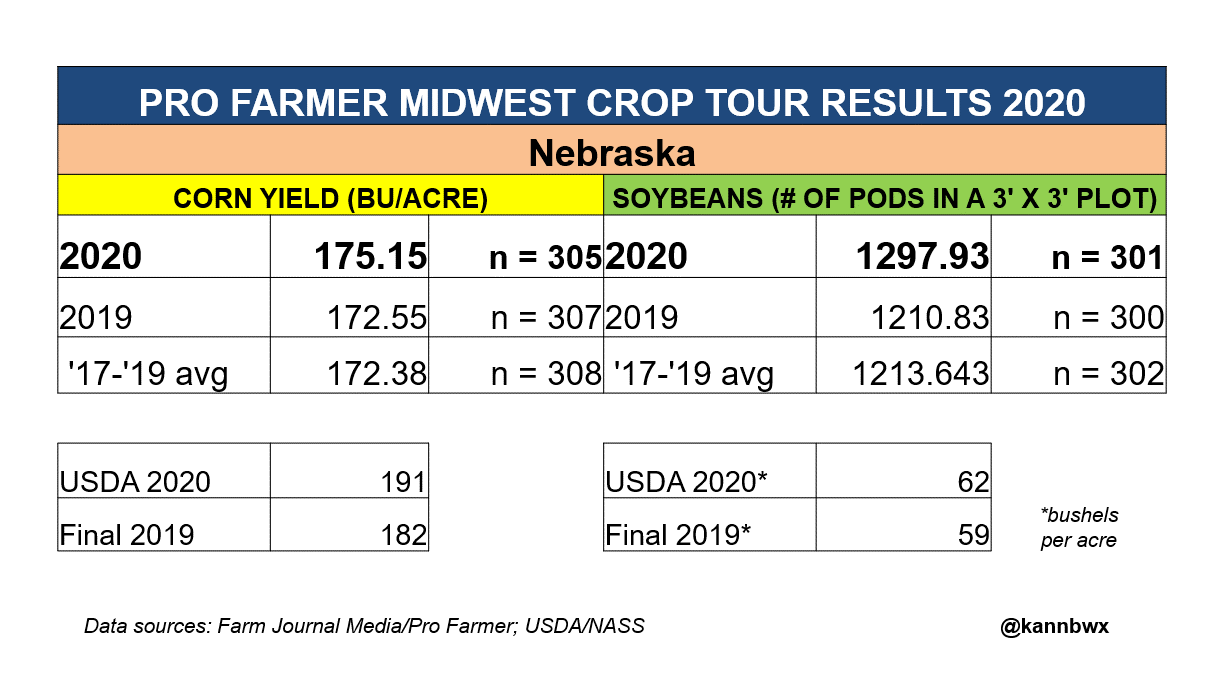
Keep in mind when looking at that #corn yield that #pftour20 samples the higher-yielding southeast part of the state, so comparing these numbers directly with USDA can be misleading. There's a certain average adjustment that can be made with tour data (will post it later).

By metmike - Aug. 17, 2020, 8:21 p.m.
Like Reply


@kannbwx


Well South Dakota, looks like you have a beautiful crop coming. Definitely the most consistent I have ever seen it. Average #corn yield in 12 stops: 189.5 bu/acre Average pods for #soybeans in a 3x3 plot: 1373 #pftour20

ImageImage


By 7475 - Aug. 18, 2020, 6:41 a.m.
Like Reply

Im reading this as you are a member of this official team.

 I had no idea,thought this was a government sponsored event,and maybe it is.

Tell us more.

How do you get on the team,sponsorship,qualifications,quality of the reports,etc.

Are you allowed to trade this info or would that be considered insider info.

Interesting mm!

John

By metmike - Aug. 18, 2020, 11:15 a.m.
Like Reply

Hi John,

I'm just passing along tweets from this person that provides massive wonderful information (especially graphically/pictorially) about grains which I have copied here for over a year.


By metmike - Aug. 18, 2020, 11:18 a.m.
Like Reply

Tweet   @kannbwx

South Dakota #corn yields averaged 179.24 bu/acre on #pftour20, edging 2018’s tour high of 178. Soybean pod counts of 1250.86 appear to blow away all past tour results. USDA’s record yield forecasts – especially on #soybeans - are looking good.Image

By metmike - Aug. 18, 2020, 11:20 a.m.
Like Reply

@kannbwx


Ohio #corn yields averaged 167.69 bu/acre on #pftour20, up almost 9% YOY and up nearly 1% on the three-year avg. The tour found 179.6 in 2018, Ohio’s record year. Soybean pod counts of 1155.68 are up 11% on the 3yr avg.

Image

By metmike - Aug. 18, 2020, 11:23 a.m.
Like Reply

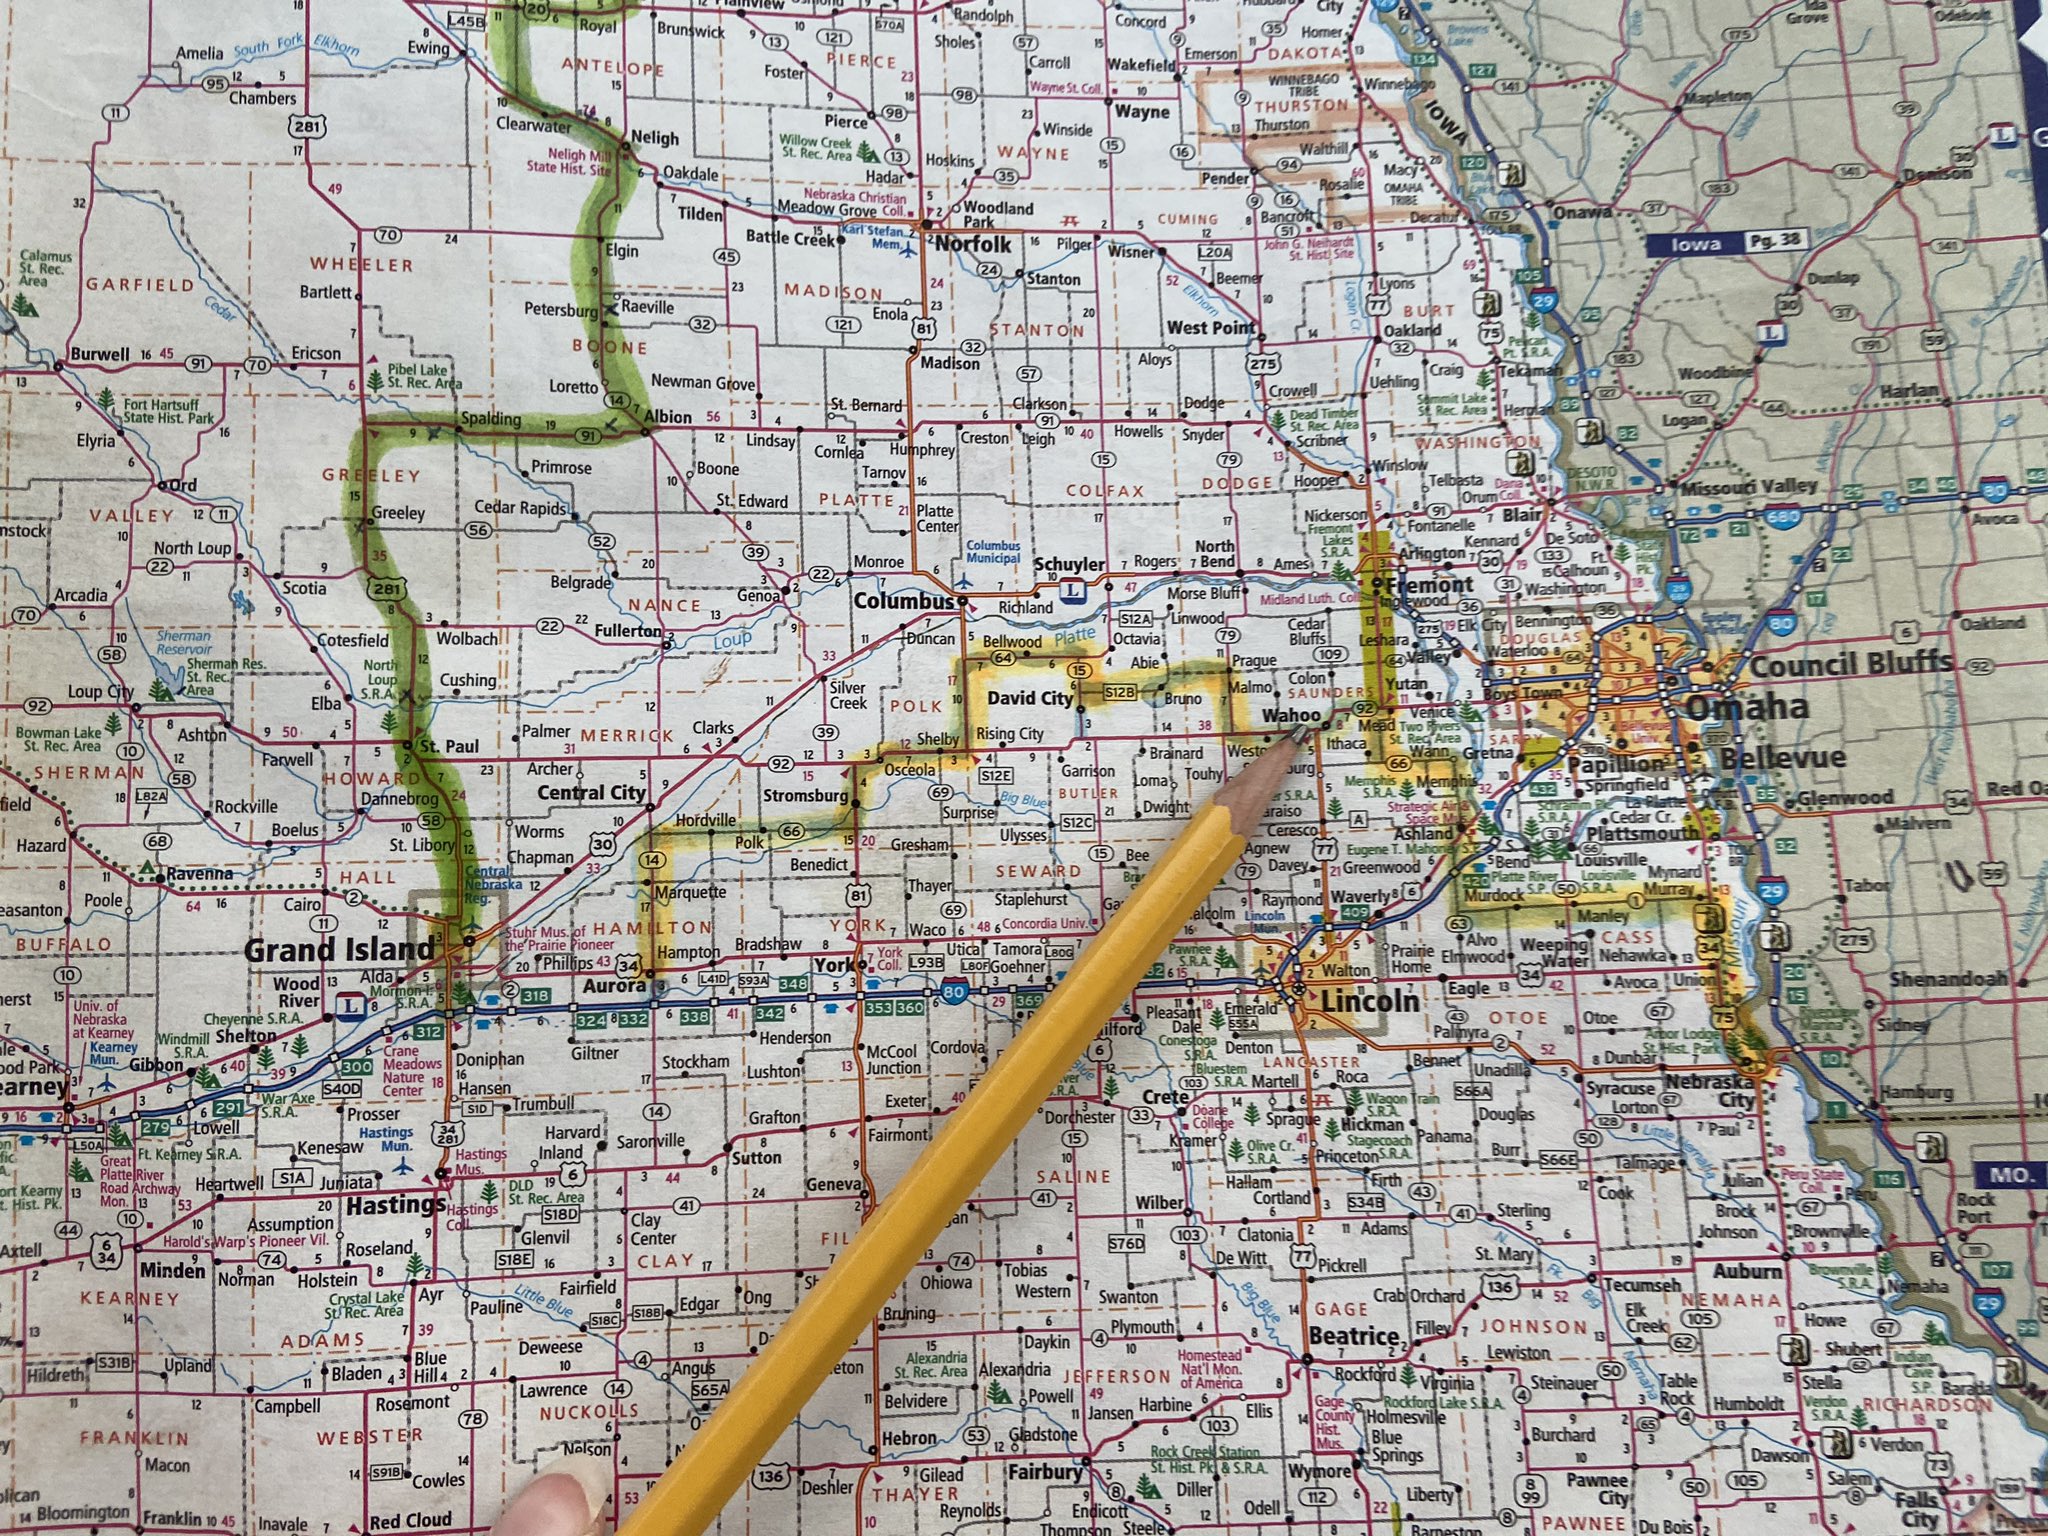
My route today on #pftour20 in Nebraska. We are headed 100 miles out of Grand Island east to Wahoo, where we will start sampling.


Image


We will be sampling in district 6, which is the east central district of Nebraska.


Image

By metmike - Aug. 18, 2020, 11:25 a.m.
Like Reply

2 stops in Saunders County west of Omaha. 209.5 on the yellow #corn. #Soybeans were 1776 (?) and 1120 pods in a 3x3 foot. First stop was white corn, 168.6. This district was 182.7 bpa and 1178 pods in 2019 on the tour. #pftour20


Image

By 7475 - Aug. 18, 2020, 8:47 p.m.
Like Reply

Duh

By mcfarm - Aug. 19, 2020, 9:45 a.m.
Like Reply
By metmike - Aug. 19, 2020, 11:08 a.m.
Like Reply

Thanks mcfarm!


By metmike - Aug. 19, 2020, 11:10 a.m.
Like Reply


Indiana #corn yields averaged 179.84 bu/acre on #pftour20, up 11% YOY and up 5% on the 3yr tour avg. Soybean pod counts of 1281.12 are up 39% on the 2019 tour and up 13% on the 3yr avg. The 2018 tour found 182.3 and 1312 pods in Indiana’s record yielding year.

Image

By metmike - Aug. 19, 2020, 11:11 a.m.
Like Reply

Nebraska #corn yields averaged 175.15 bu/acre on #pftour20, up 2% both YOY and on the 3yr tour avg. Soybean pod counts of 1297.93 pods up 7% YOY and up 7% on the 3yr average. Both are similar to what the tour found in 2018 (179.2 and 1299).

Image

By metmike - Aug. 19, 2020, 11:19 a.m.
Like Reply

I'll be starting in the D3 drought zone:Image

Image

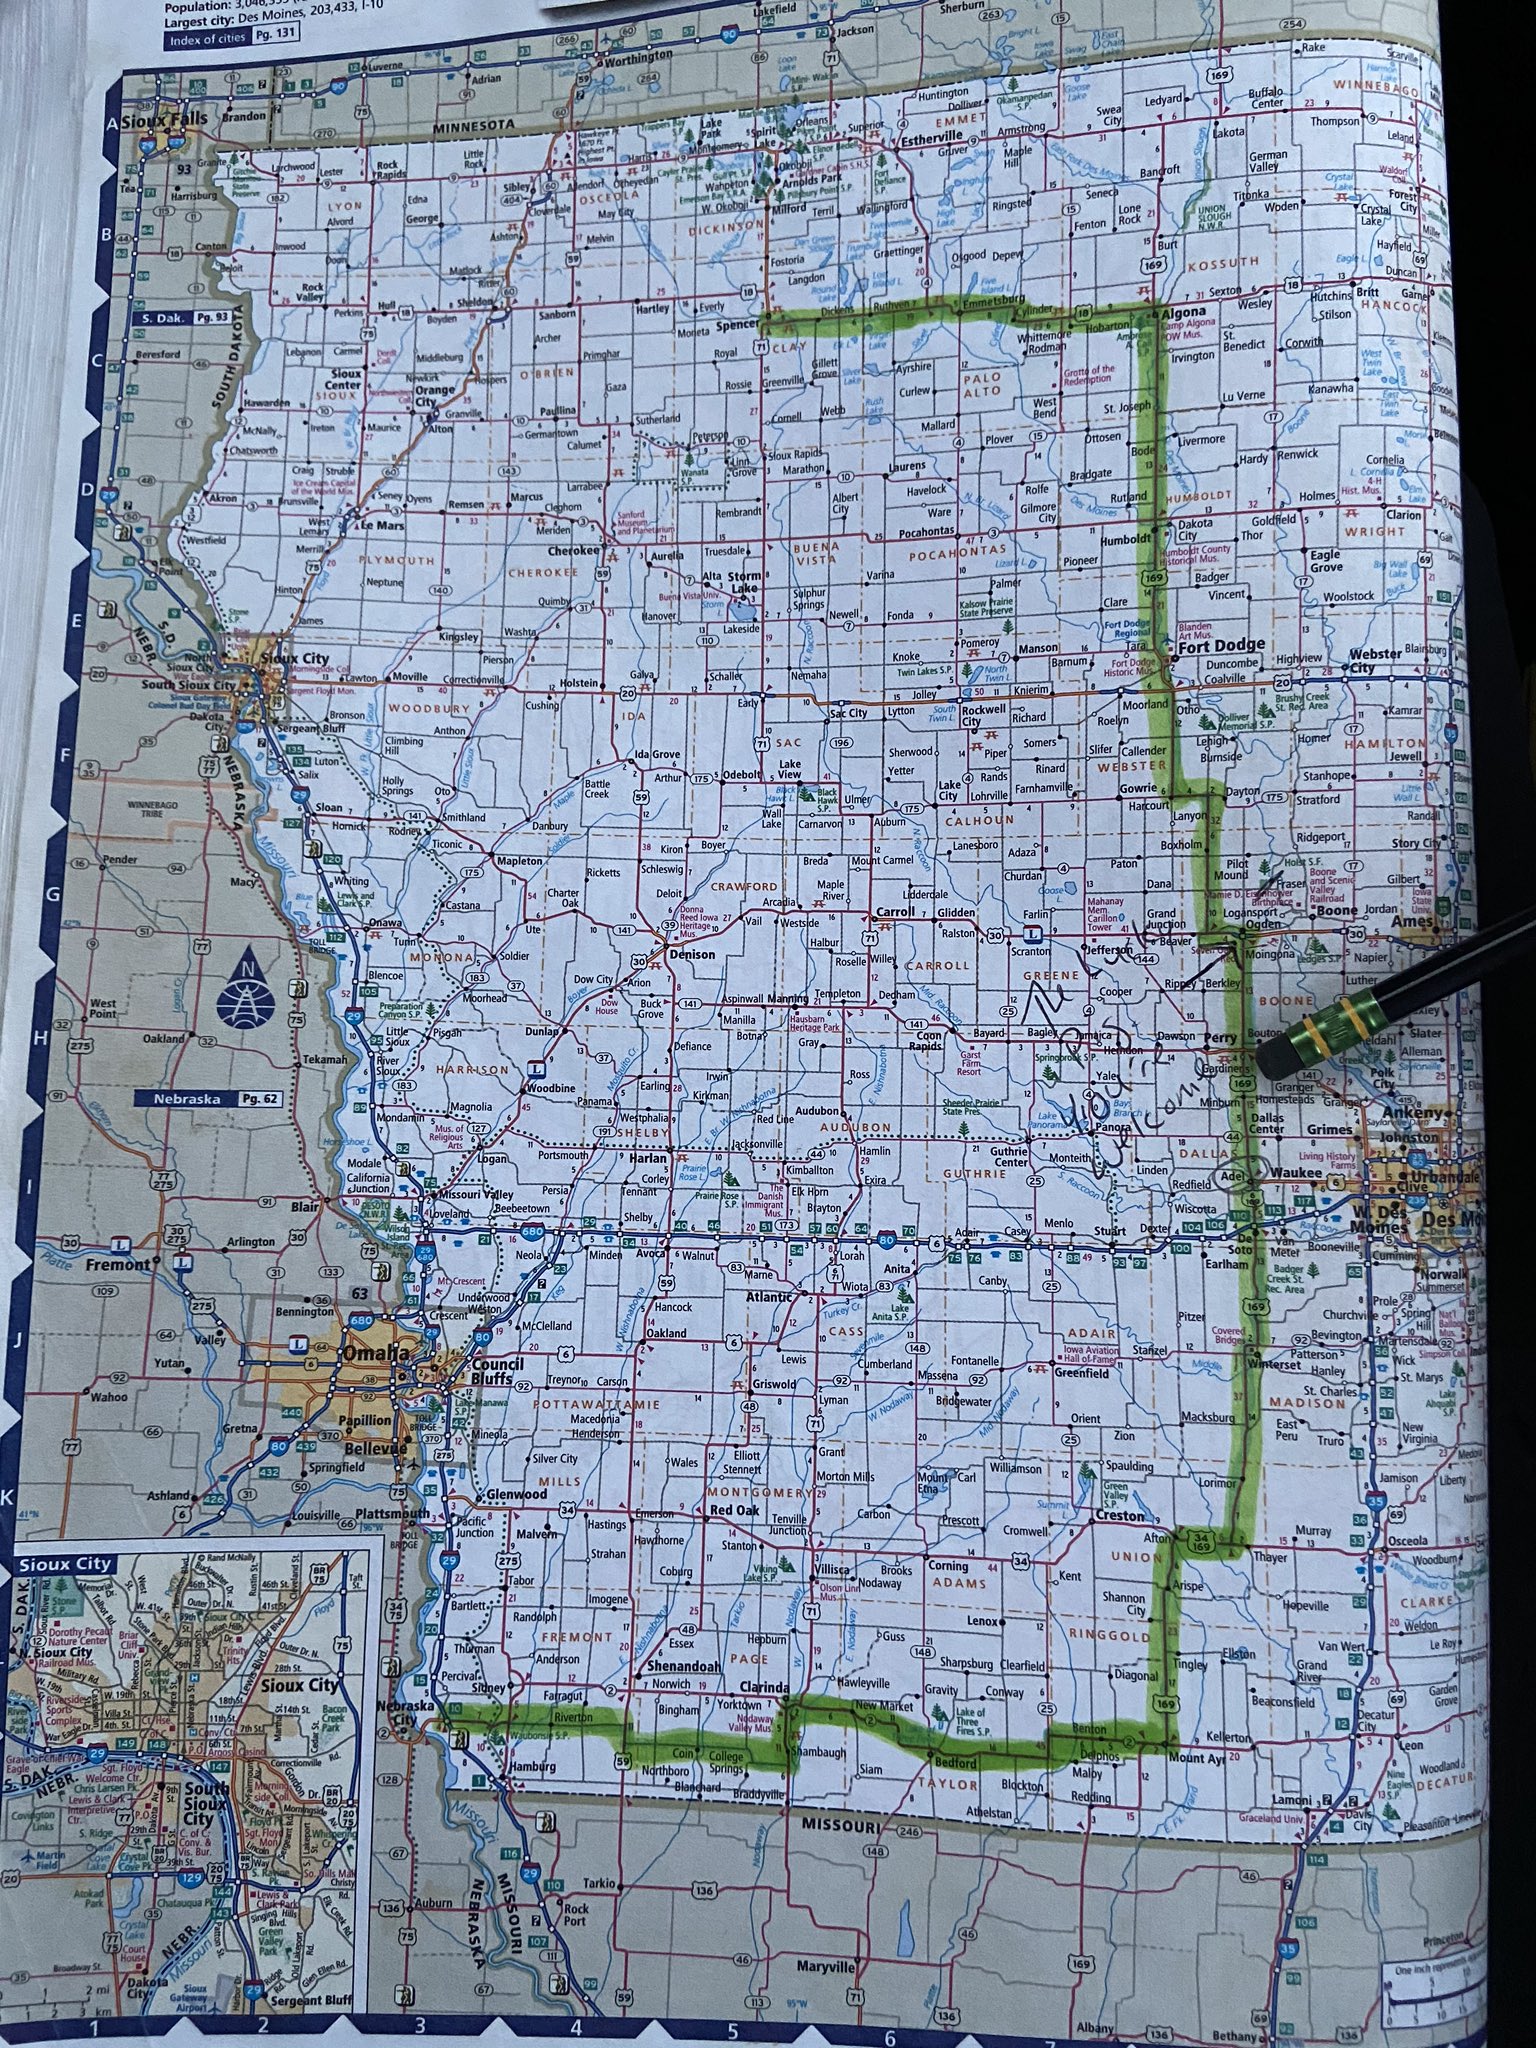
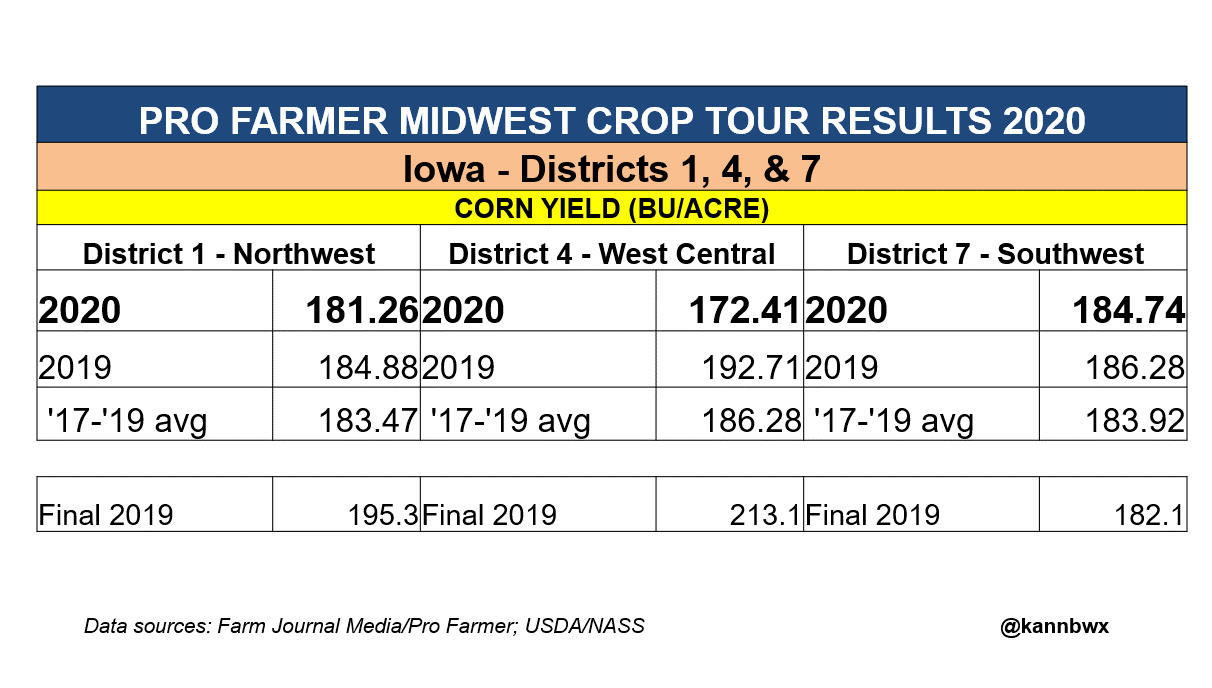
My route in Western Iowa for day 3 of #pftour20. We are driving this morning and will start checking fields just south of Perry (2nd half of route).

By metmike - Aug. 19, 2020, 1:44 p.m.
Like Reply

@kannbwx


Dallas and Boone County, Iowa, just NW of Des Moines. All had severe wind damage, but not all the #corn plants are broken. Some were. Even if the plant is strongly leaning, it still could be harvestable as long as it incurs no more damage. Yields varied. #pftour20

ImageImageImageImage

By metmike - Aug. 20, 2020, 2:10 a.m.
Like Reply

#Corn yields in Western Iowa as sampled by #pftour20 are down from 2019. Northwest Iowa is down 2% YOY and -1% on the 3yr tour average, West Central is down 11% YOY and -7% on 3yr, Southwest is down 1% YOY and +0.4% on 3yr.


Image

By metmike - Aug. 20, 2020, 2:11 a.m.
Like Reply

Illinois #corn yields averaged 189.4 bu/acre on #pftour20, up 11% YOY and +4% on the 3yr tour avg. Soybean pod counts of 1247.38 pods up 25% YOY and +5% on the 3yr. Tour got 192.63 bpa/1329 pods in 2018, Illinois’ record yielding years. USDA has 2020 soy edging 2018 by 0.5 bpa.


Image

By metmike - Aug. 21, 2020, 11:45 a.m.
Like Reply

Iowa #corn yields averaged 177.81 bu/acre on #pftour20, the lowest tour finding since 2013, down 3% on 2019 & the 3yr avg. USDA has Iowa 1 bpa shy of 2016’s record.  Soybean pod counts of 1146.3 are down 6% from the 2016 tour, but USDA has yield for #soybeans down 3% from 2016.


Image

By metmike - Aug. 21, 2020, 11:46 a.m.
Like Reply

Minnesota #corn yields averaged 195.08 bu/acre on #pftour20, up 15% from last year’s tour. Looks like a tour record. USDA has MN corn yield +14% YOY. Soybean pod counts of 1085.84 are up 12% YOY and up 6% from the 3yr. USDA has yield for #soybeans up 16% YOY.


Image

By metmike - Aug. 21, 2020, 3:15 p.m.
Like Reply

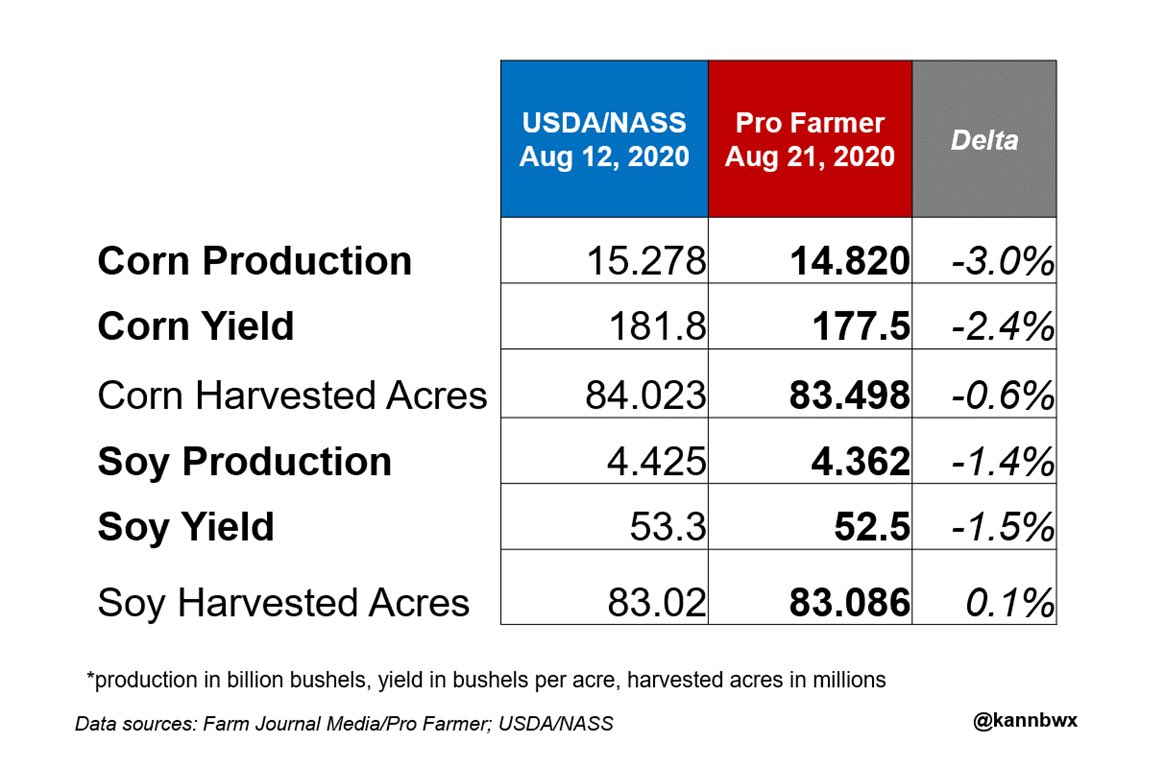
Pro Farmer's average production estimates for #corn and #soybeans are below those of USDA.

Image


++++++++++++++++++++++++++++++++++++++++++

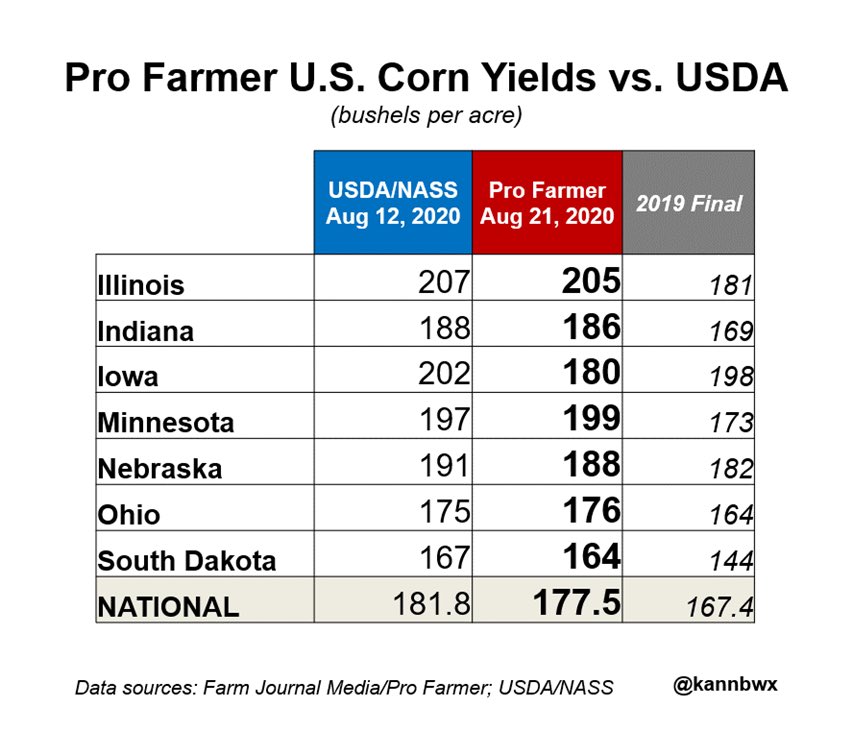
Pro Farmer estimates U.S. #corn yield at a record 177.5 bu/acre, but 4.3 bpa below USDA’s number. Iowa at 180 bpa would be the lowest since 2013. Pro Farmer’s projection incorporates data from #pftour20 and other items such as crop maturity.

Image

++++++++++++++++++++++++++++++++++++++++++++++++++++++++++++++++

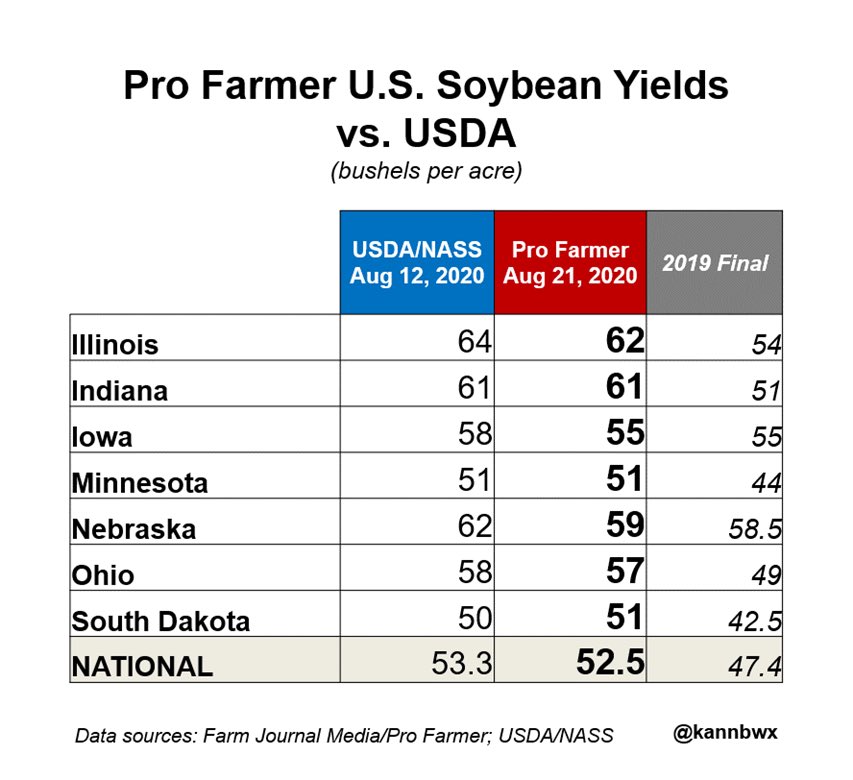
#Soybeans 52.5 bu/acre

Image


By wglassfo - Aug. 21, 2020, 3:35 p.m.
Like Reply

I have posted this before and I am sticking to my story

I am convinced that china has suffered crop failure over a wide area and food security is now an issue

I won't repeat all the crop problems, with grain production in china, previously posted on the forum

If china was importing normal amounts then they certainly would not buy from the USA considering all the tensions with USA/china disputes, especially in the south seas, HK and Taiwan

A few pennies saved on a bu of grain due to USD value does not mean much when china is in a cold war with the USA

China is buying USA grain because they have to, plain and simple, and USA grain is on sale, compared to china domestic food/grain prices. China has even bought some meat, thus all signs point to a grain shortage from more than usual crop failure, that will happen most yrs, some place in china

Look for more purchases from china to appear as time goes by. Perhaps the pace will slow down but increased sales of USA grain will continue, and it isn't because of any Phase One agreement which they did not intend to honor, until their domestic crops failed. They will buy only what they need and no more.

By metmike - Aug. 21, 2020, 4:14 p.m.
Like Reply

Thanks Wayne!

I agree with you.


Also, the August USDA crop report will serve as the highest production number of the year, with high confidence.

1. Dryness in key areas during the last few weeks has lowered yields by a couple of bushels. This is the key pod filling time frame for beans. 

2. Crop ratings dropped 2% last week from the previous week and will be down another couple % next Monday.

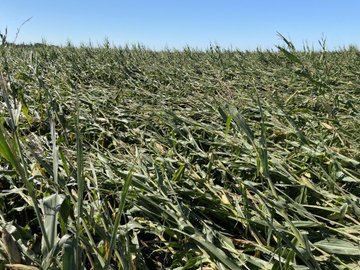
3. The Derecho event completely wiped out several % of IA's corn crop. 

4. There will be modest heat fill for corn kernels coming up the next week. This is going to cause some lower test weights/lower yields than ideal temps. However, offsetting that, is the temperature map below. Temperatures the past 30 days have been pretty favorable for kernel filling, with little "heat fill" as I was expecting earlier in the Summer. 

https://www.cpc.ncep.noaa.gov/products/tanal/30day/max_min/20200819.30day.max_min.F.gif