oct is normally a down month in gold.
i still think we could test 1800. and would not be surprised to see a trading range between 1800 and 2000 for the next 6-to 12 months before making new highs.
Still looks like a bull flag to me on the 6 month and 1 year charts farther down bear and on the verge of an upside breakout on the 10 year chart.
https://www.kitco.com/charts/livegold.html
![Live New York Gold Chart [Kitco Inc.]](https://www.kitco.com/images/live/nygold.gif)


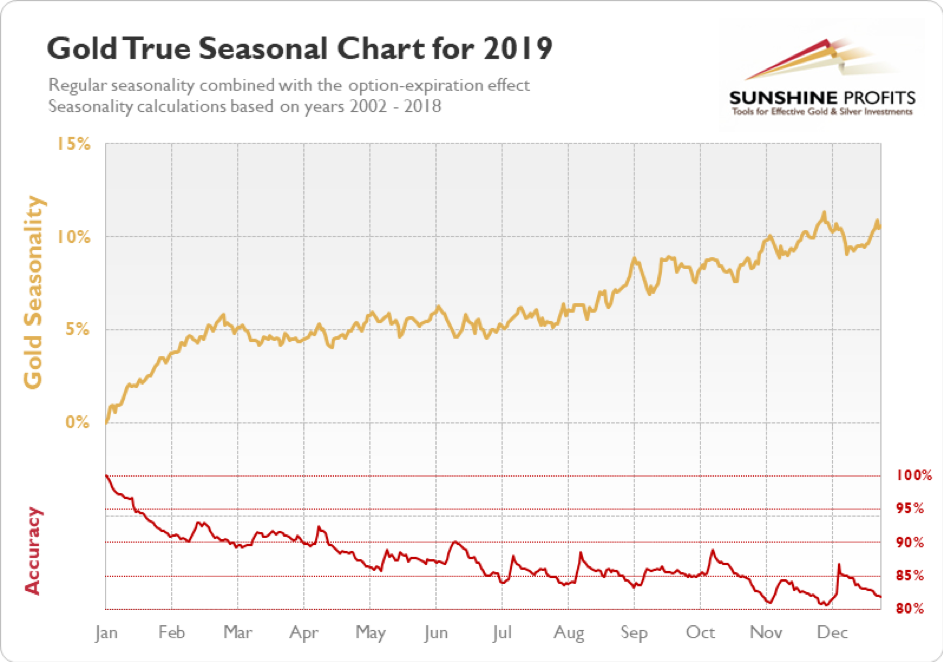
How much seasonality we have in this environment is a big question.
https://www.sunshineprofits.com/gold-silver/charts/seasonal-charts/gold-seasonality/
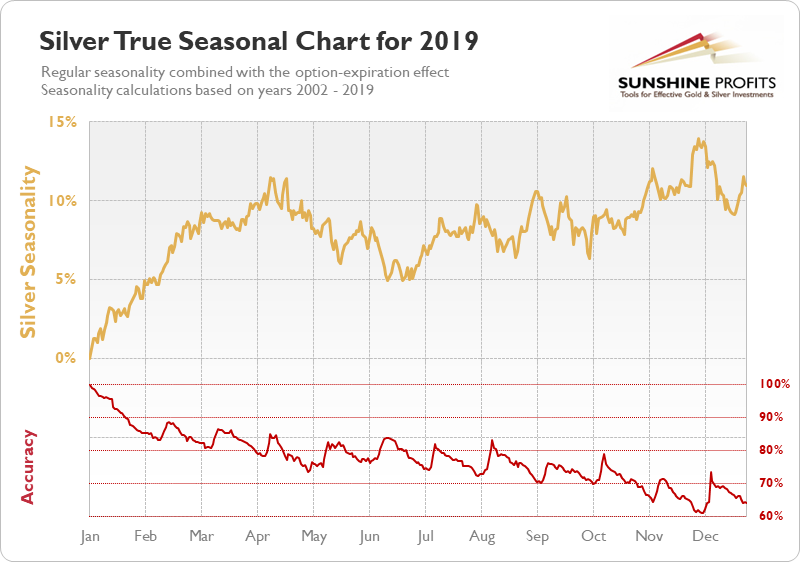
Here is the seasonal from the same site for Silver:
More price charts for Gold:
https://www.kitco.com/charts/techcharts_gold.html
| June 20, 2020, 11:20 a.m. metmike |
http://www.321gold.com/charts/seasonal_gold.html
depends on which seasonal chart one looks at. this one goes back to 76, so it includes the long 20 yr bear market.
the seasonal charts you provided started in 2002, so does not include the 80's and 90's.
but past october, if we look at the yen chart to the left, the buck looks like it should continue lower against the yen.
normally the yen and gold move together, so if the yen is going up, the gold should go up.
Why would anybody trade gold futures
Doesn't the futures market/price for gold seem a bit odd, when physical gold coins on E-Bay have an asking price of 2050 per 1 oz coins
Most gold and silver dealers have limited amounts with some coins and bars not available.
Seems to be a bit of disconnect to me
If you stand for physical delivery of an asset other than PM you get the physical at the price quoted at delivery plus warehouse fees etc.
Anybody think you will receive gold at the delivery quote
I might stand to be corrected as I have no idea what the banks pay for physical, that they store in their own vault
![Live 24 hours gold chart [Kitco Inc.]](https://www.kitco.com/images/live/gold.gif)
![gold Technical chart [Kitco Inc.]](https://www.kitco.com/lfgif/au0365lf_ma.gif)
![gold Technical chart [Kitco Inc.]](https://www.kitco.com/lfgif/au0730lf_ma.gif)
![gold Technical chart [Kitco Inc.]](https://www.kitco.com/lfgif/au1825lf_ma.gif)
![gold Technical chart [Kitco Inc.]](https://www.kitco.com/lfgif/au2920lf_ma.gif)
![gold Technical chart [Kitco Inc.]](https://www.kitco.com/lfgif/au3650lf_ma.gif)


