Weather December 13, 2020
19 responses | 0 likes
Started by metmike - Dec. 12, 2020, 7:56 p.m.

Delightful mid-December to you! 

Dec 14: bigger cold threat later this month, mainly European model.

Alaska and Canada are filling up with FRIGID air.  A couple moderated shots of that cold will cross the border into the US...........but the cold won't be sustained. The story this week will be the first snowstorms of the season for some locations.


Reasons to keep being thankful here in 2020!

https://www.marketforum.com/forum/topic/45623/


NEW: Detailed analysis. Latest COVID-19 numbers. Hospitals are near capacity in many places. Things are pretty bad and getting worse but there is a light at the end of the tunnel and its not a train...it's the realistic odds of getting back close to normal next Summer.


https://www.marketforum.com/forum/topic/61206/


 Scroll down and  enjoy the latest comprehensive weather to the max...... occurring because of the natural physical laws in our atmosphere as life on this greening planet continues to enjoy the best weather/climate in at least 1,000 years(the last time that it was this warm) with the added bonus of extra beneficial CO2.

Most maps below will automatically update each day(not the snow map).


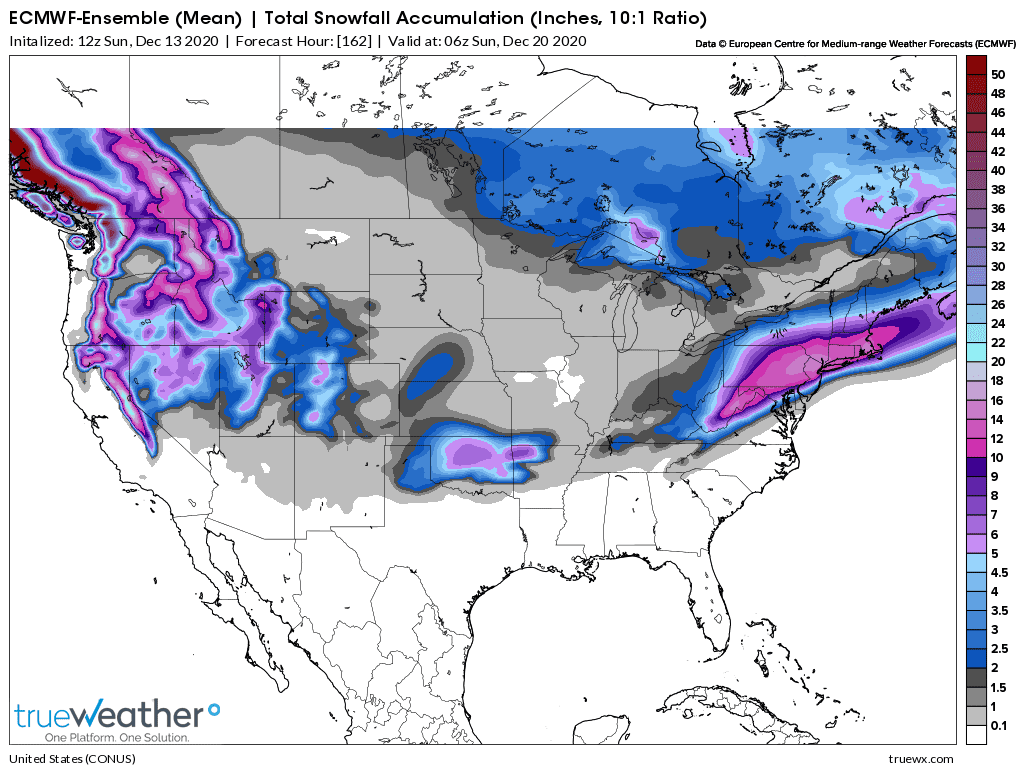
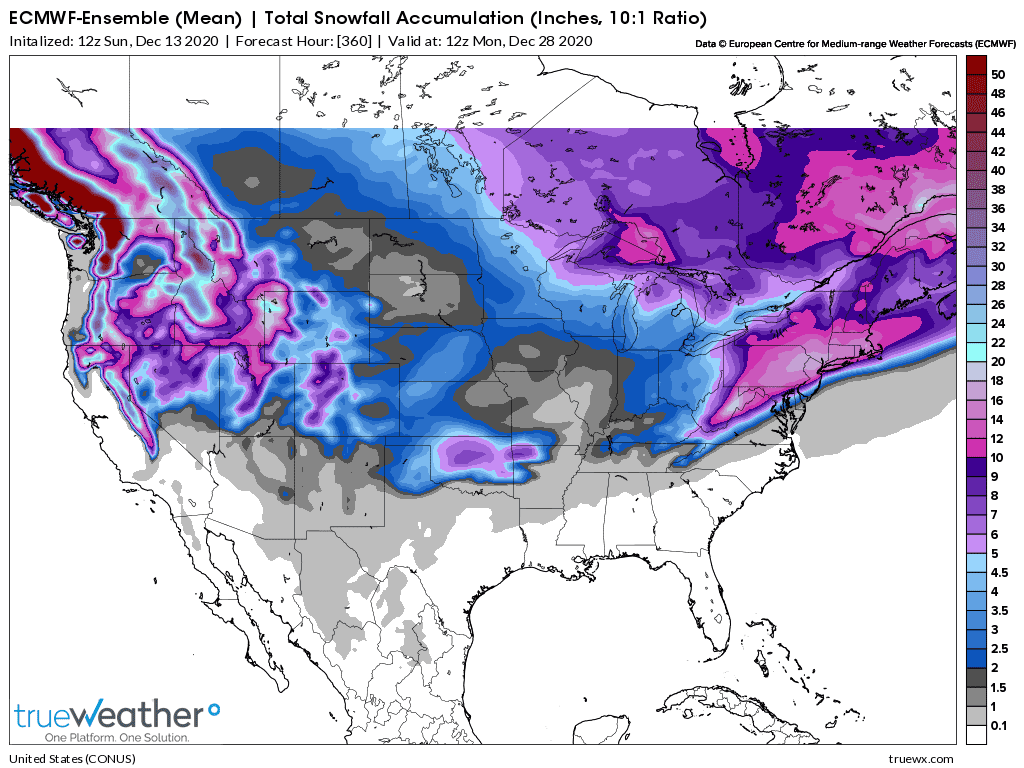
Total Snow THIS week from the 12z European Ensemble model from Sunday. Total 2 week snow accumulation below that.

Weather Model


Weather Model

Weather Model


Go to the link below, then hit the location/county on the map for details.

                 https://www.spc.noaa.gov/                 Go to "hazards"      


Here are the latest hazards across the country.

                                                            Southern Florida NE Gulf N of 25N E of 87WGulf from 22N to 25N E of 87W including Straits of Florida NW Gulf including Stetson BankN Central Gulf including Flower Garden Banks Marine SanctuaryW Central Gulf from 22N to 26N W of 94WCentral Gulf from 22N to 26N between 87W and 94W Atlantic from 27N to 31N W of 77WAtlantic from 27N to 31N between 70W and 77WAtlantic from 27N to 31N between 65W and 70WBahamas N of 22N including the Cay Sal BankAtlantic from 22N to 27N E of Bahamas to 70W Tropical N Atlantic from 15N to 19N between 55W and 60WCaribbean N of 18N between 76W and 85W including the Cayman BasinCaribbean N of 18N between 76W and 85W including the Cayman BasinCaribbean approaches to the Windward PassageAtlantic S of 22N W of 70W including approaches to the Windward PassageNewport/Morehead City, NCBrownsville, TXCorpus Christi, TXHouston/Galveston, TXNew Orleans, LALake Charles, LAMobile, ALTallahassee, FLTampa, FLMiami, FLKey West, FLFlorida KeysMiami, FLMelbourne, FLJacksonville, FLCharleston, SCWilmington, NCBaltimore/Washington, DCWakefield, VAPhiladelphia/Mt. Holly, PA/NJNew York, NYBoston, MAGray/Portland, ME Intra Coastal Waters from Schoodic Point ME to Stonington MECoastal Waters from Schoodic Point ME to Stonington ME out 25 NMWaters from Eastport ME to Stonington ME from 25 to 40 NMNortheast Minnesota and Northern WisconsinNorthern MichiganNorthern MichiganNorthern MichiganEast Central Wisconsin - Green BayEast Central Wisconsin - Green BaySouthern and Southeastern WisconsinNortheastern Illinois and Northwestern Indiana - ChicagoNorthern Indiana and Northwestern OhioSouthwestern MichiganNortheast Michigan - GaylordNortheast Michigan - GaylordNortheast Michigan - GaylordSoutheastern Michigan - DetroitSoutheastern Michigan - DetroitSoutheastern Michigan - DetroitNorthern OhioWestern New York - BuffaloWestern New York - Buffalo Northern MichiganLos Angeles, CASan Diego, CASan Francisco Bay Area/Monterey, CAEureka, CAMedford, ORPortland, ORSeattle, WALos Angeles AreaLos Angeles AreaLos Angeles AreaLos Angeles AreaLos Angeles AreaLos Angeles AreaSouth Central CaliforniaSan Francisco AreaWestern NevadaNorth Central CaliforniaNorthwest California CoastSouthwest Oregon and Northern CaliforniaNortheast Oregon and Southeast WashingtonNorthwest OregonNorthwest WashingtonEastern Washington and Northern IdahoSouthern Nevada, Southeastern California and Northwestern Arizona - Las VegasSouthwestern California - San DiegoCentral Arizona and California DesertsSoutheast ArizonaNorthern ArizonaUtahNorthern and Northeastern NevadaSouthwestern Idaho and Eastern OregonSoutheastern IdahoWestern Montana and Central IdahoCentral Montana - Great FallsNortheastern MontanaSoutheastern MontanaWestern WyomingSoutheastern Wyoming and Western NebraskaNortheastern ColoradoWestern Colorado and Eastern UtahSoutheastern ColoradoNorthern and Central New MexicoSouthern New Mexico and extreme Western Texas - El PasoTexas and OklahomaLubbock and South Plains TexasWestern Texas and Southeastern New MexicoWestern South Dakota and Northeastern WyomingNorthwestern Kansas and East Central Colorado - GoodlandCentral Nebraska - North PlatteNorth Central Kansas and South Central NebraskaSoutheastern South Dakota, Southwestern Minnesota, and Northwestern IowaNorthern and Northeastern South DakotaWestern North DakotaEastern Nebraska and Southwestern Iowa - Omaha ValleyNortheastern KansasSoutheastern KansasSouthwestern Kansas - Dodge CityCentral OklahomaEastern Oklahoma and Northwestern ArkansasDallas and Fort WorthCentral Texas - San AngeloAustin and San Antonio TexasCorpus Christi, Victoria, and Laredo TexasSouthern TexasTexas - Houston/GalvestonSoutheast Texas and Southwest LouisianaNorthern Louisiana and Eastern Texas - ShreveportArkansasSouthwestern MissouriNorthwestern MissouriCentral IowaSouthern MinnesotaNortheastern North Dakota and Northwestern MinnesotaNortheast Minnesota and Northern WisconsinSouthwestern Wisconsin, Southeastern Minnesota, and Northeast IowaEastern Iowa and Northwestern Illinois - Quad CitiesEastern Missouri - West Central IllinoisWestern Tennessee, Eastern Arkansas and Northern Mississippi - MemphisCentral MississippiSoutheastern LouisianaMiddle TennesseeNorthern AlabamaCentral AlabamaMobile - PensacolaWest Central FloridaEast Central FloridaPanhandle of Florida and Southwestern GeorgiaNortheast Florida and Southeast GeorgiaNorthern and Central GeorgiaLow Country of South Carolina and GeorgiaNortheastern South Carolina and Southeastern North Carolina - WilmingtonCentral South Carolina and CSRAWestern North Carolina and Northwest South CarolinaEastern TennesseeEastern KentuckyCentral KentuckySouthern Illinois and Indiana, Southeastern Missouri and Western KentuckyCentral and East Central IllinoisCentral IndianaNortheastern Illinois and Northwestern Indiana - ChicagoSouthern and Southeastern WisconsinEast Central Wisconsin - Green BayNorthern MichiganNortheast Michigan - GaylordNortheast Michigan - GaylordSoutheastern Michigan - DetroitSouthwestern MichiganNorthern Indiana and Northwestern OhioSouthwestern Ohio Northern KentuckyWest VirginiaWestern Virginia, Southeast West Virginia, and Northwest North CarolinaCentral North Carolina - RaleighEastern North CarolinaEastern Virginia, Southern Maryland and Northeast North CarolinaWashington D.C., Central Maryland, Northern Virginia, Eastern West VirginiaWestern Pennsylvania, East Central Ohio and Extreme Western MarylandNorthern OhioCentral PennsylvaniaNew Jersey, Delaware, and Southeastern PennsylvaniaNew York City and Surrounding AreasSouth Central New York and Northeastern PennsylvaniaWestern New York - BuffaloEastern New York and Western New England AreasBoston and Surrounding AreasNorthern Vermont and New YorkSouthern Maine and New HampshireNorthern Maine Gulf of Maine to the Hague LineGeorges Bank between Cape Cod and 68W north of 1000 fathomsSouth of New England between the Great South Channel and Montauk Point to 1000 fathomsSouth of Long Island between Montauk Point and Sandy Hook to 1000 fathomsHudson Canyon to Baltimore Canyon to 1000 fathomsBaltimore Canyon to Cape Charles Light to 100 NM offshoreCape Charles Light to Currituck Beach Light to 100 NM offshoreCurrituck Beach Light to Cape Hatteras to 100 NM offshoreCape Hatteras to Cape Fear to 100 NM offshoreCape Fear to 31N to 1000 FMGeorges Bank between 68W and the Hague LineEast of 69W to the Hague Line between 1000 fathoms and 39NEast of 69W and south of 39N to 250 NM offshoreBetween 1000 fathoms and 38.5N west of 69WBaltimore Canyon to 69W east of 1000 fathoms and south of 38.5N to 250 NM offshoreBaltimore Canyon to Hatteras Canyon between 100 NM and 250 NM offshoreHatteras Canyon to Cape Fear 100 NM and 250 NM offshoreCape Fear to 31N east of 1000 fathoms to 250 NM offshoreCape Flattery to Cape Shoalwater between 60 NM and 150 NM offshoreCape Shoalwater to Cape Lookout between 60 NM and 150 NM offshoreCape Lookout to Florence, OR between 60 NM and 150 NM offshoreFlorence, OR to Point St. George between 60 NM and 150 NM offshorePoint St. George to Point Arena between 60 NM and 150 NM offshorePoint Arena to Pigeon Point between 60 NM and 150 NM offshorePigeon Point to Point Piedras Blancas between 60 NM and 150 NM offshorePoint Piedras Blancas to Santa Cruz Island, CA between 60 NM and 150 NM offshoreSanta Cruz Island, CA to San Clemente Island, CA between 60 NM and 150 NM offshoreCape Flattery to Cape Shoalwater between 150 NM and 250 NM offshoreCape Shoalwater to Cape Lookout between 150 NM and 250 NM offshoreCape Lookout to Florence, OR between 150 NM and 250 NM offshoreFlorence, OR to Point St. George between 150 NM and 250 NM offshorePoint St. George to Point Arena between 150 NM and 250 NM offshorePoint Arena to Pigeon Point between 150 NM and 250 NM offshorePigeon Point to Point Piedras Blancas between 150 NM and 250 NM offshorePoint Piedras Blancas to Santa Cruz Island, CA between 150 NM and 250 NM offshoreSanta Cruz Island, CA to 120W between 150 NM and 250 NM offshoreSan Clemente Island, CA to Guadalupe Island from 60 NM Offshore west to 120W                                                                                                                                                                  


Purple/Pink/blue on land is cold/Winter weather. Brown is wind,  Green is flooding. Gray is fog.  Reddish is a red flag advisory.  

Go to the link below, then hit the location/county on the map for details.

                 https://www.spc.noaa.gov/                 Go to "hazards"                                                                                     


https://www.mesonet.org/index.php/weather/map/us_air_temperature/air_temperature


https://www.mesonet.org/index.php/weather/map/wind_chill_heat_index1/air_temperature


 Current Weather Map


NCEP Days 0-7 Forecast Loop
NCEP Short-Range Model Discussion
NCEP Day 3-7 Discussion


Understanding These Maps
Surface Map Legend
Precip Legend
NCEP Surface Maps
(Mouseover)

U.S. Surface Analysis
National Radar Image
12-Hr Forecast
24-Hr Forecast
36-Hr Forecast
48-Hr Forecast
Short Term Loop
Day 3 Forecast
Day 4 Forecast
Day 5 Forecast
Day 6 Forecast
Day 7 Forecast
Low Tracks Error Circle
Low Tracks Ensemble


Legend


Current Jet Stream


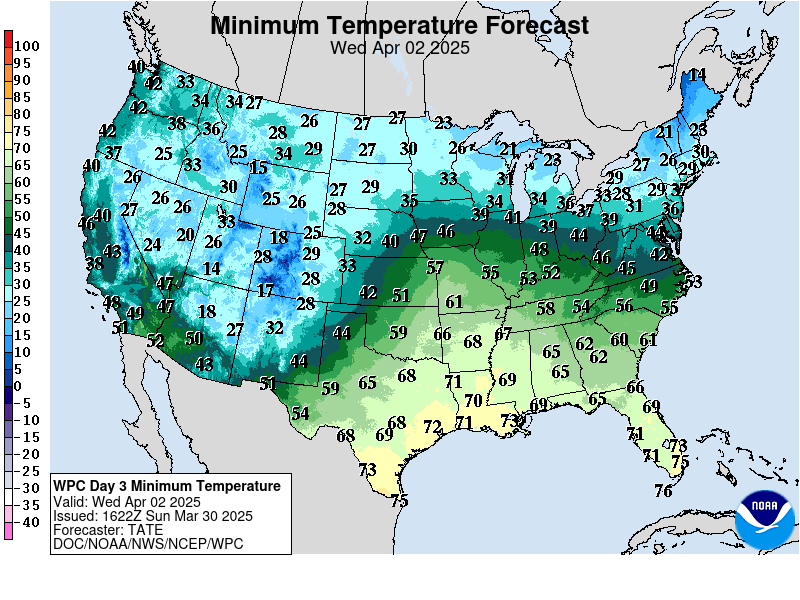
Low Temperatures Tomorrow Morning


Highs today and tomorrow.


Comments
By metmike - Dec. 13, 2020, 12:33 a.m.
Like Reply

Highs for days 3-7:

A bit chilly..............but seasonal for December!

Moderating next weekend.


http://www.wpc.ncep.noaa.gov/medr/DAY3_MAX_filled.gif

https://www.wpc.ncep.noaa.gov/medr/DAY4_MAX_filled.gif

http://www.wpc.ncep.noaa.gov/medr/DAY5_MAX_filled.gifhttp://www.wpc.ncep.noaa.gov/medr/DAY6_MAX_filled.gif


https://www.wpc.ncep.noaa.gov/medr/DAY7_MAX_filled.gif


By metmike - Dec. 13, 2020, 12:34 a.m.
Like Reply

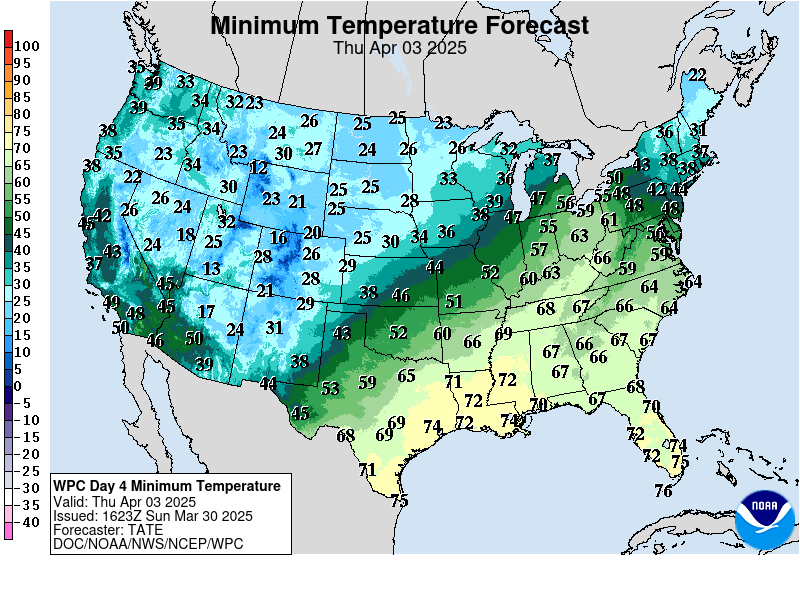
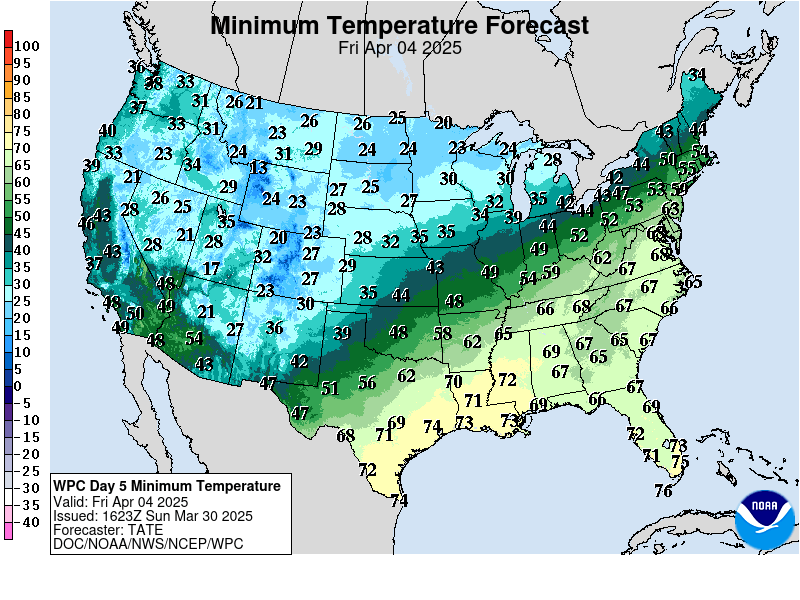
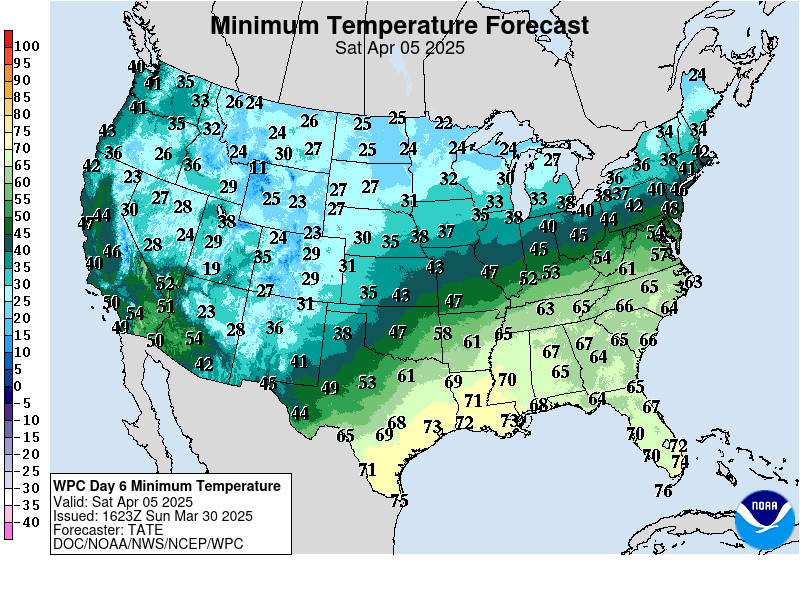
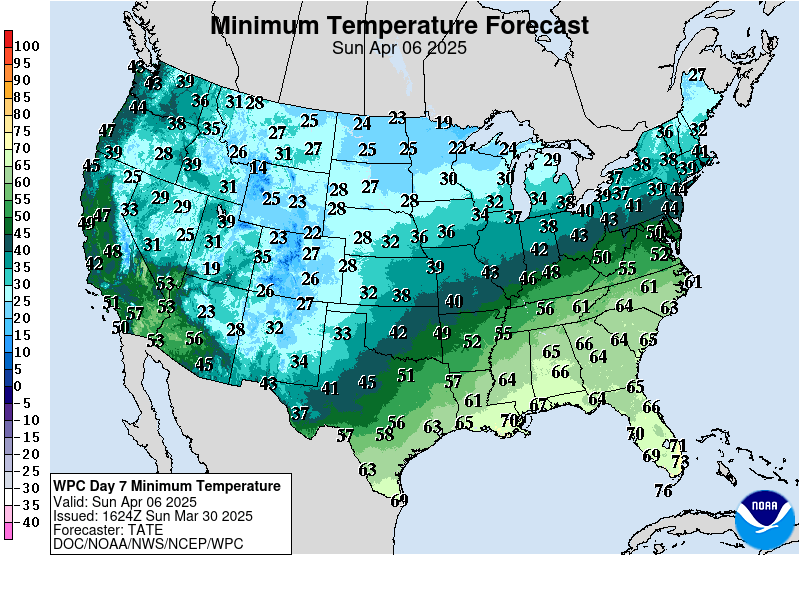
Lows days 3-7 below:

Freeze line fairly far south but not  unusual for this time of year!

Cold enough for snow in many locations!


https://www.wpc.ncep.noaa.gov/medr/medr_min.shtml

https://www.wpc.ncep.noaa.gov/medr/DAY3_MIN_filled.gifhttps://www.wpc.ncep.noaa.gov/medr/DAY4_MIN_filled.gifhttps://www.wpc.ncep.noaa.gov/medr/DAY5_MIN_filled.gifhttps://www.wpc.ncep.noaa.gov/medr/DAY6_MIN_filled.gifhttps://www.wpc.ncep.noaa.gov/medr/DAY7_MIN_filled.gif


By metmike - Dec. 13, 2020, 12:35 a.m.
Like Reply

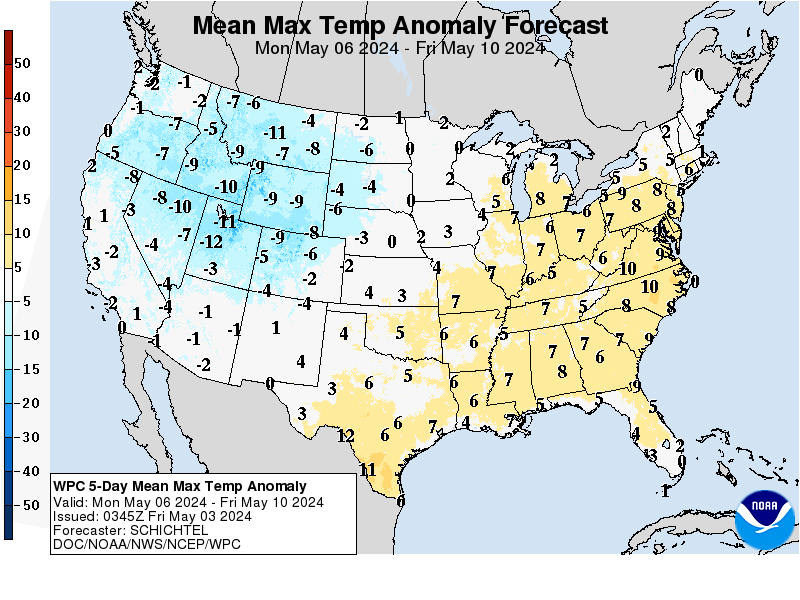
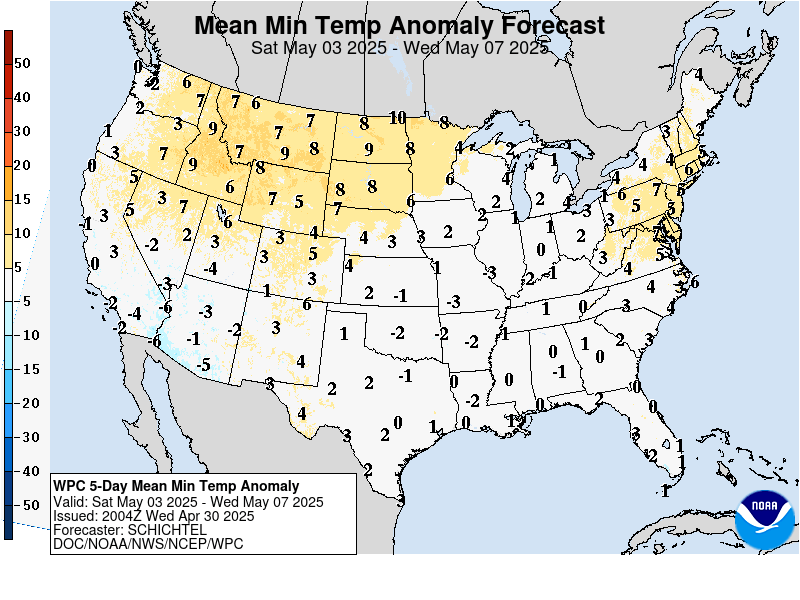
Temperatures compared to Average for days 3-7

Above average N.Plains.  Chilly in the Deep South and East vs average.


https://www.wpc.ncep.noaa.gov/medr/medr_mean.shtml


https://www.wpc.ncep.noaa.gov/medr/DAY3-7_MAX_ANOM_filled.gif


https://www.wpc.ncep.noaa.gov/medr/DAY3-7_MIN_ANOM_filled.gif


By metmike - Dec. 13, 2020, 12:37 a.m.
Like Reply

Surface Weather features days 0-1-2 then days 3-7:


 A couple of snowstorms the next 4 days. 


https://www.cpc.ncep.noaa.gov/products/forecasts/

Days 0-1-2 below:


Forecast of Fronts/Pressure and Weather valid Sun 18Z


Forecast of Fronts/Pressure and Weather valid Mon 12Z

Forecast of Fronts/Pressure valid Tue 12Z


Days 3-7 below:
https://www.wpc.ncep.noaa.gov/medr/5dayfcst_wbg_conus.gif


By metmike - Dec. 13, 2020, 12:39 a.m.
Like Reply

Total Snow THIS week from the 12z European Ensemble model from Sunday.


Weather Model

By metmike - Dec. 13, 2020, 12:40 a.m.
Like Reply
By metmike - Dec. 13, 2020, 12:41 a.m.
Like Reply

Excessive rain potential.

None


Mesoscale Precipitation Discussions


Current Day 1 ForecastCurrent Day 1 Excessive Rainfall Forecast


Day 1 Threat Area in Text Format  


  Day 2 and Day 3 Forecasts 
Current Day 2 ForecastCurrent Day 2 Excessive Rainfall Forecast


Day 2 Threat Area in Text Format 


Current Day 3 ForecastCurrent Day 3 Excessive Rainfall Forecast


By metmike - Dec. 13, 2020, 12:41 a.m.
Like Reply

Severe Storm Risk the next 8 days:

Quiet!!

https://www.spc.noaa.gov/


Current Day 1 Outlook
        1300 UTC Day 1 Outlook             
               
          Current Day 2 Outlook
          0600 UTC Day 2 Outlook               
         
          Current Day 3 Outlook
          0600 UTC Day 3 Outlook               
                F
          Current Day 4-8 Outlook
          Day 4-8 Convective Outlook


By metmike - Dec. 13, 2020, 12:42 a.m.
Like Reply

Current Dew Points


Dry air in place. Gulf of Mexico closed for water vapor transport business to the north.

Current Dew Points


Latest radar loops


http://www.nws.noaa.gov/radar_tab.php

Doppler Radar National Mosaic Loop


Upper Mississippi Valley sector loop


 (3400x1700 pixels - 2.2mb)
Go to: Most Recent Image


Central Great Lakes sector loop
Go to: Most Recent Image


    You can go to this link to see precipitation totals from recent time periods:


https://water.weather.gov/precip/


                              Go to precipitation, then scroll down to pick a time frame. Hit states to get the borders to see locations better. Under products, you can hit "observed" or "Percent of Normal"


Soilmoisture anomaly:


These maps sometimes take a day to catch up to incorporate the latest data(the bottom map is only updated once a week).


https://www.cpc.ncep.noaa.gov/products/Soilmst_Monitoring/US/Soilmst/Soilmst.shtml#


Daily Soil Moisture Pecentile       

        Daily Anomaly Soil Moisture (mm)

        Monthly Soil Moisture Change

https://www.cpc.ncep.noaa.gov/products/analysis_monitoring/regional_monitoring/palmer.gif


By metmike - Dec. 13, 2020, 1:07 a.m.
Like Reply

Drought Monitor maps:

Latest: The first map below is the latest. The 2nd one is from last week.


      https://droughtmonitor.unl.edu/     Drought Monitor for conus


Drought Monitor for conus

By metmike - Dec. 13, 2020, 1:10 a.m.
Like Reply

The top map is the Canadian ensemble average,  the maps below are the individual members that make up the average at the end of week 2.

+++++++++++++++++++++++++++++++++++++++++

Each member is like the parent, Canadian model operational model.......with a slight tweek/variation in parameters. Since we know the equations to represent the physics of the atmosphere in the models are not perfect, its useful to vary some of the equations that are uncertain(can make a difference) to see if it effects the outcome and how.

The average of all these variations(ensembles) often yields a better tool for forecasting. It's always more consistent. The individual operational model, like each individual ensemble member can vary greatly from run to run.........and represent an extreme end of the spectrum at times. The ensemble average of all the members, because it averages the extremes.............from opposite ends of the spectrum.........changes much less from run to run.

End of week 2.................  Canadian ensembles:

December 13: After the period prior to this of slightly more amplified, meridional, north to south flow, (ridge west/trough east configuration) which will yield several cold days from cold in Canada  getting pushed into the US.........the flow...............at least on this model takes on a more zonal component. The GFS and European models look alot different than this, with modest ridging across the western  1/2 to 2/3rds and weak troughing along the East Coast.

360h GZ 500 forecast valid on Dec 28, 2020 12 UTC

GZ 500 forecastGZ 500 forecastGZ 500 forecastGZ 500 forecast

Forecasts for the control (GEM 0) and the 20 ensemble members (global model not available)

++++++++++++++++++++++++++


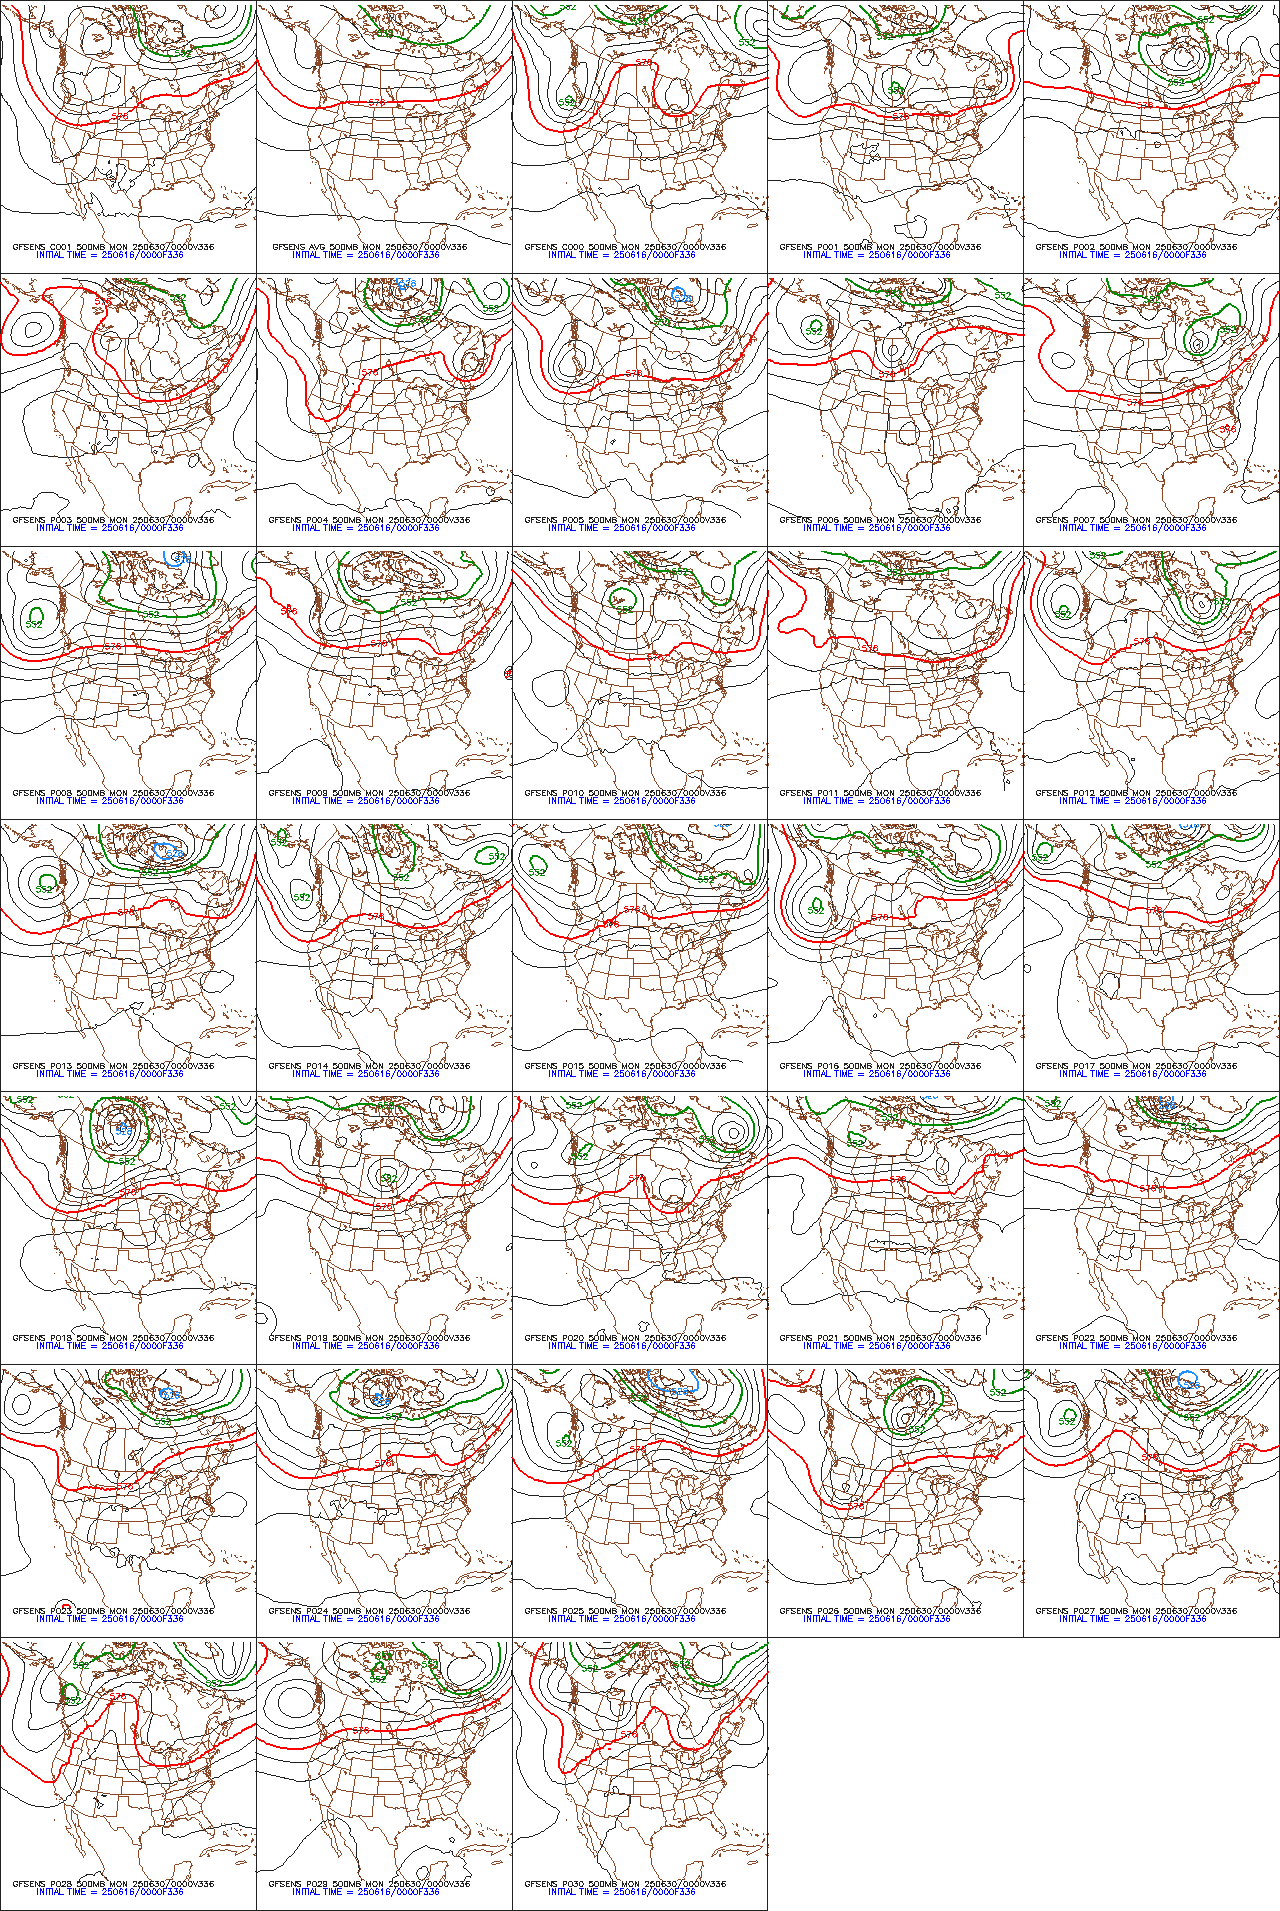
Individual GFS ensemble solutions for the latest 12z run at 336 hours:

http://mp1.met.psu.edu/~fxg1/ENSHGT_0z/f336.gif


December 13: Take you pick. Mucho differences in solutions. At least half like a ridge west/trough east couplet....... warm west, chilly east solution.


http://www.meteo.psu.edu/fxg1/ENSHGT_0z/f336.gif


By metmike - Dec. 13, 2020, 1:15 a.m.
Like Reply

GFS Ensemble mean(average of all the individual solutions above).  The first map is a mid/upper level map. The 2nd one is a temperatures map at around 1 mile above the surface. These are anomalies(difference compared to average).

NCEP Ensemble t = 360 hour forecast

December 13: Tremendous changes in the anomolies in short periods the next 2 weeks. So the one at 168 hours doesn't stick around long. Extreme negative anomaly in blue in Alaska and NW Canada, positive anomaly across the northern tier of the US, cuts off the frigid air in Canada. At 360 hours, we have a weak positive anomaly across the western 2/3rds of the US and a small negative in the Northeast. A new positive from Greenland to the N.Atlantic should be watched for a Greenland block -NAO potential at the end of the month. This is suggesting the coldest place at the end of the month will be the East Coast.
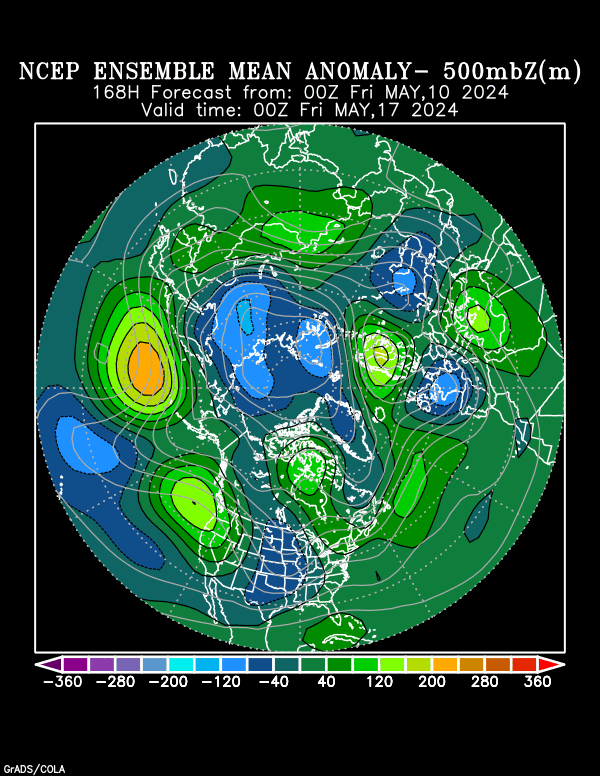


https://www.psl.noaa.gov//map/images/ens/z500anom_f168_nhbg.gif


https://www.psl.noaa.gov//map/images/ens/t850anom_f168_nhbg.gif


2 weeks out below

NCEP Ensemble t = 360 hour forecast product


https://www.esrl.noaa.gov/psd/map/images/ens/t850anom_f360_nhbg.gif

                                    ++++++++++

By metmike - Dec. 13, 2020, 1:18 a.m.
Like Reply

Latest, updated graph/forecast for AO and NAO and PNA here, including an explanation of how to interpret them...............mainly where they stand at the end of 2 weeks


https://www.marketforum.com/forum/t


Previous analysis, with the latest day at the bottom for late week 2 period.

Discussions, starting with the oldest  below.

December 13:  AO is solidly negative and favors cold being flushed from high latitudes to mid latitudes...........more than what model solutions/weather maps show. NAO is slightly negative and a small factor for dialing in extra cold in the East. PNA not a factor at near 0, after it had been anomalously positive recently and help push cold deeply into the South. 

By metmike - Dec. 13, 2020, 1:18 a.m.
Like Reply

National Weather Service 6-10 day, 8-14 day outlooks.

 Updated daily just after 2pm Central.


Temperature Probability


6 to 10 Day Outlook - Temperature Probability Precipitation Probability


  6 to 10 Day Outlook - Precipitation Probability


the 8-14 day outlooks
ArchivesAnalogsLines-Only FormatGIS Data

Temperature Probability

8 to 14 Day Outlook - Temperature Probability
8 to 14 Day Outlook - Precipitation Probability


By metmike - Dec. 13, 2020, 1:19 a.m.
Like Reply

The week 3 and week 4 CFS model  from the previous day


                             https://www.cpc.ncep.noaa.gov/products/people/mchen/CFSv2FCST/weekly/images/wk3.wk4_latest.NAsfcT.png       


By metmike - Dec. 13, 2020, 2:54 p.m.
Like Reply

Updating the Sunday weather stuff now!!

By metmike - Dec. 13, 2020, 7:07 p.m.
Like Reply


Image

By metmike - Dec. 13, 2020, 7:11 p.m.
Like Reply

@MassachusettsWx

RGEM is pretty dang impressive! Can’t wait till even more mesoscale models come in range!

Image

By metmike - Dec. 14, 2020, 3:01 p.m.
Like Reply

December 14 update:

—AO and slightly -NAO pose the threat for a much colder pattern later this month.

The GFS is not as cold as the European model and the disparity is tremendous, including the change from run to to run because of the huge temperature gradient.