With very low stocks of beans and corn and a drought over much of the West, extending across parts of the Plains into the Western Cornbelt, the upcoming growing season weather forecast is getting alot of attention.
Add in the fact that we have a La Nina(causing the drought) and you have the potential recipe of our first major drought since 2012...........this last one was caused by a La Nina from 2010/11 to the start of 2012.
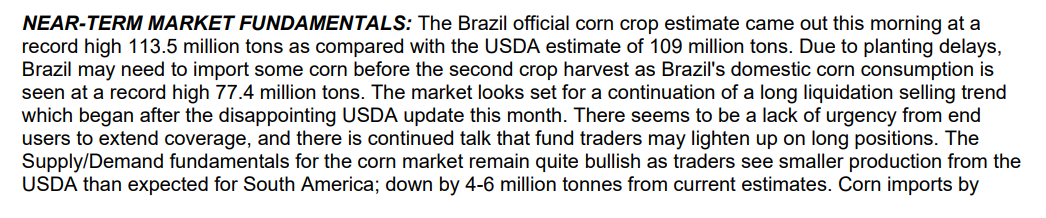
Here is the latest drought monitor. Pretty impressive:
https://droughtmonitor.unl.edu/Maps/CompareTwoWeeks.aspx
Soilmoisture anomaly:
These maps sometimes take a day to catch up to incorporate the latest data(the bottom map is only updated once a week).
https://www.cpc.ncep.noaa.gov/products/Soilmst_Monitoring/US/Soilmst/Soilmst.shtml#
![]()


Any expansion of this drought/dry soil eastward this growing season will potentially reduce yields.
This is the NWS long range forecast for May, June and July.........very warm(which means water needs will increase) and dry West to Plains to WCB with no strong odds east/Equal Chances. Pretty bullish really.
]
We should note the long range forecasts like this HAVE LOW SKILL!!
They are usually better than flipping a coin and in this case, with the La Nina and the drought already there, odds are maybe as good as 70% for it to verify.
Here is the latest on the La Nina:
As mentioned, the last major Cornbelt drought in 2012 was caused by a La Nina from late 2010 to early 2012. The previous major Midwest drought, way back in 1988 was caused by that la Nina.
You can see that with the blue shades below. Notice that we have had other La Nina's and no drought. Having a La Nina doesn't cause a drought ever time, it just greatly increases the chances of a drought and adverse weather(1974 was a disastrous year for crops).
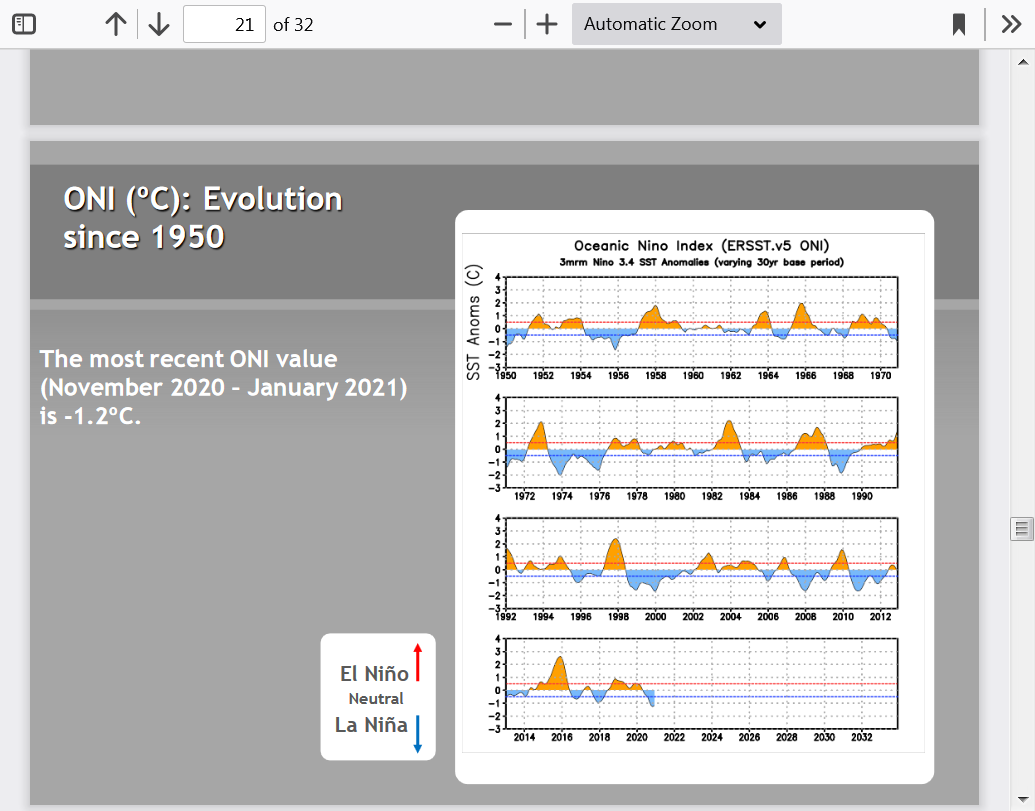
FYI: La Nina's cause global cooling. Global cooling patterns are usually much worse for crops in the US. Global warming is associated with more El Nino's. El Nino's warm the planet and are STRONGLY associated with favorable growing weather conditions in the US.
This is why the last 40 years of slight global warming and more El Nino's have featured the best growing weather conditions in US recorded history.
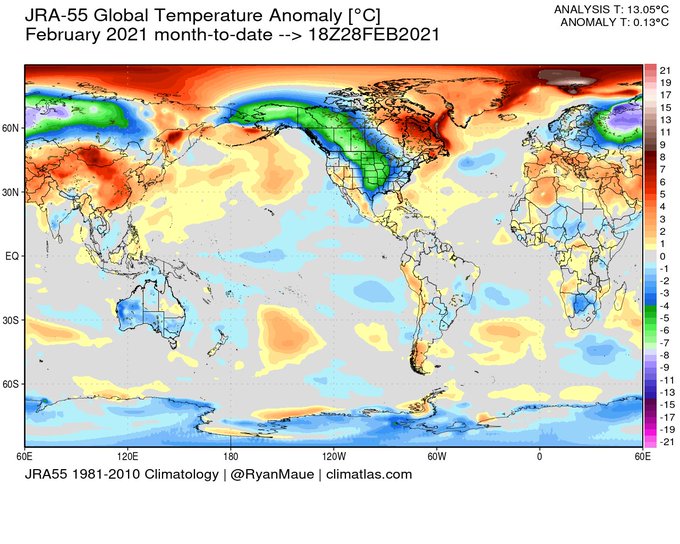
Yeah, I know. It's the complete opposite of what you've been told but that's the authentic science. If this drought spreads/intensifies, look for sources to make up an explanation tying it to climate change. Global temperatures have actually been cooling recently(just temporarily). Climate change that we hear about is all from the slight global warming. This can't be from climate change from global warming................when we are having global cooling and global warming can't cause the tropical Pacific Ocean water to cool off and make a La Nina..........which is a global cooling weather pattern:
https://www.marketforum.com/forum/topic/66308/#66311
Data for February 2021 complete from JRA55 reanalysis: Coolest February since 2014 -- and also coolest month (compared to climatology) since Feb 2014.
Back to the current La Nina:
This is what the cold water anomalies look like right now. Note the massive area of blue across the E/Central Equatorial Pacific on the maps below. That's our La Nina!
.png)
.png)
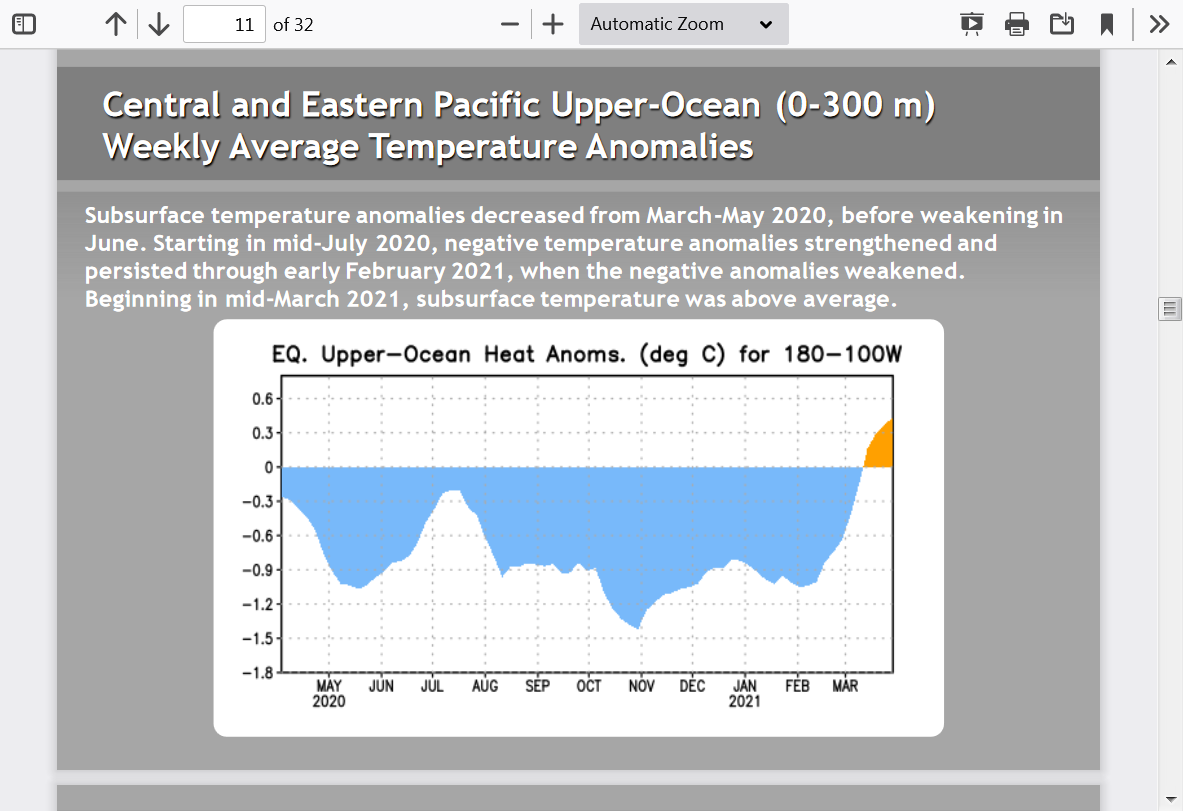
Subsurface temperatures have maintained cool anomalies in this key region this year, so this La Nina will still be around for at least a couple more months, even if it does start to fade.
.png)
The latest forecast has La Nina chances dropping a bit the next several months with potentially neutral conditions by the end of Spring on half the models, then, La Nina chances increase again late in the Summer.
FYI, last year, the La Nina forecast was for it to fade for good by the start of Spring 2021. Most updates have added more La Nina since then.
The chance of protective El Nino(warmer ocean) conditions by the end of Summer are very tiny right now.
.png)
Summary:
The chance of a major, widespread drought in the Midwest in recent decades has plunged to much less than 10% in any 1 growing season(less than 1 in 10), thanks in large part to climate change/beneficial global warming.....and more El Nino's.
In El Nino years, the chance of a widspread Cornbelt drought is something like 3%.....1 out of 30 years.
In 2021, we will NOT have that protection because the atmosphere is aligned with a modest global cooling pattern and we have a La Nina that will continue to affect the weather for at least the next few months.
In addition, this pattern has already dried out the soils from the West, to the Plains to the Western Cornbelt. This will make weather system tracking over those areas less productive at making rains, enhancing additional drying and expanding it eastward becomes more likely, all things equal.
The technology does not exist to have confidence in a forecast for 3 months from now, but there is a 70% chance of it being drier than average and the drought expanding in the Plains/Western Cornbelt just based on the conditions described above.
I usually avoid long range forecasting and prefer using tools that give us reasonable skill at providing people with useful weather information.............except in unique situations, like this one.
I will mention the year 2000, also during a La Nina that was similar to this one, on the next page to show you what can happen............go wrong.
We ended the 1999 growing season very dry from a robust La Nina and that continued all Winter into the early Spring. Here is what the soil moisture looked like below.
Note how widespread the severe drought was across the central Cornbelt by mid April.
Corn and bean prices were soaring higher, thru April, adding tons of risk premium because the drought was spreading and the La Nina continued............with the NWS actually coming out with an unprecedented alert, warning of the likelyhood of widespread, severe drought.


The very dry early Spring, allowed crops to get planted in record time..............but the market was concerned that those crops would not get enough moisture and prices kept going higher. ....into early May 2000.
Suddenly, in early May, a huge rainmaker surprised the market and resulted in a big sell off. Then another weather system and another and another.
The market went straight down from early May into early July.
This is what the drought monitor looked like in mid August. Only NE to far w. IA had drought left in the Cornbelt.
The drought had shifted much farther south by then. ...to the southern states.

We still had a drought causing La Nina weather pattern in the Summer of 2000 but the downstream affects of the La Nina, because of other atmospheric features, were shifted farther south.
There are always several factors that play into the location, strength and spacing of large scale weather features.
Conditions might be perfect for a drought, just downstream of a La Nina, in the US because of the cooler water in the tropical Pacific but exactly where the rain suppressing dynamics will be aimed is always very uncertain.
A severe drought is likely in a large part of the US this growing season because of the La Nina. I would actually be suprised if we don't have severe drought in numerous states.
But it could be like 2000 and shift farther south.
Or it could be like 2012 and shift INTO the Midwest.
Hey, lets take a look at that drought next!
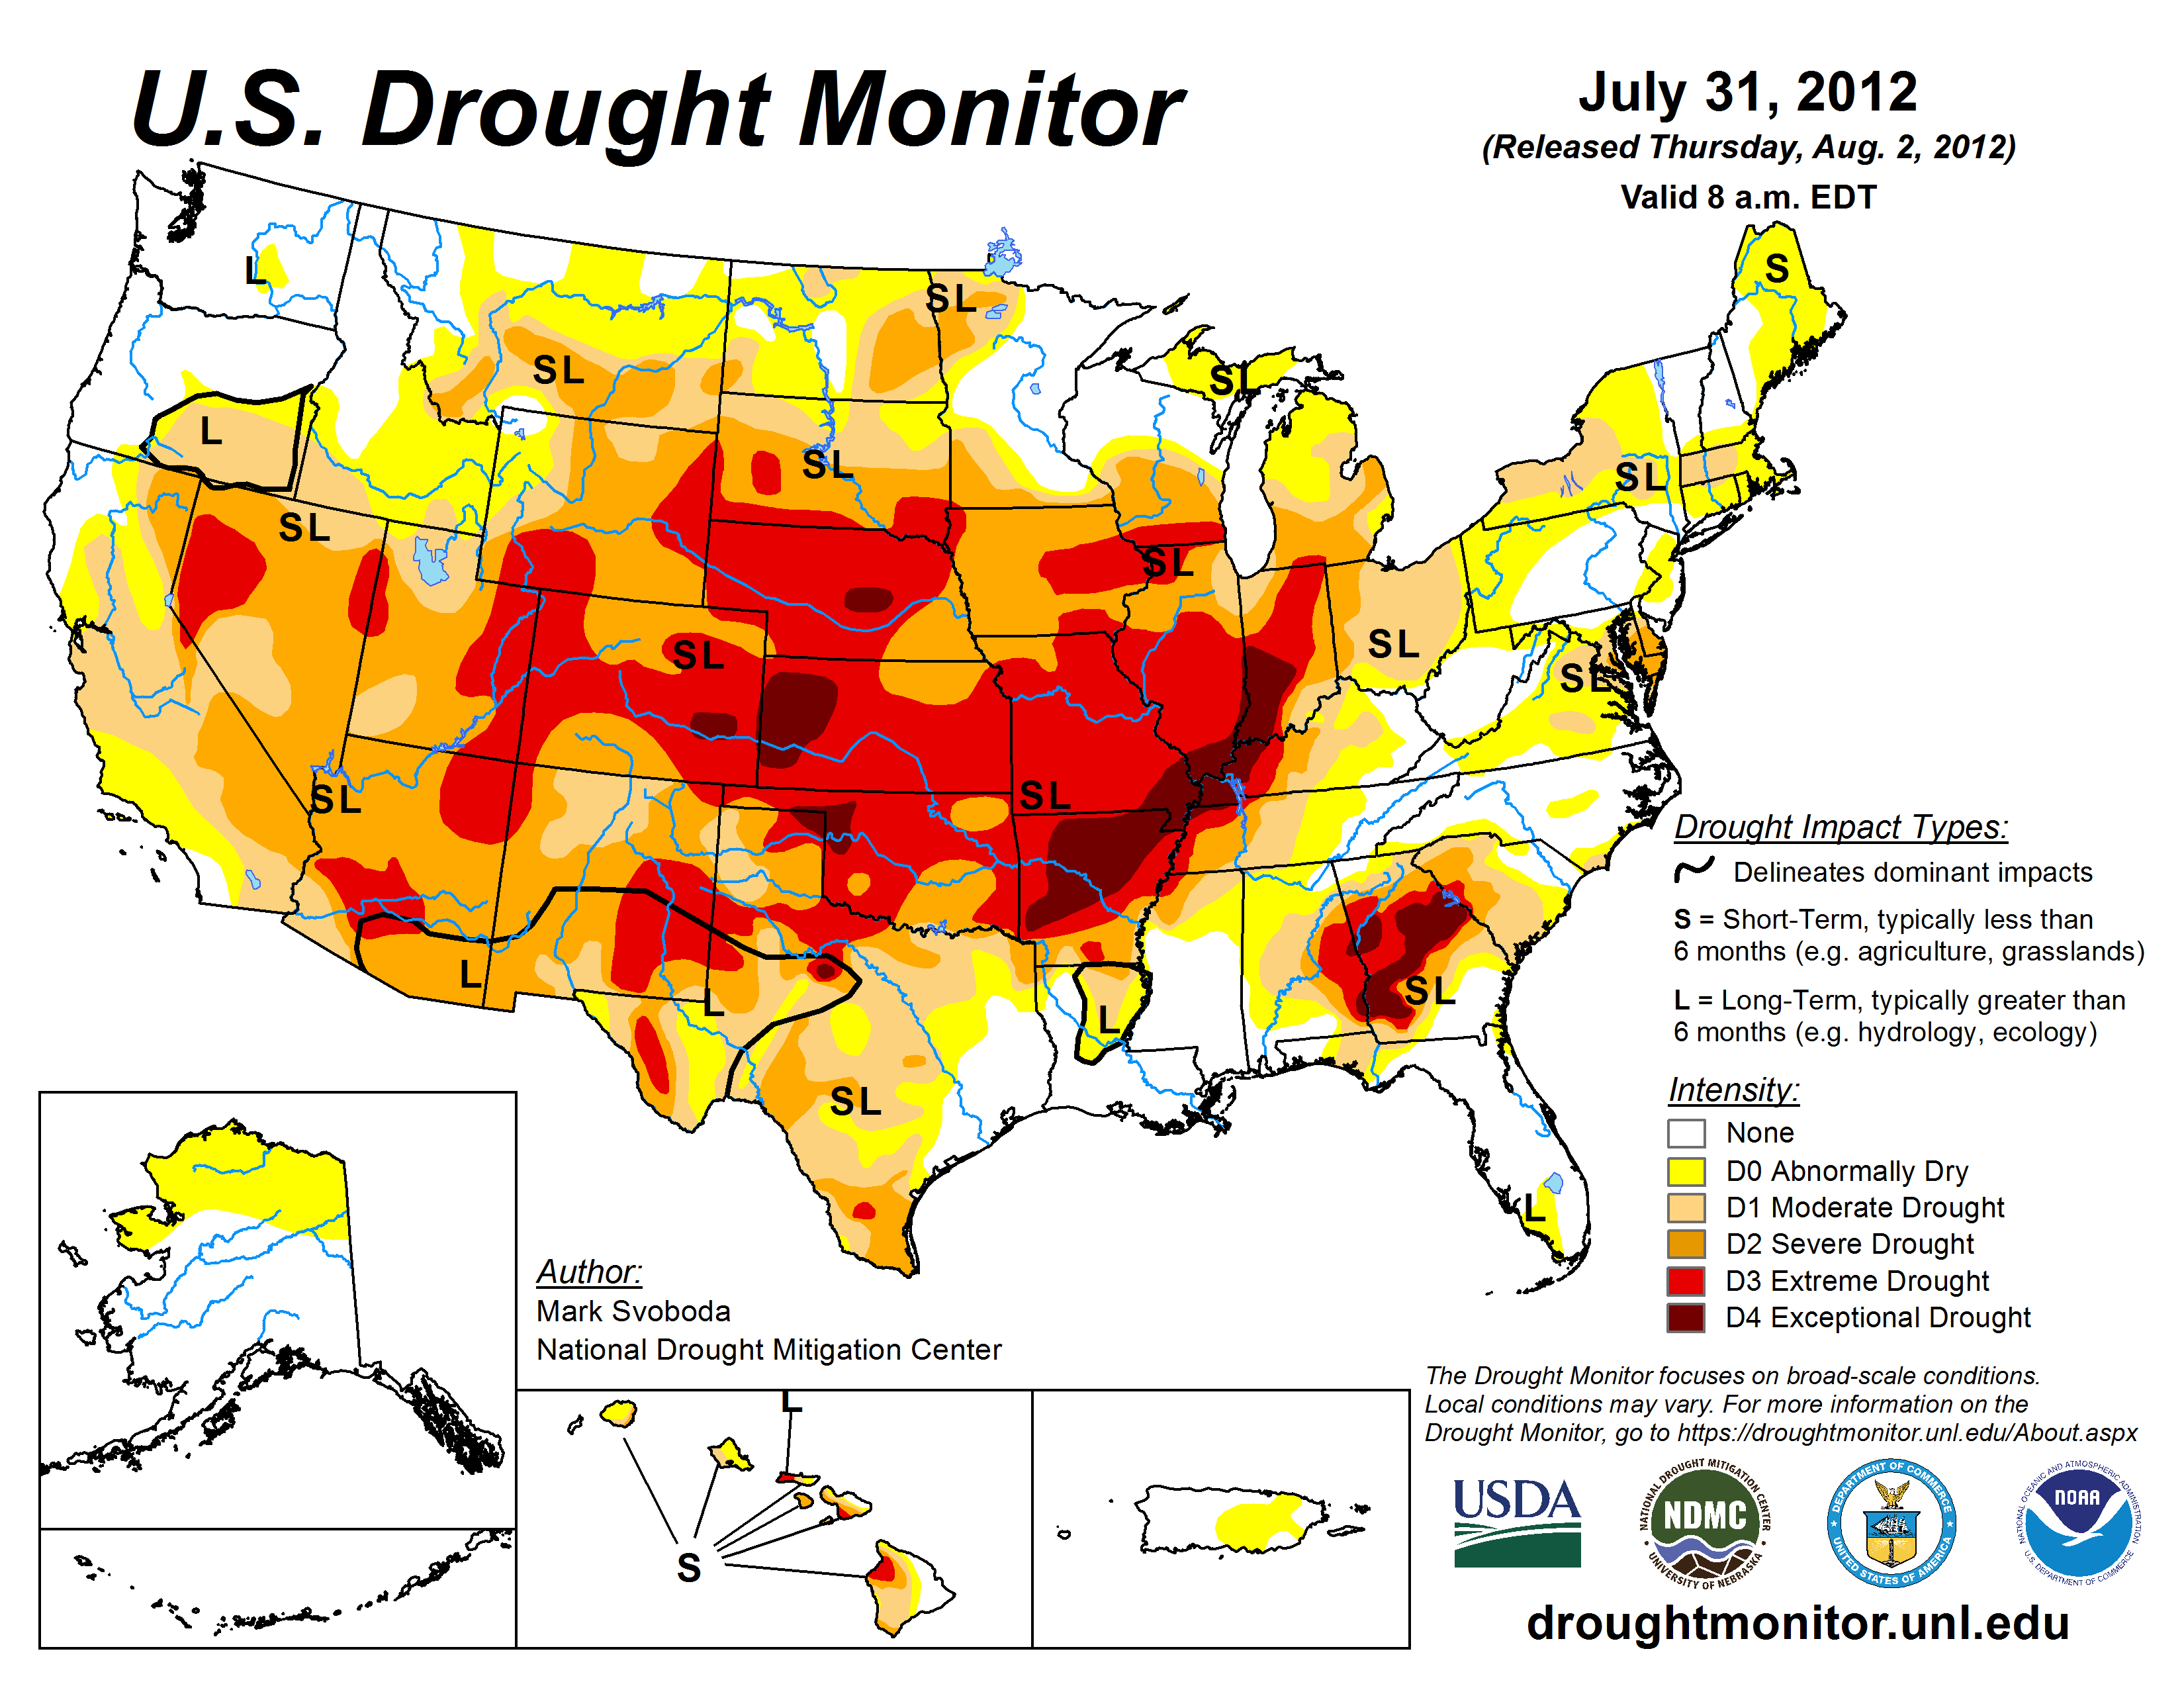
The drought of 2012 was born on the La Nina of 2010/11 that continued into the first half of 2012.
Drought early in 2012 was mainly in the Upper Midwest, with the S.Plains having severe drought that had persisted for 2 years from the La Nina.

By early May 2012, though it was dry in several locations, it was not too severe.
Then, like somebody flipped a switch, it turned mega hot and dry in May 2012....and stayed that way for over 2 months across the entire Midwest. Watch the incredible spread of drought and increase in intensity in just 2 months below.


A couple of things, just for some interesting information
That last drought map for 2012 was bang on for the area just below the Great lakes. I don't know about other places
I estimated the red came within 50 miles of Detroit as I travelled to Aldura, Ohio for a stock car race we had a car entered, for competition. I walked the fields as we waited for the night races to start and the drought had corn in my estimation at 50 BPA. At home within the shelter of the Great Lakes we had normal weather and profited by selling 7.00 plus corn that yr. Many did not have a crop to sell at high prices. Such is the risk of farming. The 1988 drought did affect my farm with a drop of 50 BPA compared to expected yield. I forget the price. I remember those yrs well
I can also agree with MM that a crop failure is very rare or has been very rare in the past 30-40 yrs.
Especially with increased C02 and new varieties the expected yield keeps creeping up
This yr may be a drought, NOW but a couple good raains and then just enough would give us at least an average to good crop
So we can't take a drought as a given although my expectation is to see at least some drought this coming yr. I know the odds of heads or tails are mathematically even every flip, you have to consider we are due for at least some crop failure some time in the near future. Is this the yr. I don't know but would bet this is the yr.
Until we get that drought busting rain I will wait. I have sold on the back side of a down market and the result isn't all that bad, so long as you act quickly. Trust me I have seen a lot of weather markets most of which gave a pop to price and then fizzelled out before harvest
That is when I sell on the back side, which is equal to selling on the front and better than selling too soon.
Of coarse limit down is bad
Let me give the forum some info that hasn't had wide spread coverage in the Ag sector
Brazil is getting some serious flooding with some few million acres that will not be harvested. Cattle are being moved to higher ground, corn planters sit in flooded fields. This is in the high producing areas of Brazil. Mean while Argentina is still in drought conditions. Now we all know that some where in the middle the conditions are good for crops assuming the area is suitable for row crops
An agronomist in Brazil is telling us that SA will not produce a bumper crop and the chances of a good second Safrina crop of corn are dwindling with delayed planting due to flooding
I know the loss of 50 million bu of beans will not be a total disaster, given total estimated production but with low ending stks in NA any yield reduction this yr counts for more than yrs when stks are plentiful
To nites price action means some body is watching the weather and harvest progress, with some price premium
The next 10-14 days might be drier in Brazil and harvest might resume in some places, currently flooded. However, I am not a weather person so please, on the 10-14 day, do not take my weather estimates seriously
Also some crops are most likely still developing as Brazil is a big place and too much water can harm plant growth
Just a note of caution re: estimated crop production for SA
Thanks Wayne!
Nice precip on the way for some dry US areas may be pressuring prices:
Many thanks Mike
YW cutworm!
Thanks Jim!
Long range/growing season from Eric Snodgrass:
We increasingly will be trading US weather NOW!
After the release of the USDA planting intentions report this on Wednesday.
https://www.marketforum.com/forum/topic/67276/
Good weather for early corn planting! Enough rain in the forecast so the drought scare will not ramp up.


giddyap! :)
La Nina coming to an end? The blue waters below, to the west of Central America, in the central and eastern tropical Pacific are the La Nina
.png)
The area of subsurface cold anomalies has completely vanished in the C/E tropical Pacific(source for more surface cold anomalies). We could morph out of this La Nina soon and should be ENSO neutral for the upcoming growing season.
The models have us quickly into neutral territory. ....gray shaded bars below......but increase chances of La Nina again later this year.
.png)
https://wattsupwiththat.com/2021/04/07/la-nina-is-collapsing/
Crop moisture is non existent in ND, even in the top 2 inches, there isn't enough to germinate the Spring wheat crop(but its very early and there is tons of time for rains to pick up).
https://www.drought.gov/topics/soil-moisture
.png)
The 2nd map is very revealing. This is the soil moisture in the top 39 inches(1 meter). Wow! Look at the massive area of dark red, which means being in the top 2% of the driest in the data base across the entire Eastern Cornbelt. Also seriously dry subsoils in some places in the Central Cornbelt. ND is the worst. Might be close to the driest since the Dust Bowl for them for this time of year. Early April is when soils are often close to being the wettest of the year for most places.
If you cant's catch up with rains to recharge soil moisture in April and May, after that evaporation usually exceeds rainfall in June and gets worse in July/August.
What's interesting, is that the drought monitor is not picking up on this very well but its clear that any sort of rainfall deficits will quickly become serious because subsoil moisture is extremely low and the water table in all these locations is way down below where it usually is at this time of year.
Jim made an outstanding observation out on the golf course earlier today using great observation skills.
.png)
Drought monitor does not look as dry as it really is when considering the entire soil profile as we did above. The first map below is last week, the 2nd map is this week. Must be that the maps below don't consider levels of subsurface moisture that go as deep as the maps on the previous page. There is a huge disparity for sure.
https://droughtmonitor.unl.edu/Maps/CompareTwoWeeks.aspx

Thanks Mike. I’m centered in that red area of NW Iowa on the last map. Very dry last fall and winter.
Lots of fish kill on the lakes due to no fresh water running in, eagles in every tree. My three ponds have been dry since September.
The last week has seen us get three nice soaking rains and some of the first tile is running. My ponds are now covered with maybe 6 inches of water, they will normally have 3-4 feet.
We always raise better crops in a drier year if we have enough moisture to get it out of the ground, which it looks like we will.
My oats and alfalfa will be showing this weekend, planted last Sunday.
Great report mcfarmer!
Timely rains will be the key this year as it looks like early planting is very likely.
The just released week 3-4 outlook is not promising for much relief.


+++++++++++++++++++++++++++++++++++++++++++++++++++
The next 2 months, historically offer the best chance to catch up and replenish soil moisture. The reason is that evaporation rates will soon exceed rainfall. On top of that, evapotranspiration from plants will suck even more moisture from the soil/create much higher demands.
In the graph below, the pan evaporation is how much water would evaporate off of a water surface(soils covered in water) per day. Evapotranspiration is how much is coming from plants. In reality, the actual rate for pan evaporation will NOT be nearly as great as the pan evaporation rate...maybe just 30%, but can vary from less than 10% in dry soil to 100% with standing water. You can see though, that it nearly doubles from now to July entirely because of warmer temperatures and the higher sun angle. I'm guessing their graph is for a shaded area because the rate in full sun should be much greater than what they show in this graph.
Evapotranspiration in a corn field right now is exactly ZERO! The plant has to emerge and start sucking moisture out of the soil. That peaks in July during pollination.
The 2 will add up and peak in July. If you already have a moisture deficit in the soil going into this high demand period, the extra needed moisture must come from rains.
https://lib.dr.iastate.edu/cgi/viewcontent.cgi?article=1085&context=specialreports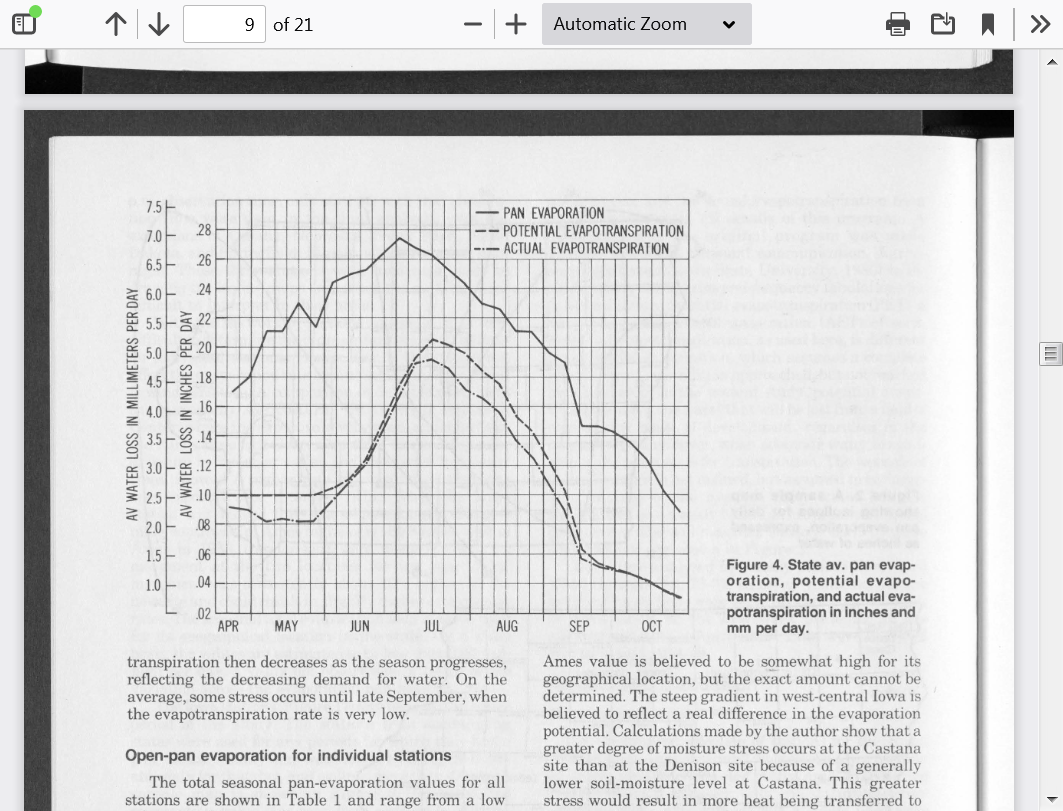
Here another interesting map. ND and Eastern Cornbelt, as we already know are pretty dry. This weeks great rains in the Central Cornbelt restored some nice moisture measuring metrics.
Guess what will happen if we don't have much rain for the next month?
https://waterdata.usgs.gov/nwis/rt

| The colored dots on this map depict streamflow conditions as a percentile, which is computed from the period of record for the current day of the year. Only stations with at least 30 years of record are used. The gray circles indicate other stations that were not ranked in percentiles either because they have fewer than 30 years of record or because they report parameters other than streamflow. Some stations, for example, measure stage only. | |||||||||||||||||||
If we dry out for the next several weeks, planting will proceed fast(the cold weather coming up will slow it down a bit temporarily).
That should be offset by concerns that its too dry shortly.
Where will the moisture come from this Summer if the soils are dry to start off with, let's say in late May with much of the crop planted early?
It must ALL come from rains, meaning there is no room for dry periods without them hurting the crops/causing stress.
However, early planting will promote quick germination and establishment with larger/deep roots.
Deeper, bigger root systems have access to more moisture because they cover a greater area but they also have access to more minerals and other elements in the soil for the same reason..............so plants will grow bigger/better.
But this year, many areas have very low deep moisture and the water table is incredibly low in those spots.
Roots from crops in those areas may not be able to tap into deep subsoil moisture..........if it's deeper than where roots can go.
The additional CO2, by itself is adding greatly to yields. A rule of thumb is that for each 5 parts per million of additional CO2, plants see an increase in growth of around 1%.
CO2 has increased from 280 ppm to 415 ppm or +135 ppm. This adds 27% to the rate of growth and size of plants, on average. However, woody stemmed plants benefit the most, like trees. The increase for them is closer to 50%.
Also, C3 plants like soybeans and rice use a pathway for CO2 that allows them to benefit much more than C4 plants like corn.
All plants do better in droughts with higher CO2. Plants have stomata on the underside of their leaves that open to allow CO2 in during respiration that is used as part of the process to manufacture food/sugars. Open stomata also causes evapotranspiration, which is water being lost from the plant to the outside air. The higher the CO2, the less wide and less amount of time the plant needs to open their stomata and the less moisture is lost to the environment.
So increasing CO2 allows plants to be more water efficient and drought tolerant. Crops did much better in the last major MIdwest drought of 2012 compared to the previous major drought of 1988, not just because of better genetics but because of the higher CO2. The time between the 2 major droughts, was the longest ever in recorded history because of the benefits of global warming/climate change, including more El Ninos(warmer tropical Pacific).
Here's more on that irrefutable law/truth:
https://www.marketforum.com/forum/topic/62784/#62797