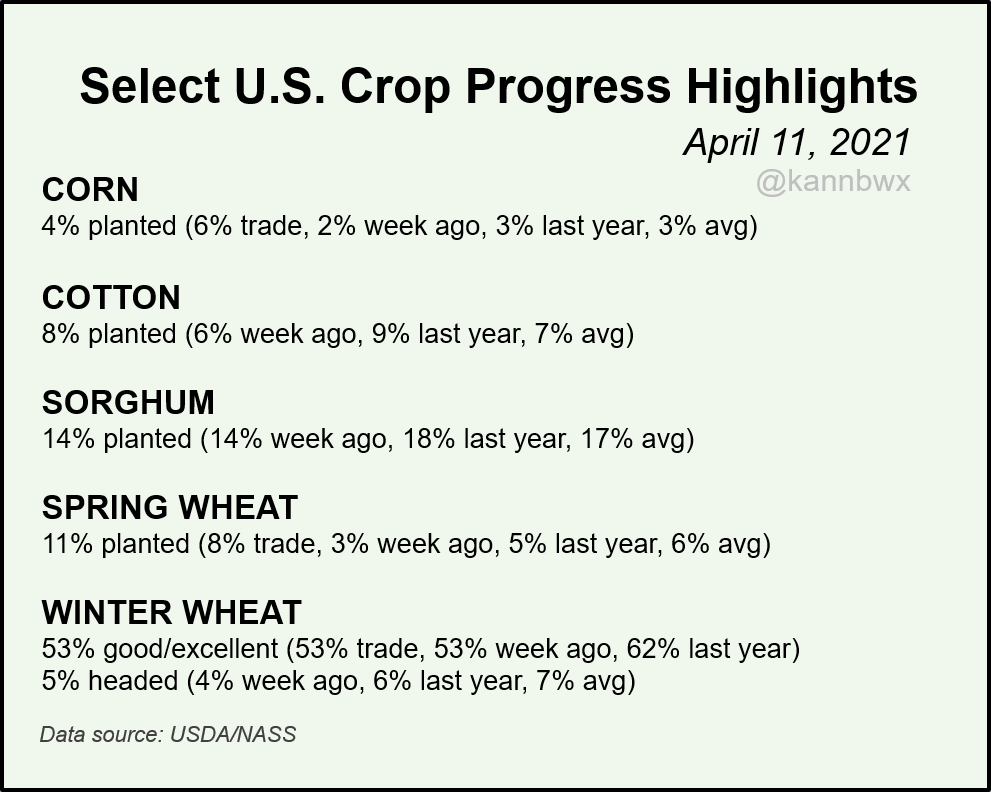
Spring #wheat planting is particularly fast in South Dakota and Washington. SD was 30% planted vs 14% avg and Wash was 50% vs 32% avg. North Dakota, the top spring wheat state, was 8% planted versus 2% avg, and Montana was 6% vs 5% avg.
Looking at ND corn and wheat yields, results were good in 2015 and 2008 despite the dry fall-winter leading up. The 1988 crops were terrible (4th driest Sep-Mar), as were the 1980 ones (9th driest). Hard to compare crop outcomes from so long ago tho - so many different factors.
+++++++++++++++++++++++++++++++++++++++++++++++++++++++++++++
Replying to
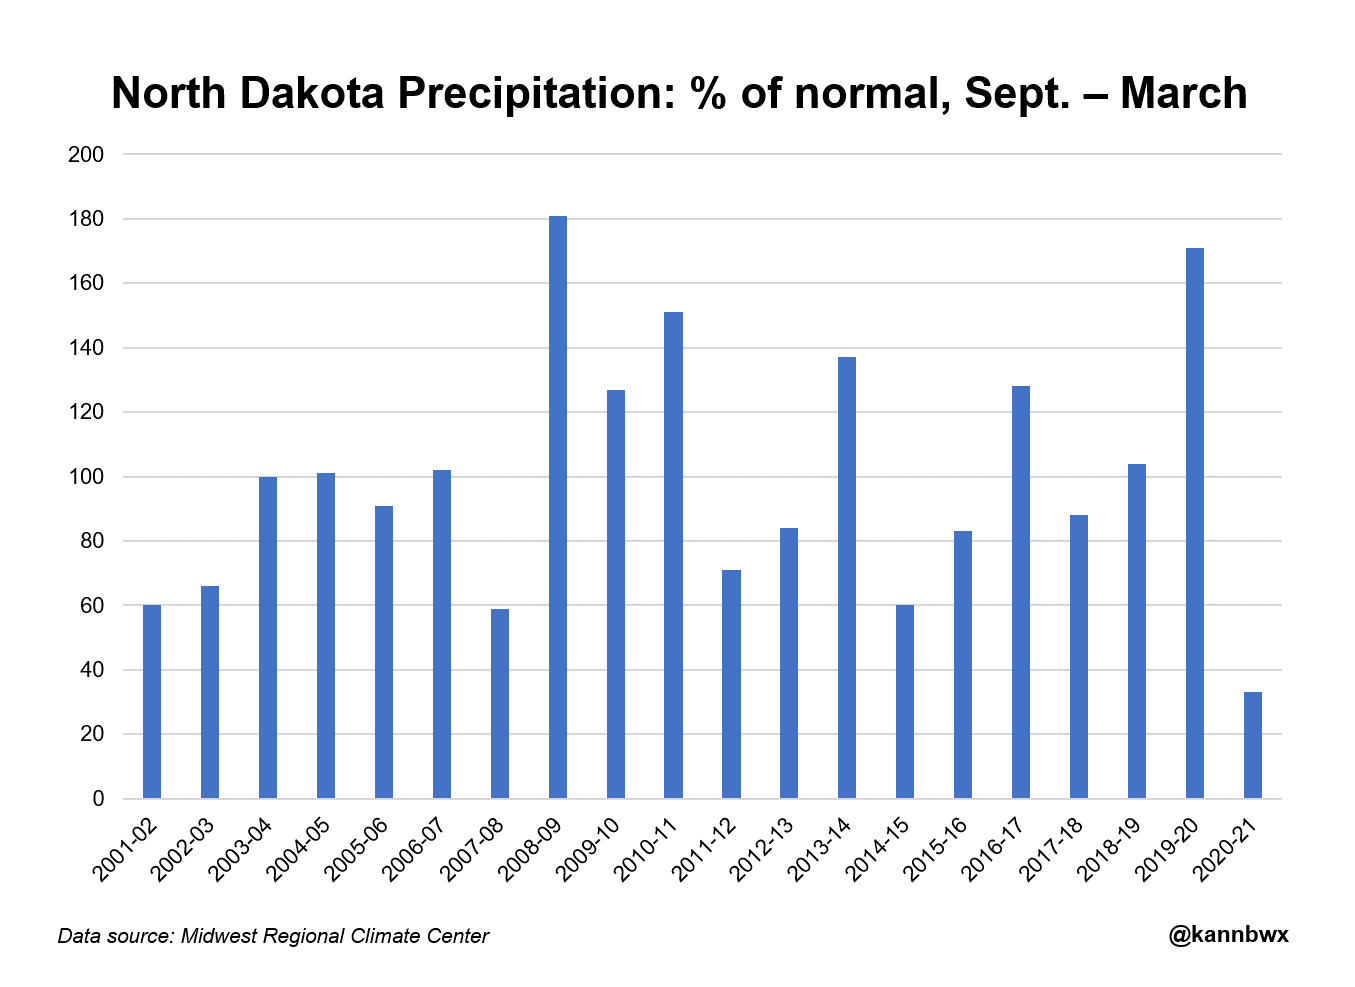
Here's ND % of normal precip Sept-March versus the last 20 years. Last year it was the 2nd wettest stretch on record and that disrupted 2020 planting. Sep-Mar 2014/15 & 2007/08 were among the driest on record for ND, but 2020/21 is much more severe. There's no comparable years.
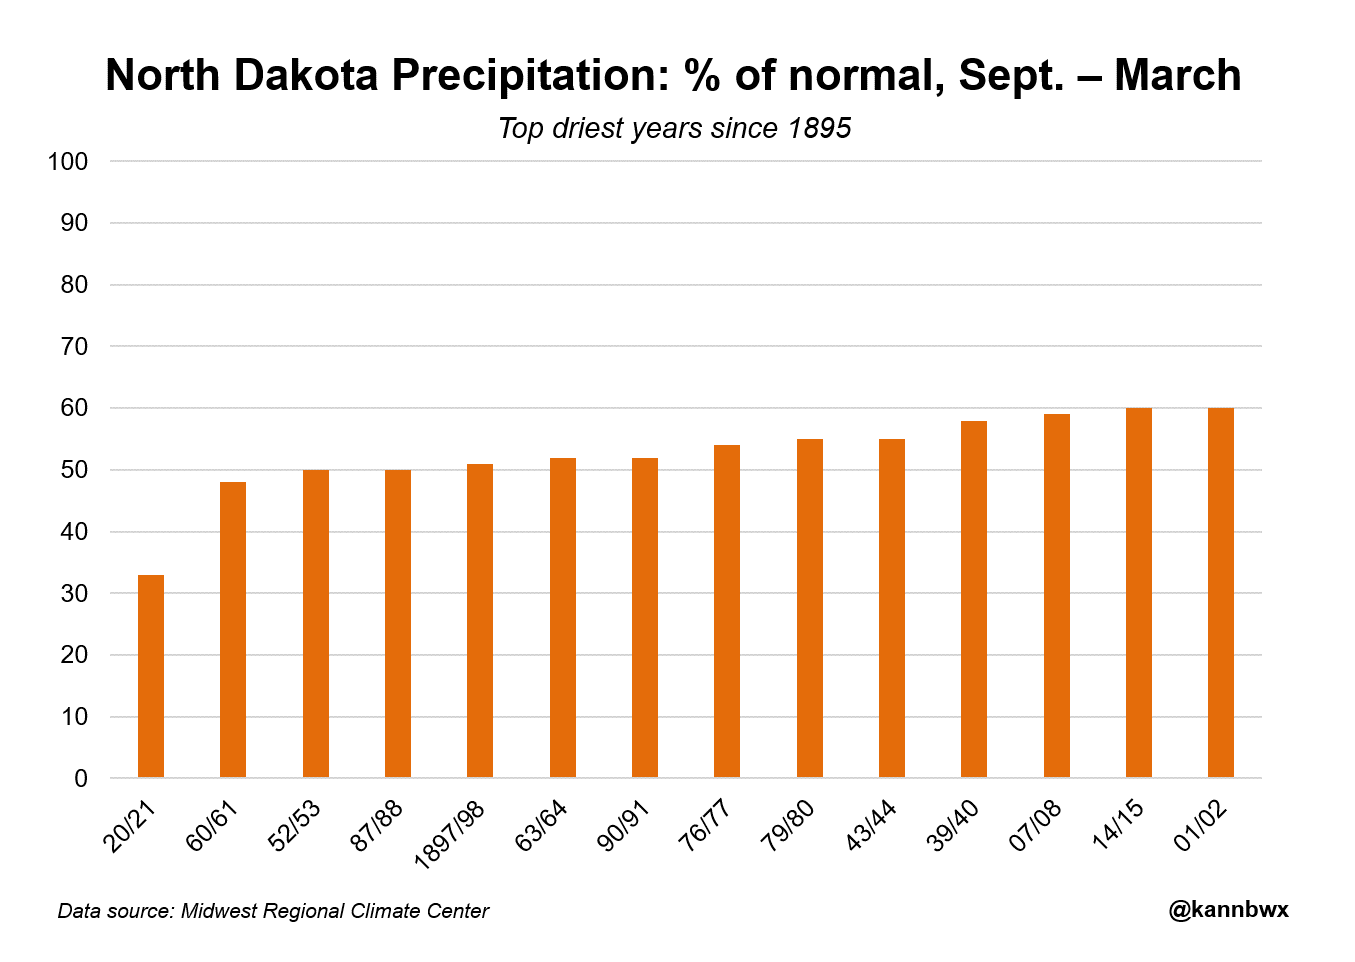
The dryness over the past 7 months in North Dakota is nothing short of exceptional. Sep-March 2020-21 precipitation was 33% of normal. The second driest year was 48%. ND is seen planting 7% of all U.S. crop acres this year, the third most after Kansas and Iowa.
https://www.marketforum.com/forum/topic/66372/#67638
Crop moisture is non existent in ND, even in the top 2 inches, there isn't enough to germinate the Spring wheat crop(but its very early and there is tons of time for rains to pick up).
https://www.drought.gov/topics/soil-moisture
.png)
The 2nd map is very revealing. This is the soil moisture in the top 39 inches(1 meter). Wow! Look at the massive area of dark red, which means being in the top 2% of the driest in the data base across the entire Eastern Cornbelt. Also seriously dry subsoils in some places in the Central Cornbelt. ND is the worst. Might be close to the driest since the Dust Bowl for them for this time of year. Early April is when soils are often close to being the wettest of the year for most places.
If you cant's catch up with rains to recharge soil moisture in April and May, after that evaporation usually exceeds rainfall in June and gets worse in July/August.
What's interesting, is that the drought monitor is not picking up on this very well but its clear that any sort of rainfall deficits will quickly become serious because subsoil moisture is extremely low and the water table in all these locations is way down below where it usually is at this time of year.
Jim made an outstanding observation out on the golf course earlier today using great observation skills.
.png)
Some short term snow/rains..............then turning dry again:
| lick below for information about how to read 6-10 day outlook maps Temperature Precipitation | |||||||||
| Click below for archives of past outlooks (data & graphics), historical analogs to todays forecast, and other formats of the 6-10 day outlooks ArchivesAnalogsLines-Only FormatGIS Data | |||||||||
Temperature Probability | |||||||||
Precipitation Probability | |||||||||