Saw a map of world temps in the northern Hemisphere
Looked like most of the world had red
Seems the entire world is having a heat wave
Lots of places where crops are grown
Wonder if world supplies of grain will be affected with record temps
They listed maybe a dozen places at least with record temps
Wayne,
I would like to see that map in order to comment.
The map below shows the temperature anomalies currently in the northern hemisphere.
Yellows in July are pretty dang hot because July is the hottest month of the year.
The US is having the largest widespread heat anamoly right now.........which extends into Southeast Canada, where you are.
There are a couple of other places with impressive(greater extreme) anamolies that don't cover as much area. There are also some blues(less than yellow).
The map below seems to contradict the map you saw as far as the scale of heat in the northern hemisphere but I need to see your map to know.
You can make a map look hotter or colder just by shifting the color scheme.
NCEP Ensemble t = 000 hour forecast 
And you can sensationalize record heat and spin it to sound like its much worse........as if records were never broken before.
It's very true and obvious that global warming is going to cause more heat records. During the hottest month of the year, July there will be some that are the hottest ever.
Record heat is nothing new though. The hottest Summers in the US, by a wide margin were during the 1930's Dust Bowl era. That decade, had far hotter Summers than anything we've had in recent years(that has featured the best 40 years of weather/climate for life in the last 1,000 years-since the last time it was this warm)

Maybe this could have been the source of your info:

Man, that heat does make it look like the planet is burning up!
So how hot are we actually, compared to the 30 year average(how fast are temperatures rising)
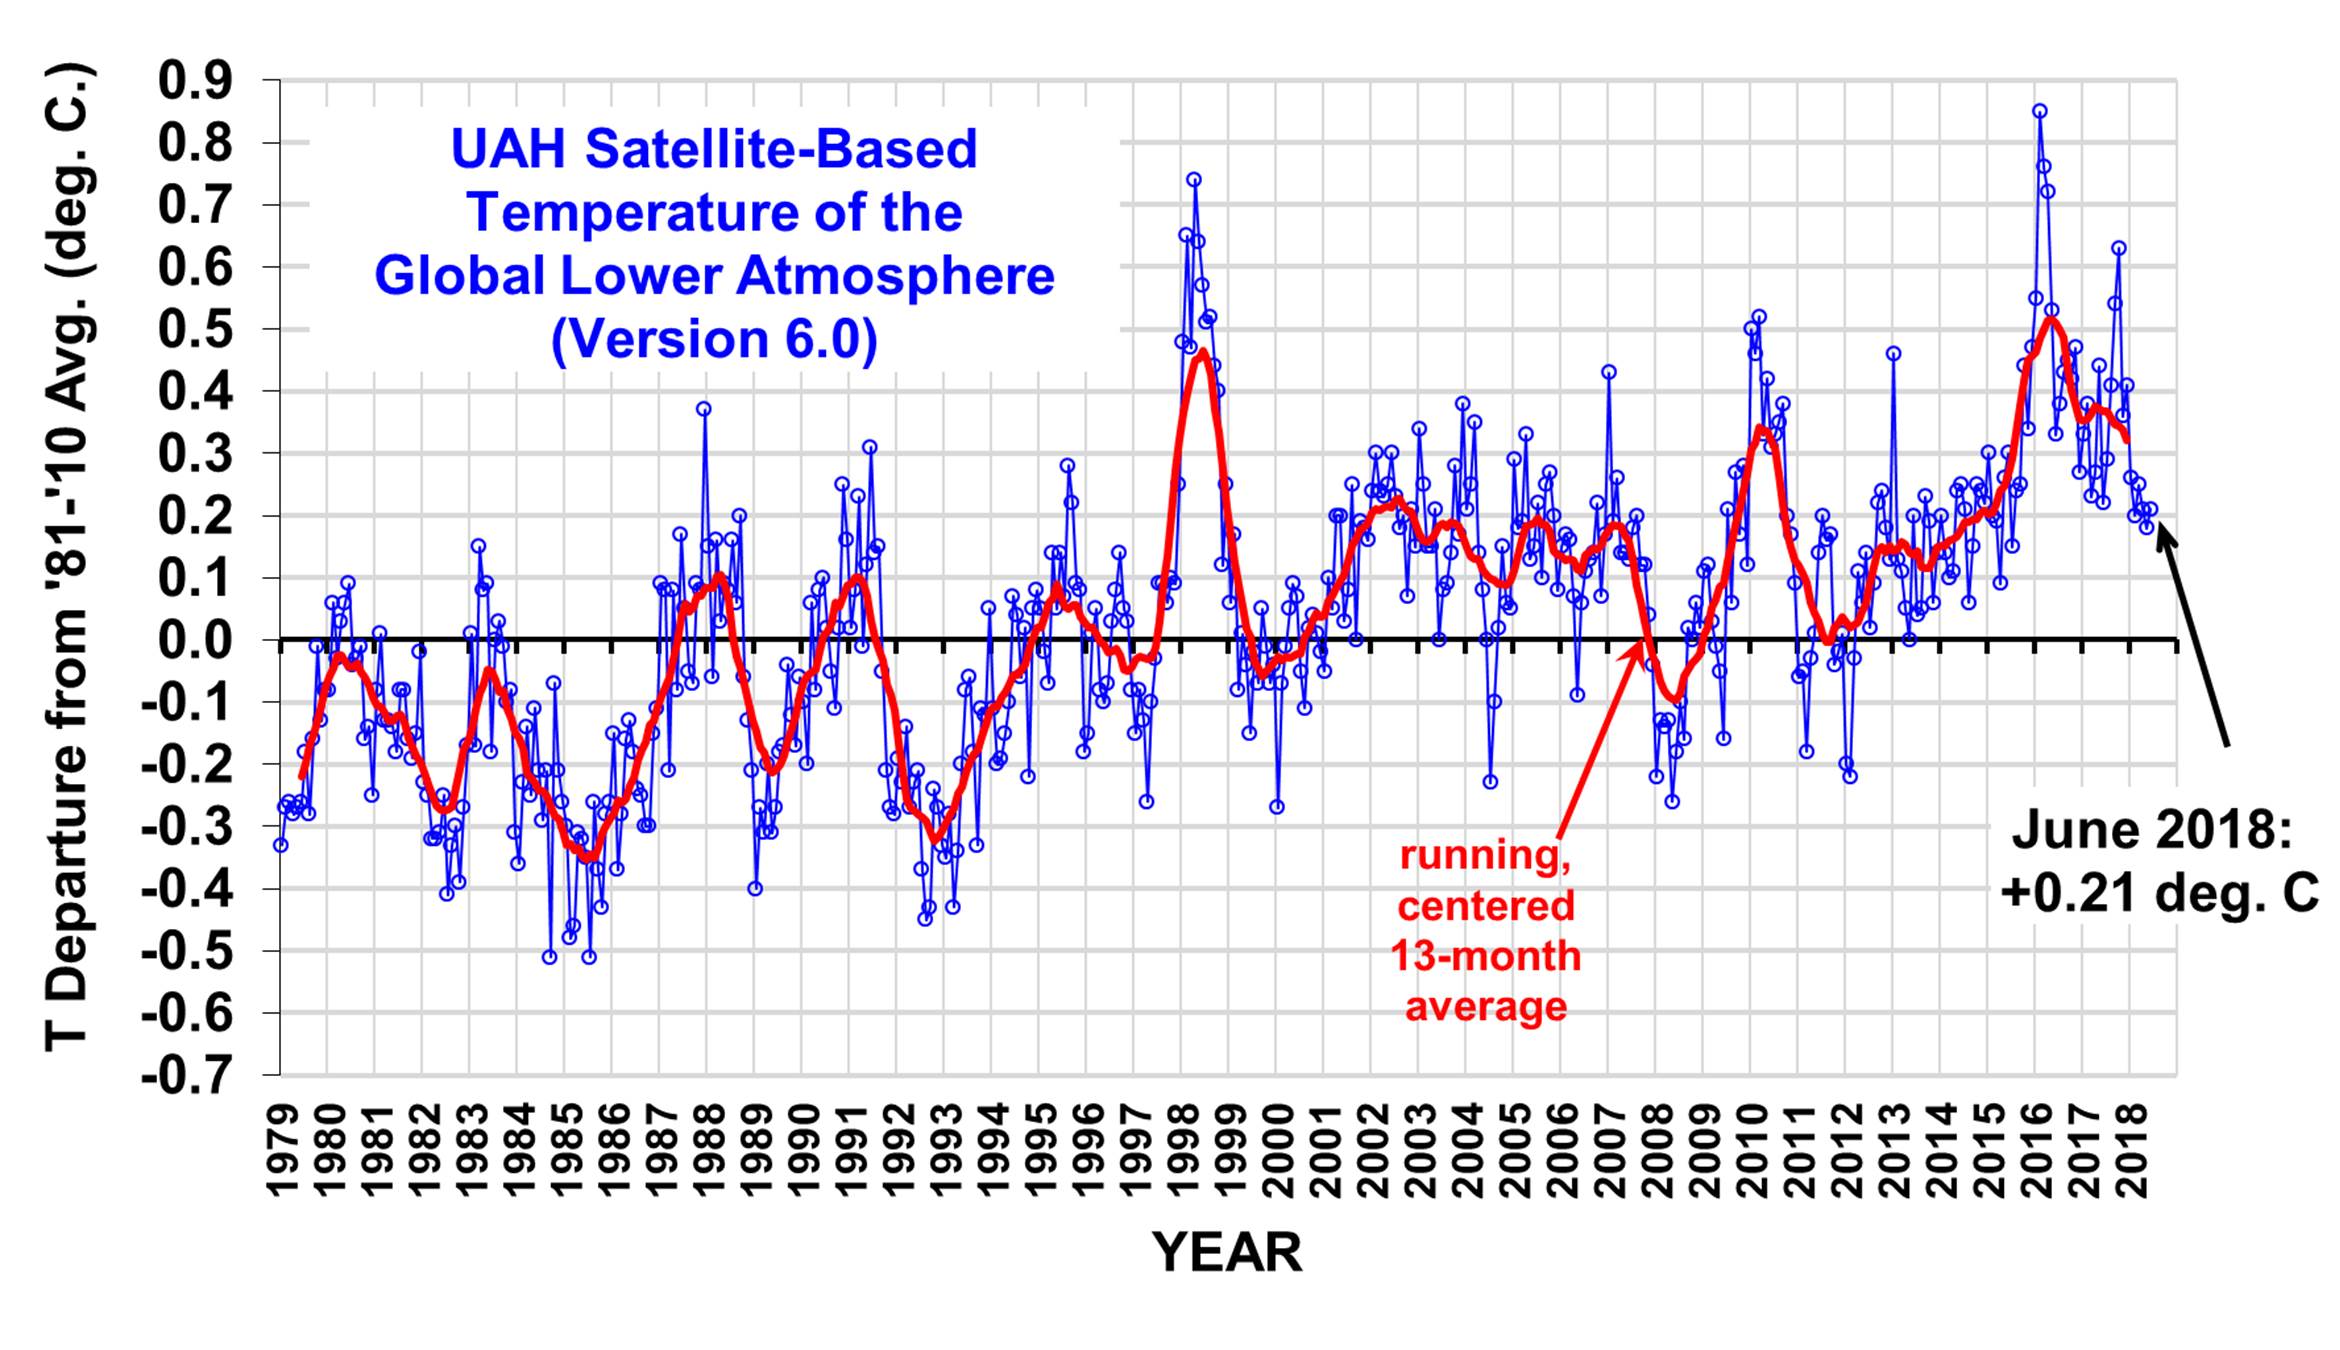
June 2018, the temperature was +0.21 Deg C above the 30 year average.
Not 21 degrees, not even 2.1 degrees but 0.21 degrees. Do you think that if you went outside that you could tell that it's 0.21 degrees warmer than yesterday or 20 years ago?
So far, that warming has been mostly beneficial. Of course in the hottest months/times of the year, in most places, its not beneficial. This is the hottest time of year and the best time for sources to hype the heat. It's real and it slightly worse than before but.......they also forget to tell you that the increase in CO2 and climate change have contributed to 25% of the increase in world food production.
Let's just turn back the clock 150 years, before we used fossil fuels and drop the temperature back down 1 Deg. C to where it was and CO2 back down to where it was around 300 parts per million...........but keep 7.5 billion people on the planet.
Within a few years, 1 billion people would starve to death and food prices would triple. Beans would be in the 20's and corn would be in the teens because your yields would plunge.
How can we know that?
We can just speculate on how bad it would get but the law of photosynthesis is irrefutable:
Pick the name of the plant and look at how the (hundreds of) studies conducted for that plant show how enriching the CO2 cause it to grow much faster.
http://www.co2science..org/data/plant_growth/dry/dry_subject.php
| |