Advertised pattern change has started. Heat ridge backs up, rains in the water soaked central belt get skinnier and Cornbelt drying out commences after this last wave of rains comes thru....though not completely dry everywhere.
Forecast for rains below:
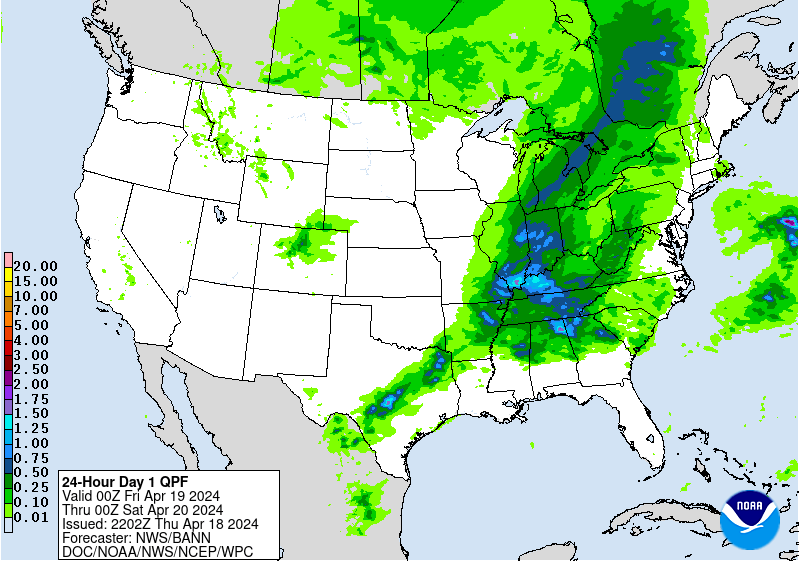
Day 1:
http://www.wpc.ncep.noaa.gov/qpf/fill_94qwbg.gif?1526306199054
 |
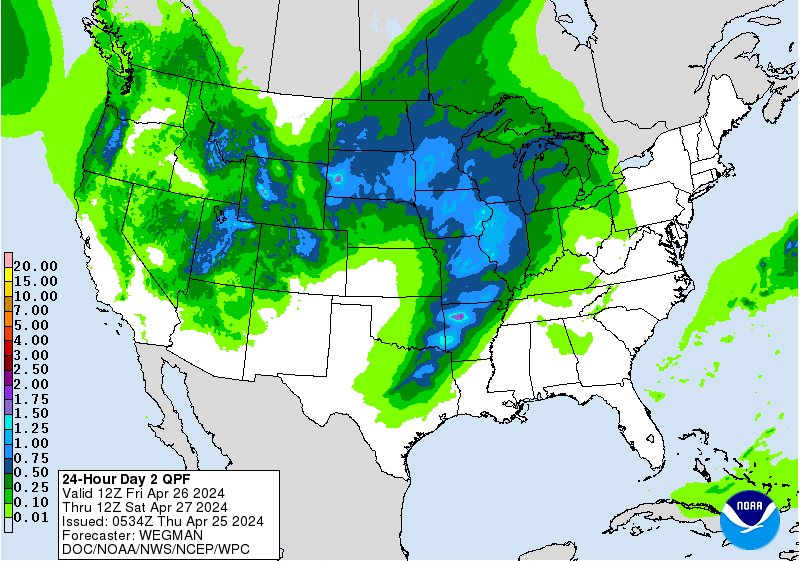
Day 2:
http://www.wpc.ncep.noaa.gov/qpf/fill_98qwbg.gif?1528293750112
 |
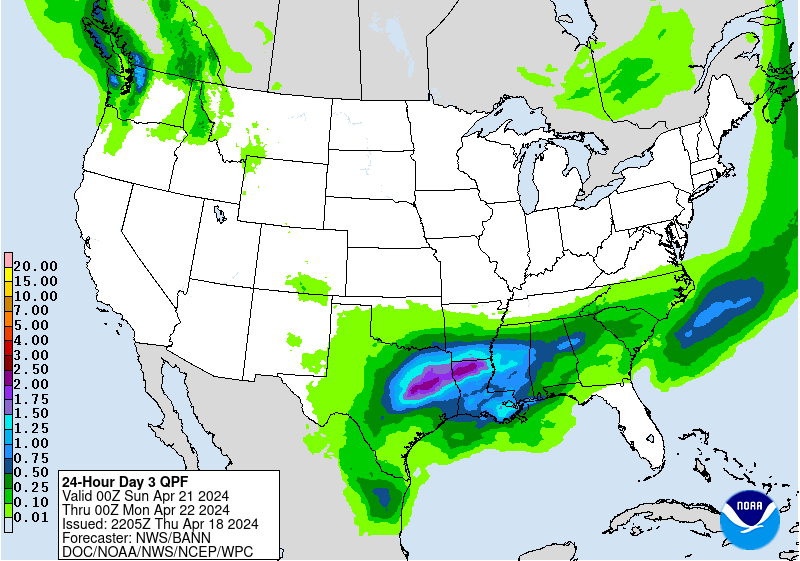
Day 3:
http://www.wpc.ncep.noaa.gov/qpf/fill_99qwbg.gif?1528293842764
 |
Days 4-5:
http://www.wpc.ncep.noaa.gov/qpf/95ep48iwbg_fill.gif?1526306162
Days 6-7:
http://www.wpc.ncep.noaa.gov/qpf/97ep48iwbg_fill.gif?1526306162
Days 4-5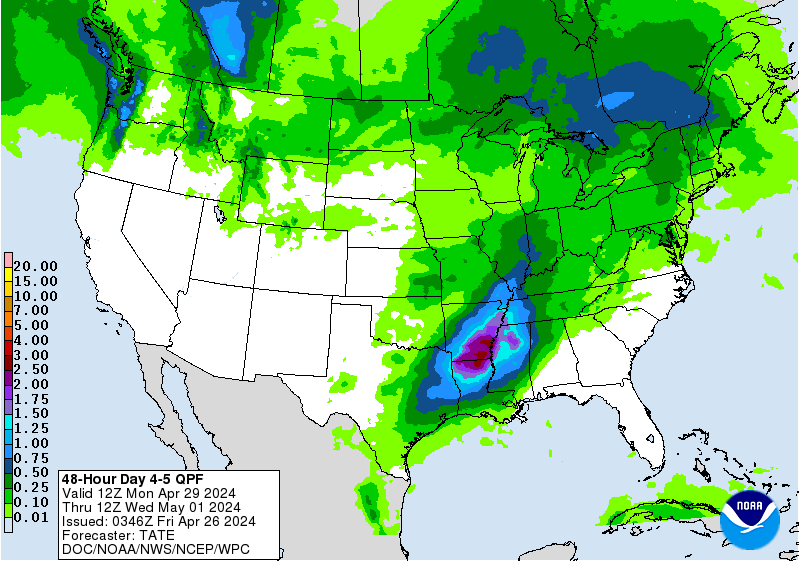 Valid 12z 07/06/18 - 12z 07/08/18 [contours only] | Days 6-7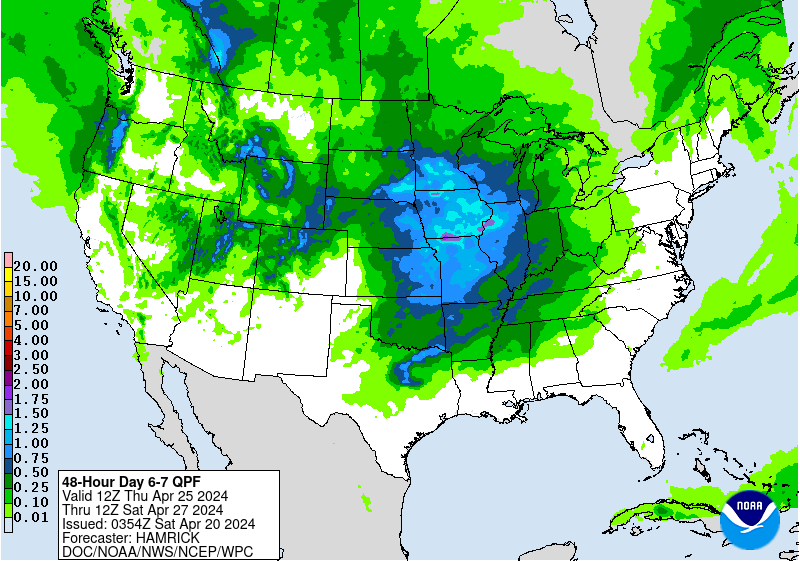 Valid 12z 07/08/18 - 12z 07/10/18 |
Severe Storm Risk Thurday. Main jet stream shifting north, not much risk. Press your cursor on the map for full screen.
https://www.spc.noaa.gov/products/outlook/
Current Day 1 Outlook | Forecaster: Hart/Kerr Issued: 18/1240Z Valid: 18/1300Z - 19/1200Z Forecast Risk of Severe Storms: Slight Risk |
Current Day 2 Outlook | Forecaster: Bunting Issued: 18/0600Z Valid: 19/1200Z - 20/1200Z Forecast Risk of Severe Storms: Marginal Risk |
Current Day 3 Outlook | Forecaster: Bunting Issued: 18/0731Z Valid: 20/1200Z - 21/1200Z Forecast Risk of Severe Storms: Marginal Risk |
Current Day 4-8 Outlook |
Excessive Rainfall Forecasts.............Northeast US today.
Current Day 1 Forecast Valid 12Z 07/05/18 - 12Z 07/06/18 |
Day 1 Threat Area in Text Format
| Day 2 and Day 3 Forecasts |
Current Day 2 Forecast Valid 12Z 07/06/18 - 12Z 07/07/18 |
Day 2 Threat Area in Text Format
Current Day 3 Forecast Valid 12Z 07/07/18 - 12Z 07/08/18 |
Most weather maps on MarketForum are updated constantly, from radar images every few minutes to daily precip/models. This causes descriptions of some of the maps to be outdated later on or the next day. Every day, we just start over again with new descriptions and new maps. Please enjoy the comprehensive coverage of your weather here!
High Temperatures today and Friday, hot in much of the country...cool N.Rockies on Wednesday.


Adding the 70+ dew points below will make it feel 5-10 degrees hotter in many places.

Heat and high humidity........feels like temperature!

Highs days 3-7 shows Very warm/hot in most places. Cool start in Northeast.


How do these temperatures compare to average at this time of year:
High temperature departures:

Low Temperature Departures:

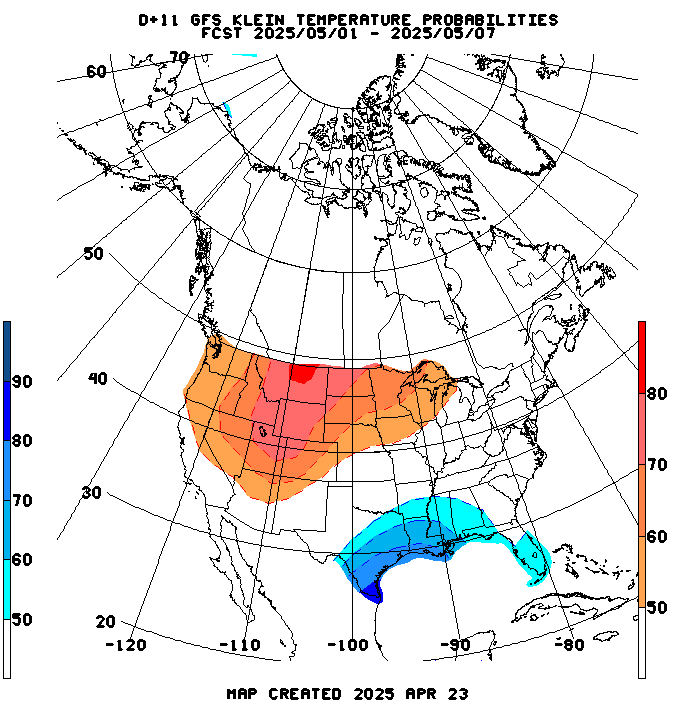
From the GFS ensemble mean products. Temperature anomalies for Thursday.

Temperature anomalies at the end of week 2.....most intense heat shifted west.

Last OVERNIGHT European model, heat ridge farther southwest but heat flows into Midwest, especially southern Midwest:
Last, 6Z GFS is very bearish towards the end of week 2....heat ridge far southwest and deep trough digs into Midwest.
gfs_namer_360_200_wnd_ht | gfs_namer_360_500_vort_ht |
gfs_namer_360_1000_500_thick | gfs_namer_360_850_temp_ht |
Same idea with Canadian model but a couple members of the ensemble solution still bullish with dome farther northeast.
360h GZ 500 forecast valid on Jul 20, 2018 00 UTC


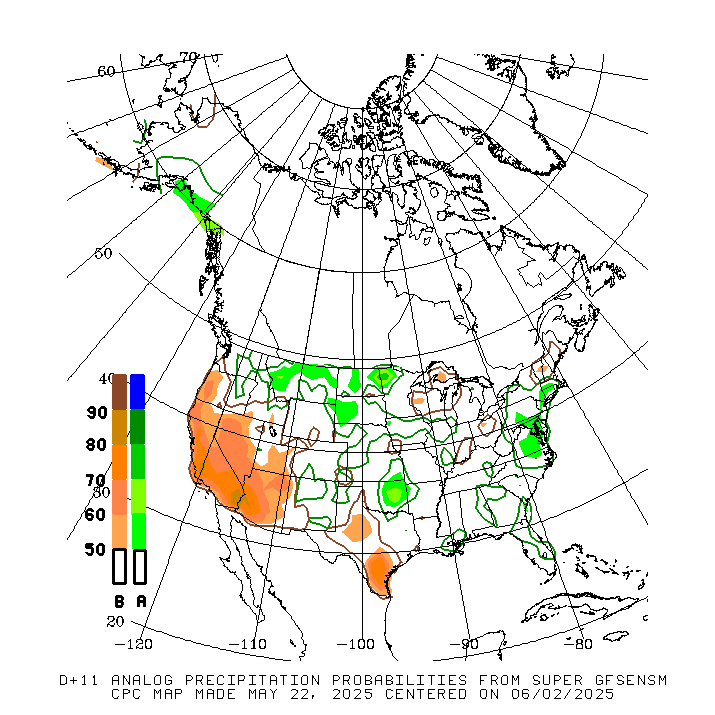
NWS guidance for 8-14 day forecast for this afternoon(sneak peak at what it will show). Very Warm across the country but this tool shows a bit more precip than before...........from ridge riders???
Precip below:
CFS week 3 and 4. Cooler today but dry.
Precip below

Satellite picture.

Rains the past 24 hours. Nebraska/Iowa to MN/WI.
![]()
You can go to this link to see rain totals from recent time periods:
https://water.weather.gov/precip/
Go to precipitation, then scroll down to pick a time frame. Hit states to get the borders to see locations better. Under products, you can hit "observed" or "Percent of normal".
After day 10, alot of the guidance brings rains back in. This is the total precip for 384 hours below from the just out 12z GFS:

It also pushes the most intense heat south of the Cornbelt.......later in week 2 on this 12z GFS solution just out:
 | gfs_namer_384_500_vort_ht |
gfs_namer_384_1000_500_thick | gfs_namer_384_850_temp_ht |
mcfarm shared this great link with us on earlier this week:


NWS extended maps: Above temps, below rain in the Cornbelt........same as the previous 12 days of extended maps.
Temperature Probability 6-10 day |
Precipitation Probability |
Temperature Probability 8-14 day |
Precipitation Probability |
Great job metmike. Wish you were around when I was actively trading grains and energies.


![[contours only]](http://www.wpc.ncep.noaa.gov/qpf/95ep48iwbg.gif?1530626894)