The weather in the region, from the entire West Coast to the N.Plains to U.Midwest has been incredibly hot this Summer!
30 day and 90 day temperature maps are below.
As much as 5 deg. F above average during the last 90 days in the anomaly epicenter.
WOW!
https://www.cpc.ncep.noaa.gov/products/tanal/temp_analyses.php
The area in the dark red shade on the map below, is in the top 1% for driest soil moisture going back the last 100+ years. This stretches from the entire West Coast to the N. Plains to U.Midwest.
In contrast, the green areas south and east of that have had tons of moisture.
It's like we divided the country in half. Northwestern part extremely dry, southeastern part pretty wet.
https://www.cpc.ncep.noaa.gov/products/Soilmst_Monitoring/US/Soilmst/Soilmst.shtml#
![]()
We know what caused this.
Not man made climate change/global warming as you've been told but the complete opposite. COOL waters and a La Nina signature(cooling waters) in the East/Central tropical Pacific, that started showing up in Spring 2020.
These cooler waters were/are associated with the slight global cooling that we experienced the last 18 months. This always elevates the odds of widespread drought in the US........like the last 2 major droughts in the Cornbelt in 2012 and the previous one in 1988.
This also combined with what's called the cool phase of the PDO(Pacific Decadal Oscillation) a -PDO.
A -PDO enhances/amplifies La Nina's.
I actually predicted this over a year ago(starting in May 2020), even though long range forecasting skill is usually very low. Not the specific area under drought and certainly not the extreme heat in the Northwest(which is historical) but the La Nina which increases droughts downstream in the US.
The threads below have numerous posts related to that, along with describing the situation last year as it evolved.
My Summer Forecast/La Nina this Summer! ...In Spring of 2020
39 responses |
Started by metmike - May 23, 2020, 11:33 p.m.
https://www.marketforum.com/forum/topic/52701/
La Niña has formed (by NOAA standard)
6 responses |
Started by metmike - Sept. 11, 2020, 11:32 a.m.
https://www.marketforum.com/forum/topic/59007/
West Coast/Oregon fires
12 responses |
Started by metmike - Sept. 12, 2020, 2:48 a.m.
https://www.marketforum.com/forum/topic/59043/
California governor blames wildfires on climate 'emergency'
33 responses |
Started by metmike - Sept. 14, 2020, 12:08 a.m.
https://www.marketforum.com/forum/topic/59093/
While we're on previous discussions related to this. the discussion with WxFollower on the historic June heat wave in the northwest was an unprecedented comprehensive discussion! It's loaded with great stuff!
June 2021 historic heat W US
66 responses |
Started by WxFollower - June 24, 2021, 2:21 a.m.
https://www.marketforum.com/forum/topic/71468/
To break this drought, ideally we need to warm the east/central tropical Pacific and bring back global warming with an El Nino!
What are the chances of doing that?
More on that shortly.
if i may offer a little correction here metmike.
with the start of the monsoon, not all areas of the west are having extreme heat/drought.
southern AZ is having one of the wettest monsoons on record.
and in late july we had the coldest high temp ever recorded in tucson (for july). an all time record on the low side.
last year was very hot and dry. this summer (after independence day) it has been relatively cool, muggy,... and i am having to mow more than any other time in the last 30 years. it is amazing how green the desert gets when the rain wont stop. weeds are going crazy.
Thanks bear,
I can see what you’re saying on the soil moisture map for Arizona. Lots of monsoon moisture this summer. Great for you!
1 state over, in California, along the West Coast it’s bone dry almost everywhere.
The longer range outlook hinges almost entirely on the state of the Pacific Ocean.
Basically.........
La Nina/cool tropical Pacific/global cooling =Elevated chances for drought to continue/worsen
El Nino/warm tropical Pacific/global warming =Elevated chances for increasing precip and drought improvement.
You aren't misinterpreting the above. It does mean that a resumption of global warming (which has paused for several years now) is the best thing to break this drought.
As demonstrated previously, the long lived La Nina signature in the Tropical Pacific (emerging in the Spring 2020)correlates very strongly with the current drought out West to the N.Plains/Upper Midwest.
Locations of La Nina droughts are impossible to pinpoint geographically downstream in the US.
Some years they've been in the Midwest(2012, 1988) Some years in the S.Plains (2010/11). Some years in the Southeast(2007/8) those are just off the top of my head.
Other years, in the late 90's/early 2000's they were hybrid location droughts. I showed numerous historical examples here:
https://www.nhc.noaa.gov/graphics_at2.shtml?start#contents
This needs to reverse to give us the best chance to break the drought. Instead of reversing to an El NIno, as I'll show you below, the La Nina strengthens for the rest of the year, possibly weakening during the 2nd half of this upcoming Winter.
++++++++++++++++++++++++++++++++++++++++++++++++++++
The other HUGE factor is the current -PDO(Pacific Decadal Oscillation). This is amplifying the affects of La Nina's downstream!
https://www.marketforum.com/forum/topic/59093/#59142
August 2nd, 2021 by Roy W. Spencer, Ph. D.
http://www.drroyspencer.com/2021/08/uah-global-temperature-update-for-july-2021-0-20-deg-c/

The linear warming trend since January, 1979 remains at +0.14 C/decade (+0.12 C/decade over the global-averaged oceans, and +0.18 C/decade over global-averaged land).
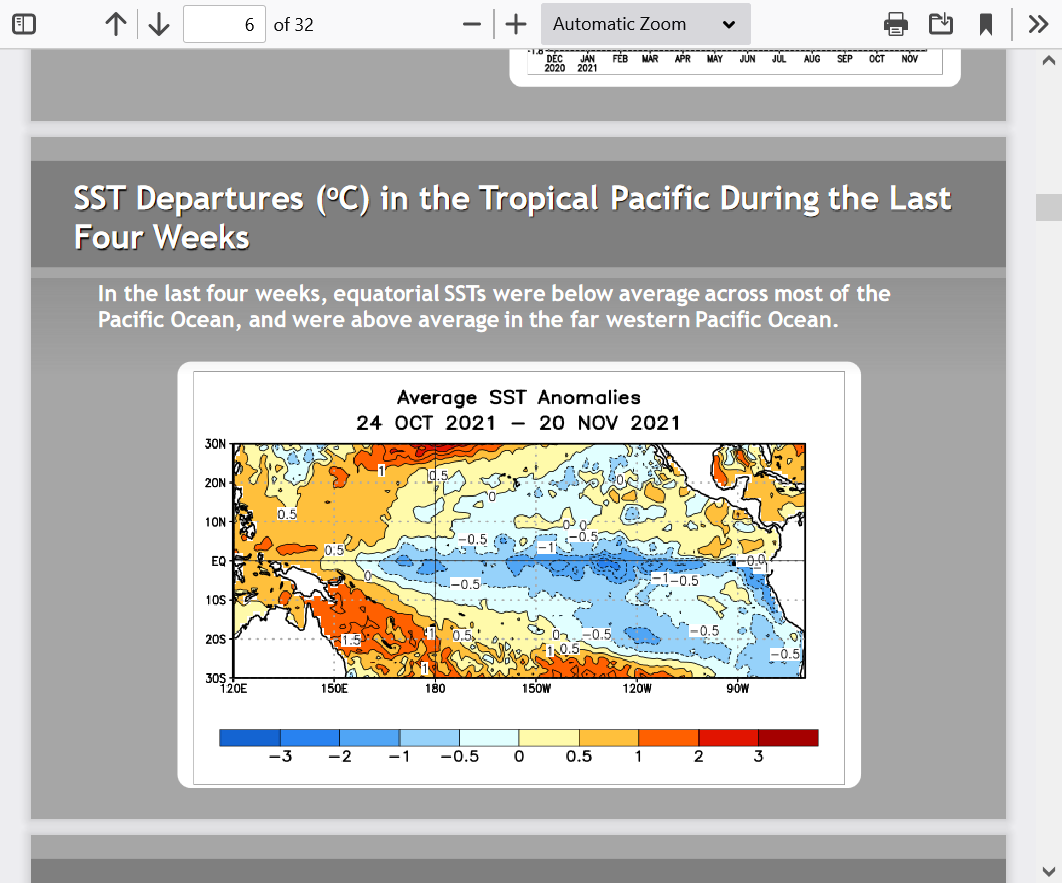
Here are the latest conditions in the Pacific:
ENSO: Recent Evolution,
Current Status and Predictions
ENSO Alert System Status: La Niña Watch
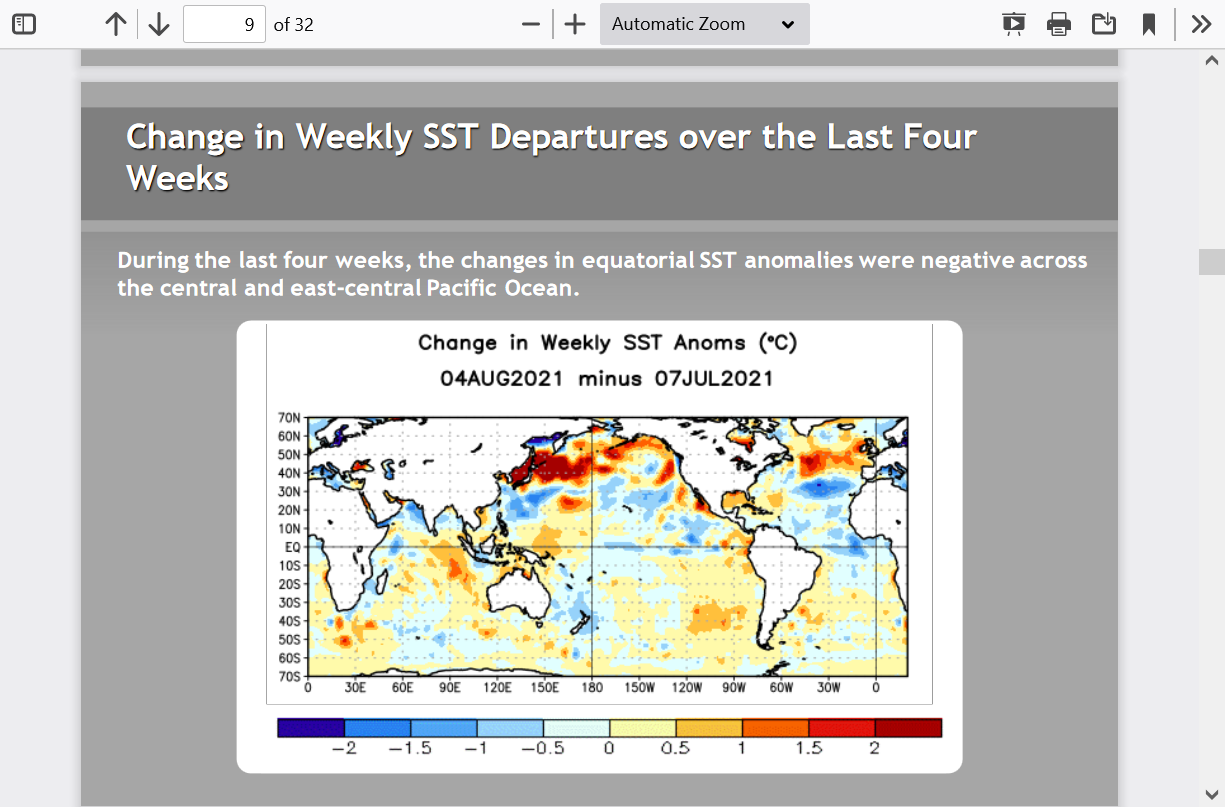
The first map shows the big picture of much of the planets oceans. Wow, look at the blob of warmth across the N.Pacific. That could very well be playing a major role in this recent drought and weather pattern(heat out West) but this discussion keys almost entirely on the tropics which is what ENSO(El Nino, Southern Oscillation) is all about.
The key area for ENSO is much farther south and has mostly blue/cool shaded anomalies.
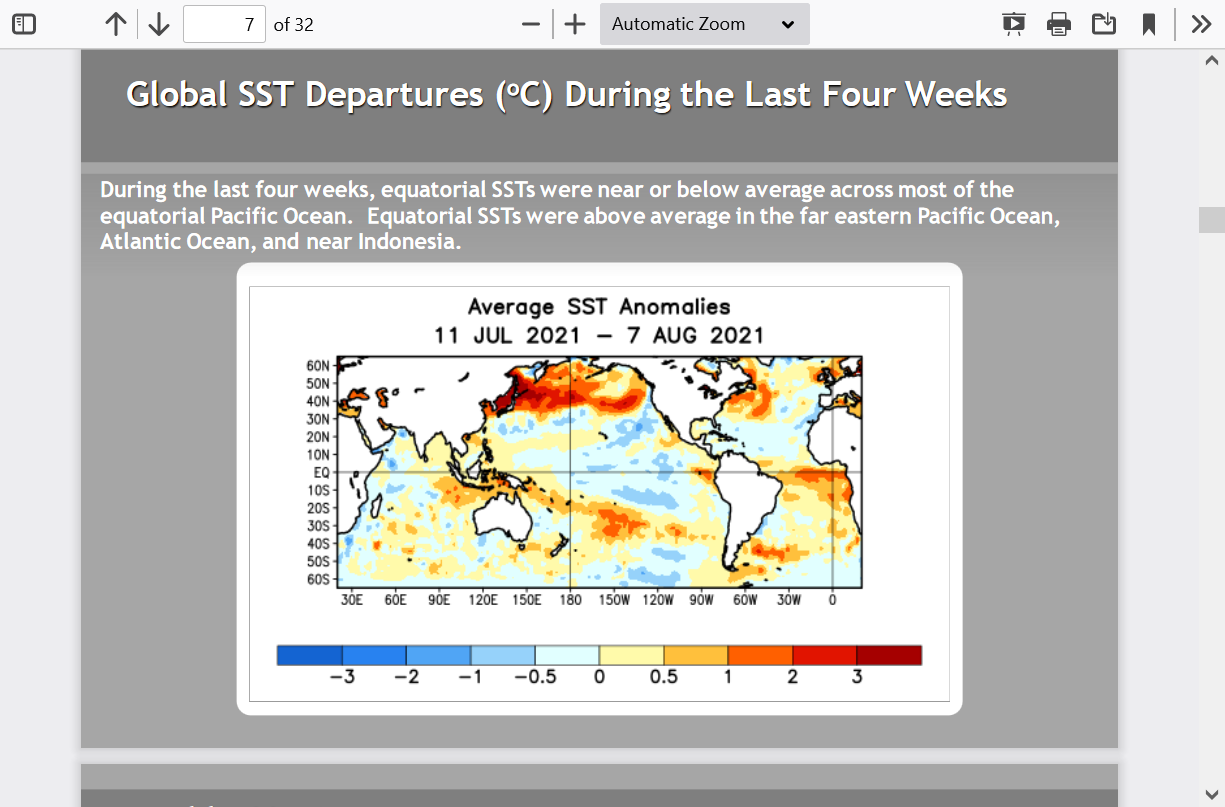
Zooming in closer to the ENSO region, you can see those MODEST blue/cool anomalies. Not quite great enough magnitude to be a La Nina(they were earlier this year and are headed back there now).

The ENSO region has started cooling again but WOW, look the rapidly warming N/NW.Pacific. This must be some sort of record and is probably, related to the extreme heat in the Pacific Northwest this Summer.
We had some temporary warming this Spring in the upper ocean heat content but we are rapidly going the other way again(cooling)..............soon to hit official "La Nina" category levels again.
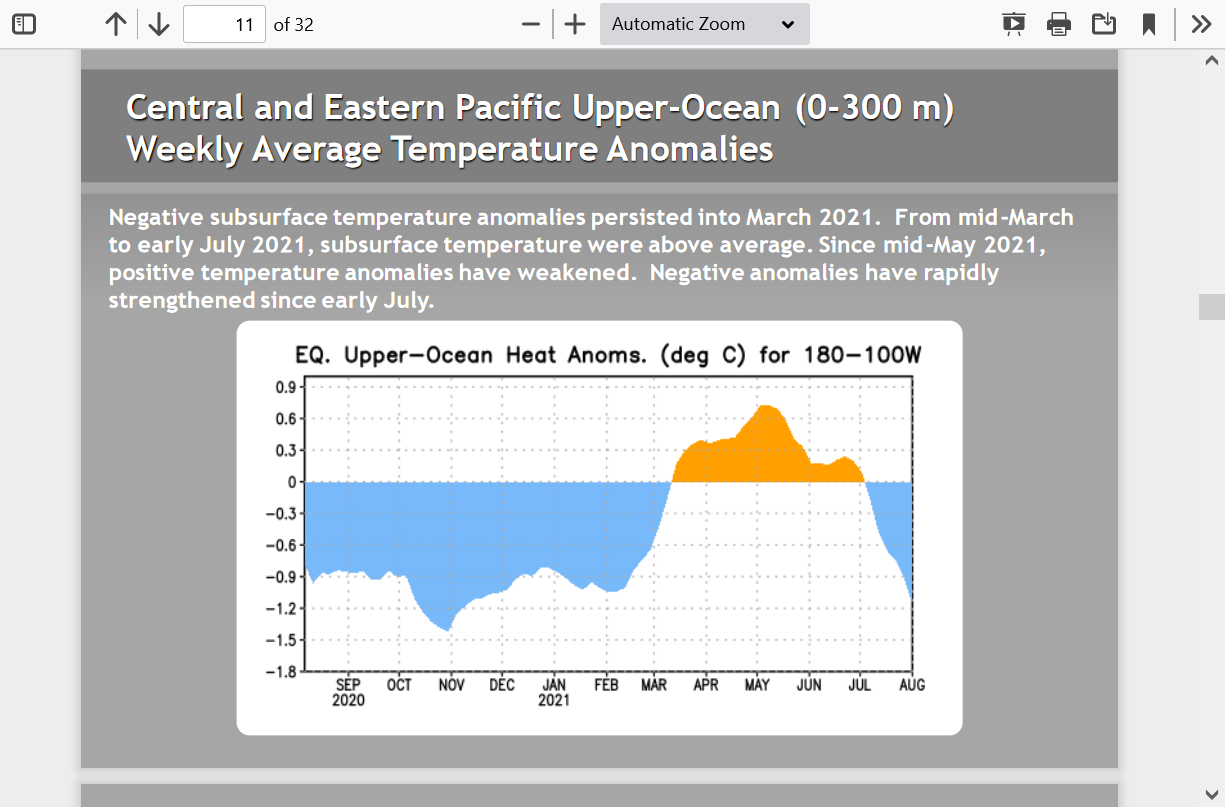
Subsurface temperatures are often a strong indicator/precursor to surface temperatures and looking at how quickly a massive pool of cool anomalies has grown the last few weeks.
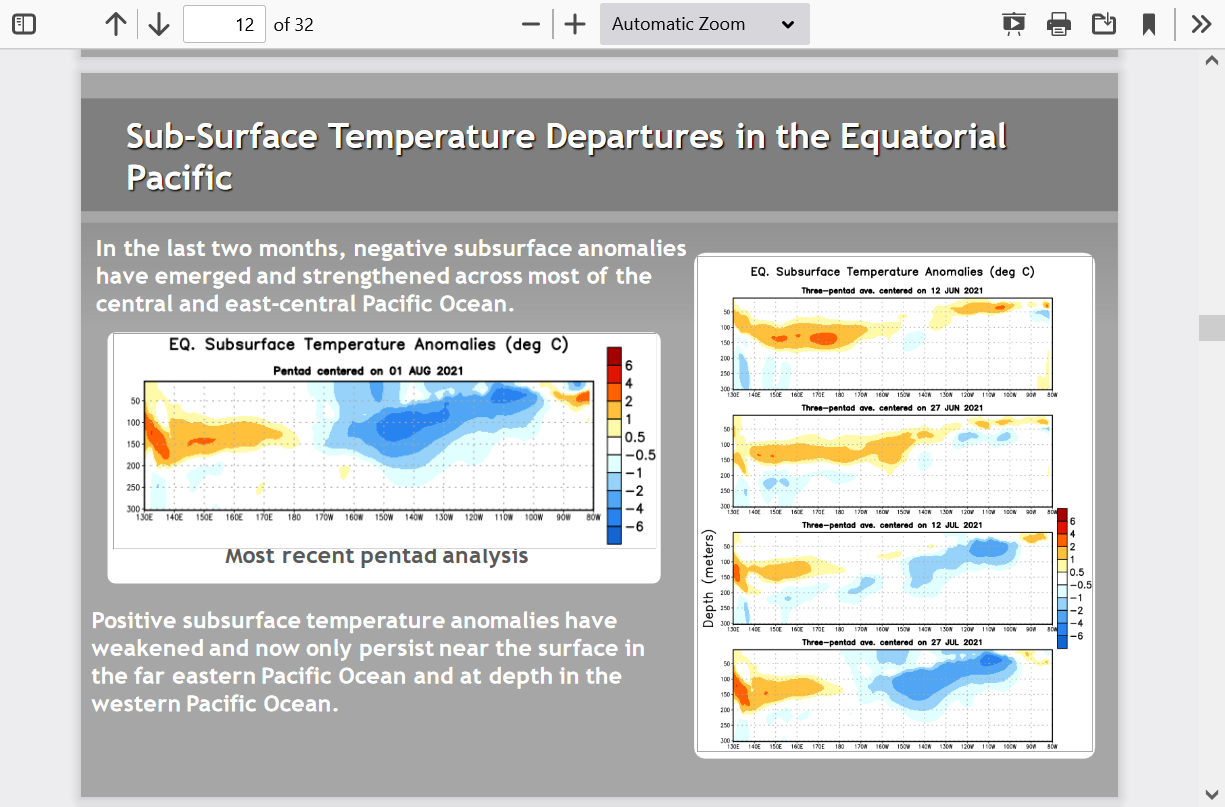
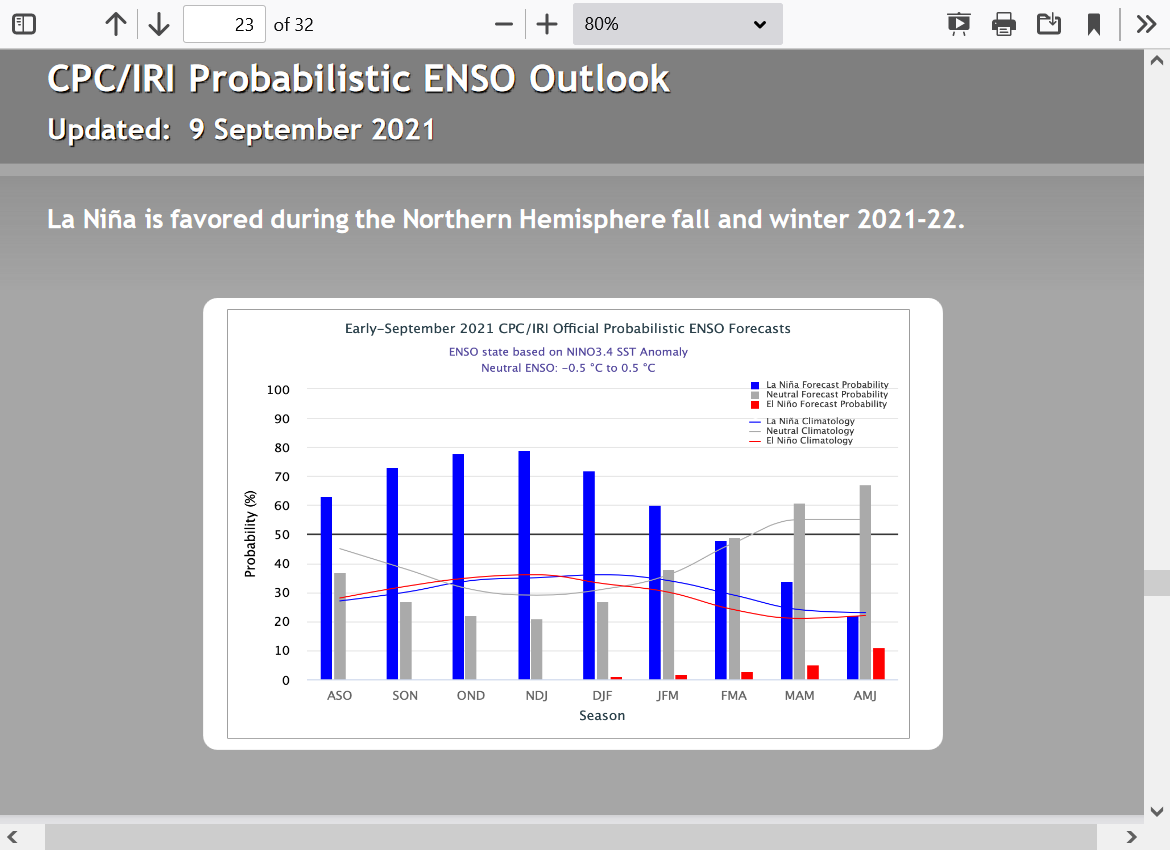
Sure enough, the models increase chances for a La Nina, which is pretty likely by this Fall.
Possibly weakening late this upcoming Winter?


I'll just give you the latest 3 month forecast from NOAA and the Winter forecast. Take them with a grain of salt because historically they have low skill.
Note the widespread warm predicted for Aug-Sep-Oct and dry weather for the drought areas.
That should verify close. Prospects for relief are low with high confidence for a long range projection because of the La Niña which is extremely likely then.
Winter? Going to be tough to break the drought in california with a La Niña.


++++++++++++++++++++++++++++++++++++++++++++++++++++++++++++++++
What do you think WxFollower?
Others?
Climate Adaptation
While I don't have any expertise in this area, I was looking at the drought map this morning and had the passing thought, what if this was just the beginning of something bigger? What if nothing improved and next year the drought builds on what we already have?
Thank Jim,
Multi year droughts are not unusual in this area from the distant past. Wild fires seasons were also worse in the past.
We see scary stories like this:
https://www.cbsnews.com/news/drought-western-united-states-modern-history/
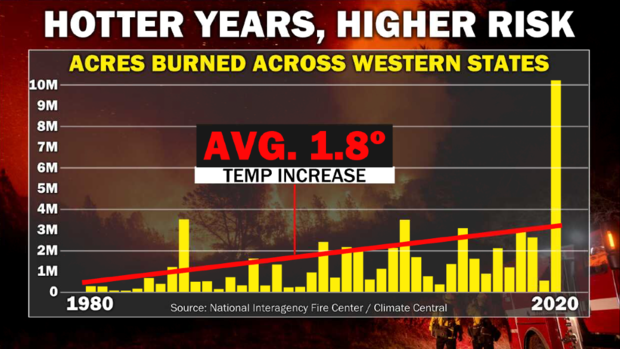
Note that the starting point for their graph above is 1980. There is a dishonest reason for that.
. Almost 70% of large fires in Rocky Mountain National Park burned during La Nina events that coincided with a negative PDO, although these phases co-occurred during only 29% of the 1700-1975 AD period.”

Appropriately, the recent uptick in forest fires coincides with the natural 21st century shift of the PDO to its negative phase and increased frequency of La Nina conditions
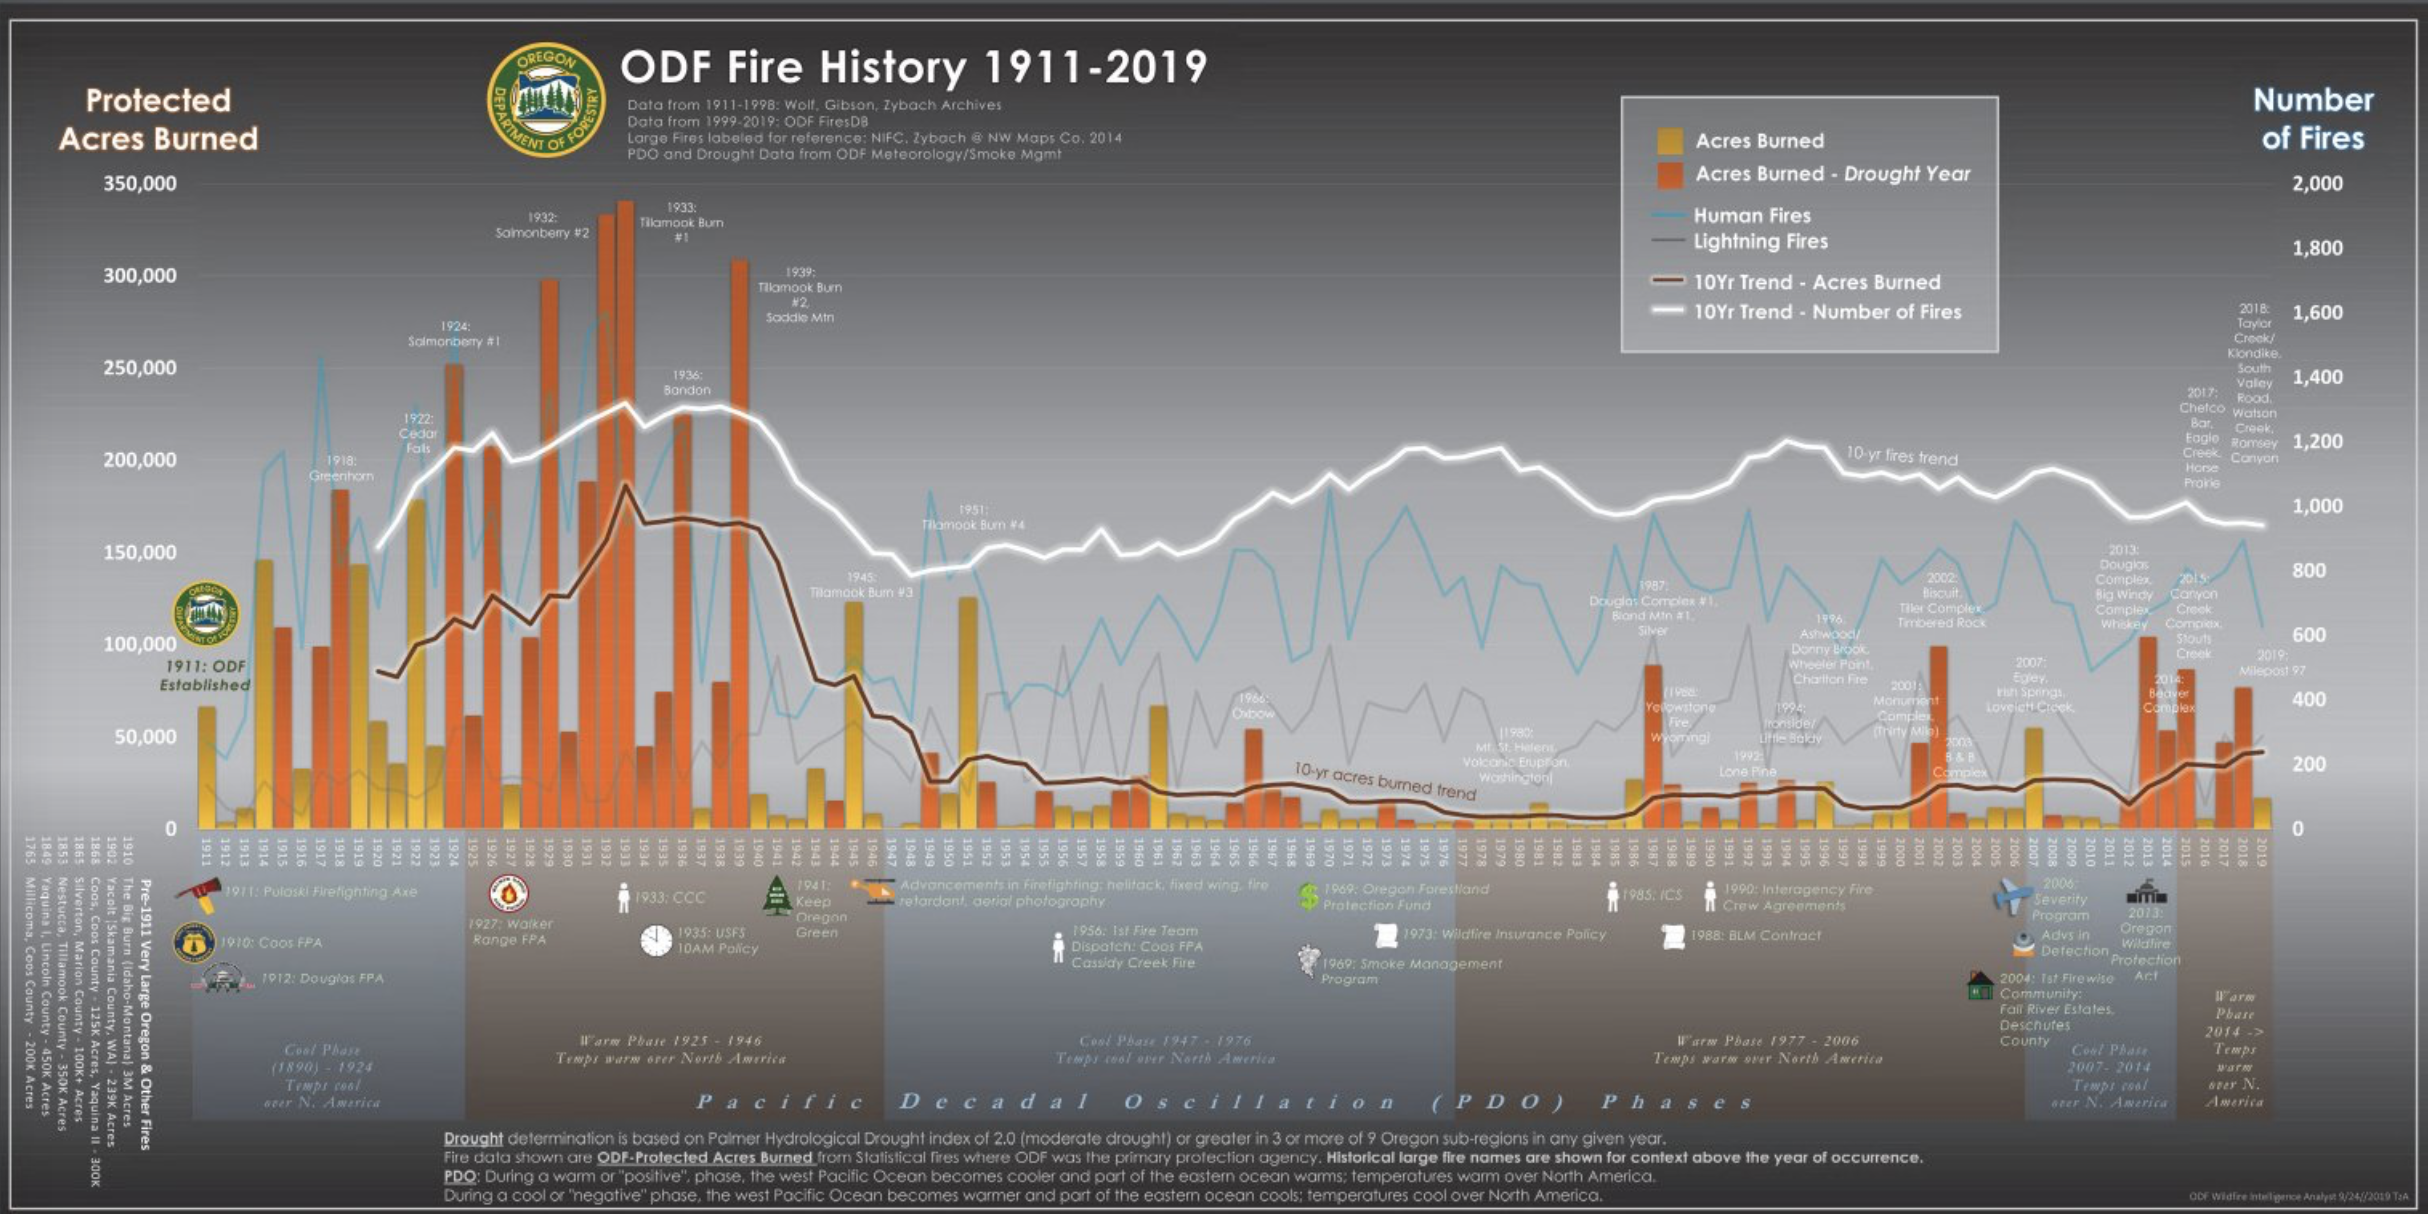
++++++++++++++++++++++++++++++++++++++++++++++++++
This image is from the Oregon Department of forestry. Click on the diagram to blow it up, you can see the influence of the Pacific Decadal Oscillation (PDO).
Note what happened in the 1930's during the Dust Bowl years in the Plains/Midwest when the drought extended across much of the country for much of the time.......all the way to the West Coast:
https://wattsupwiththat.com/2020/09/17/fire/
See the entire discussion here:
https://www.marketforum.com/forum/topic/59093/#60429
Re: Re: Re: California governor blames wildfires on climate 'emergency'
By metmike - Oct. 26, 2020, 4:08 p.m.
We continue to hear/read that the wildfires out West are being caused by climate change and even being called "Climate Fires".
This is exactly wrong.
Climate Change from global warming will feature warmer Tropical Pacific Ocean Temperatures and more El Nino's. El Nino's INCREASE precipitation along the West Coast.
Currently, we've had La Nina conditions in the Tropical Pacific since early Summer..............cooler than average temperatures. La Nina's are the complete opposite of El Nino's and they decrease precipitation. This La Nina is what caused the drought to develop/worsen this year. It's the biggest underlying problem with the wildfires.
La Nina's cause droughts in much of the US and they increase during periods of global cooling but also occur naturally but less frequently and are weaker during global warming.
If there was any affect from global warming/climate change on the wildfires from this signal, it would be to SUPPRESS drought and wildfires, not cause them.
I found this interesting about atmospheric rivers with heavy rains increasing in the West from climate change. It makes complete sense with the Tropical Pacific Warming up:
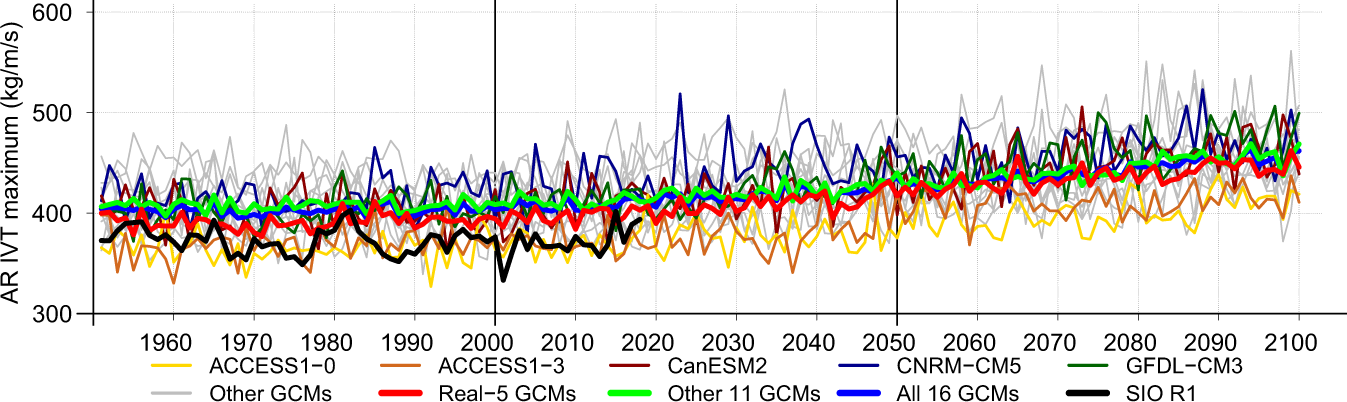 Atmospheric rivers along the West Coast can produce in excess of 50% of total annual precipitation5 and are
historically associated with extreme precipitation and flooding3,23. They can also penetrate far inland along preferred topographic corridors24,25,26. Consequently, the majority of western floods are orchestrated by ARs land-falling upon the West Coast22 and so are flood insurance claims27. Thermodynamic enhancement of vertically integrated horizontal water vapor transport (IVT) in a warmer future28 will lead to wetter, wider and longer ARs globally29, exacerbating their impacts. For the West Coast, evidence of increasing IVT30 as well as of AR landfalling activity associated with observed long-term Pacific sea surface temperature (SST) warming has been reported with impacts on precipitation over the West, although this trend has not heretofore clearly emerged from the envelope of natural variability5. Increasing IVT and associated AR activity have been clearly projected over the West Coast for later in the century31,32,33,34,35. Although some of these model studies linked changes in AR activity to precipitation accumulations, particularly from heavy precipitation events assessed at the coarse GCM resolution34,35, the existing body of work on IVT and atmospheric rivers in climate model projections has not so far fully considered impacts on precipitation regimes, especially at the scales relevant for driving regional water resources.
https://www.marketforum.com/forum/topic/59093/#59142
By metmike - Sept. 14, 2020, 5:49 p.m.
The recent severe drought in California, that lasted for several years was the worst in over 100 years. It was bad.............but 100 years on a climatic scale is like 1 second is to a 24 hour day. Extremes like this have been happening in several places at the same time on the planet simultaneously for the last million years.
Historically, this last drought was a picnic compared to recent droughts there.
Maybe you can take heart in the fact that busted global climate models, that have been wrong, are forecasting MORE rain for California during the next century(though it would make sense with more El Ninos)
https://phys.org/news/2017-07-california-wetter-century.html
Read more at: https://phys.org/news/2017-07-california-wetter-century.html#jCp
As far as warmer temperatures and increasing CO2, unfortunately that is causing plants to grow much faster which is resulting in a massive increase in fuel for wildfires.
The best option is to let the increasing CO2 continue to feed an additional 1 billion people on this planet and benefit ALL of life on this planet and adapt in the forests by managing the floors much better.
One way to look at that would be, to look at what it would be like without the extra CO2 from the last 100 years. Wildfires would be less intense................but over 1 billion of the nearly 8 billion people on our planet would starve within 3 years and food prices, in my estimate would triple in order to ration the shortages.
Unfortunately for California, some of the worst weather on the planet has been occurring out there in the last decade.............that is compared to the last 130 years of weather.
The planet as a whole, over the last 40 years has easily experienced the best weather and climate since the Medieval Warm Period, 1,000 years ago, that was at least this warm.
Even in the best climate in a Millenium, on this huge planet, there will always be extreme and bad weather in some places.
One look at the all the data from over 250 studies and models going out to 2100, makes it clear that the planet is not burning up or drying up.......it's massively greening up.
Fake beer crisis/Death by GREENING!
7 responses |
Started by metmike - May 11, 2021, 2:31 p.m.
An interesting element to this current La Nina weather pattern and Hurricane Henri in the Northeast.
++++++++++++++++++++++++++++++++
Polar bears doing great Arctic/Antarctic ice update 8-22-2021
Started by metmike - Aug. 22, 2021, 3:45 a.m.
https://www.marketforum.com/forum/topic/74030/#74038
Very much related to this is the current La Nina signature in the Pacific which correlates to temporary global cooling.
The modest global cooling period 1950's-70's featured the most La Nina's in the last century and an increase in Arctic sea ice(though measurements are sparse)

Hurricane Henri and previous bad hurricane seasons
https://www.marketforum.com/forum/topic/73966/#74028
metmike: No big changes in the Winter outlook from 2 months ago!
Scroll down for MUCH more.
ENSO: Recent Evolution,
Current Status and Prediction October 11, 2021
Equatorial sea surface temperatures (SSTs) are below average across the
central and east-central Pacific Ocean.
A transition from ENSO-neutral to La Niña is favored in the next couple of
months, with a 70-80% chance of La Niña during the Northern Hemisphere
winter 2021-22.*
Latest temperatures and changes below.


A huge pool of cooler water below the surface!

And that pool of cooler water below the surface has been growing!
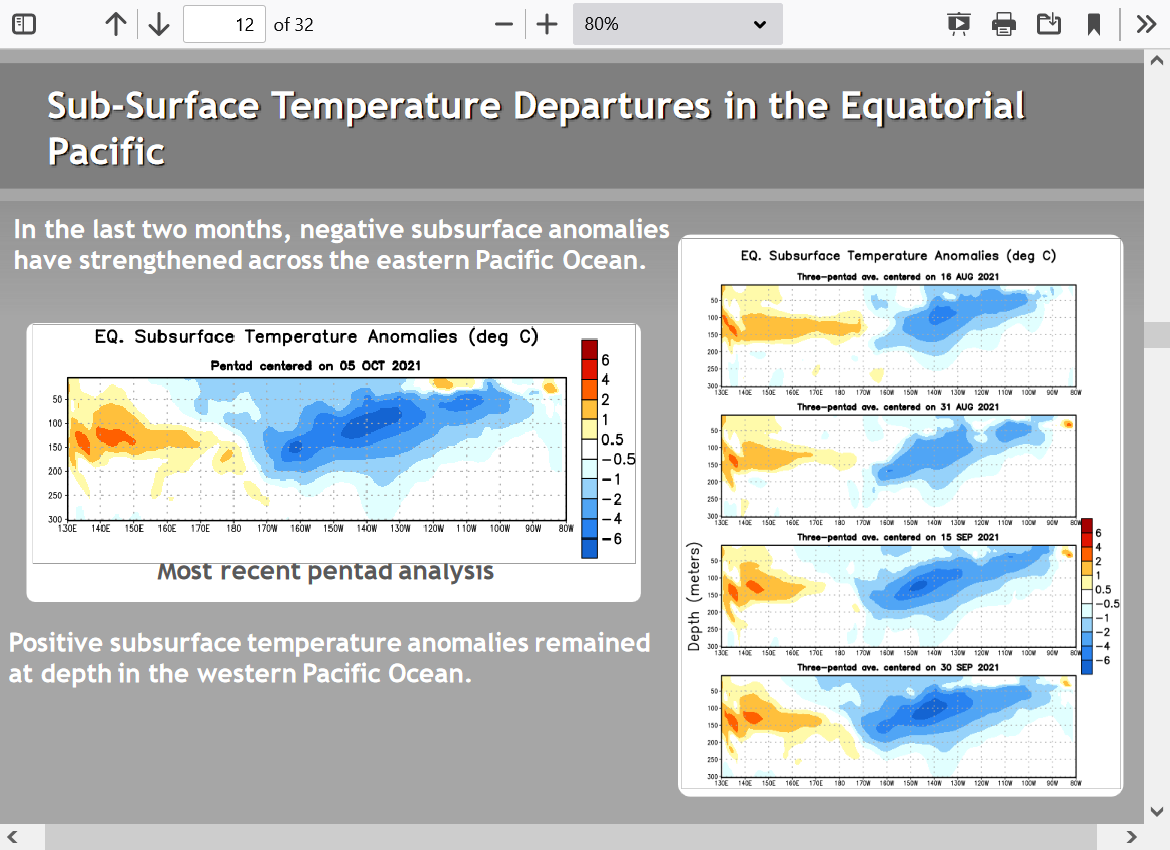
Models have a high probability of those cooler subsurface waters coming to the surface and bringing back a full fledged La Nina again........which should last thru at least the first half of Winter, possibly all of Winter.
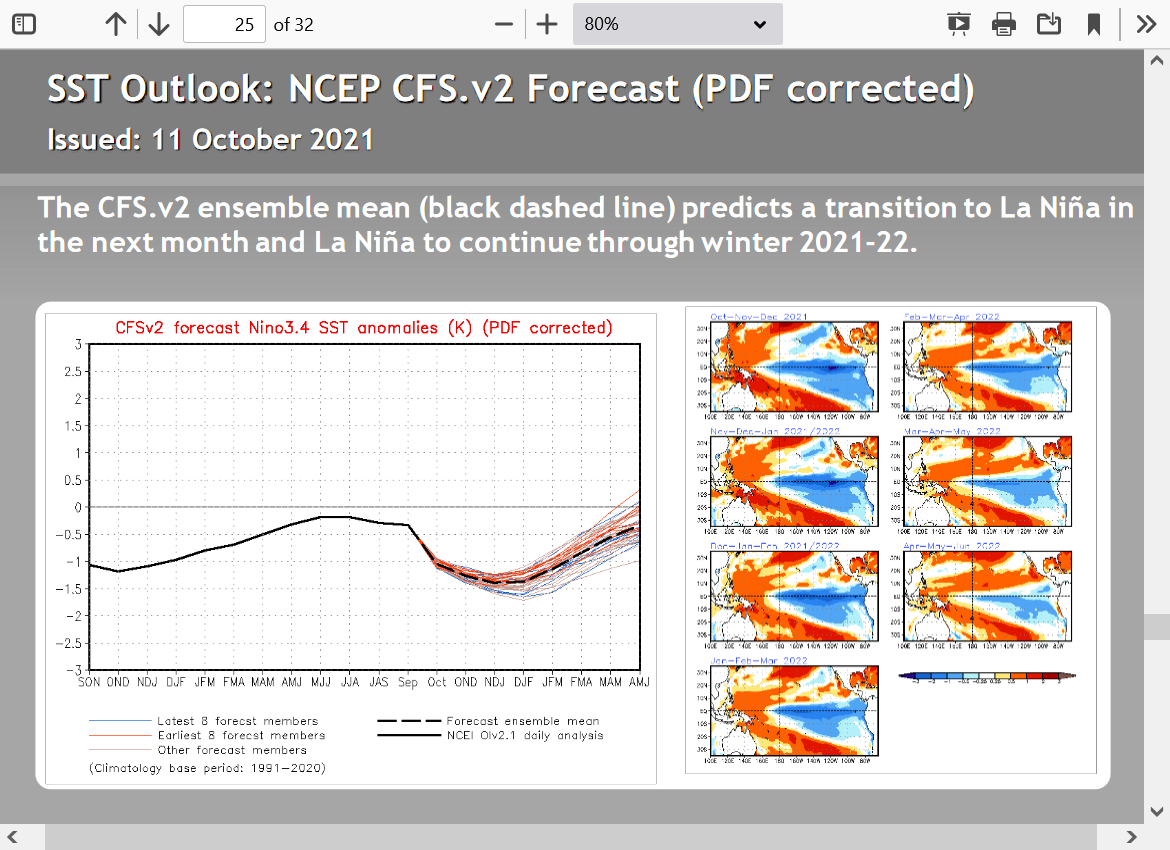
Having a La Nina this Winter decreases the chances for drought busting rains in the West, especially in the Southwest and West Coast in California.
Global warming and El Nino's INCREASE the chances for big rains out there.
La Nina's and cooler tropical Pacific temperature anomolies like we'll have this Winter are the complete opposite of this.
The upcoming La Nina decreases the chances for the global temperature to hit new highs this Winter.
Appreciate all those updates Mike, thank you !
Any chance at all that we reverse course early spring and start building an El Nino pattern ?
My kind of great question kris!
Long range WEATHER forecasting has pretty low skill. It really drops by the time we get out beyond 2 weeks.
The correlation between La Nina Winters and low Winter precip in the West is not one to one either. It often features good precip in the Northwest but pretty dry south of that but there have been exceptions.
We do find moderate to strong correlations to certain kinds of weather between La Nina's and El Nino's in certain parts of the country during the Winter which I'll discuss in detail here.
Weather is very tough to forecast beyond 2 weeks...........ocean temperatures, however are much easier to forecast for the next 6 months. Water temp anomalies are only capable of changing at a very, very slow rate. Water has 1,000 times more heat capacity than air and the water in the Pacific in a few months is going to come from............the water in the Pacific that's in that vicinity now. WInds can gradually shift/transport cooler or warmer water and subsurface water can rise to the surface but it happens very gradually/slowly.
In the atmosphere, you can go from a record breaking cold weather pattern, with air masses dumping in bodily, powered by a Siberian express jet stream/steering currents transporting the coldest air on the planet thousands of miles south from the high latitudes to the mid latitudes........ then 2 weeks later have the pattern be the complete opposite and feature record warmth from south winds transporting in tropical air masses with origins being from locations 1,000-1,500 miles to the south.
That's physically impossible in the Pacific Ocean. Water just cannot cool down or heat up that fast or be transported in a great enough quantity from a place far away that has the complete opposite temperature anomaly.
This makes predicting the temperature anomalies for the next several months in many areas of the ocean about as accurate as forecasting the weather for the next several days.
Coincidentally, NOAA just announced today, Oct. 14, 2021 that the tropical Pacific ocean had cooled just enough for us to be back in the official La Nina mode again.
This was easily seen coming for the last several months, as evidenced by this thread started back in August.
A continuation and STRENGTHENING of this La Nina for the next few months is also a high confidence, no brainer prediction.
Getting back to neutral is not likely until around early next Spring at the earliest.
If water temperatures continued to warm in the East/Central tropical Pacific(the La Nina/El Nino region), we might need an additional 6 months of warming to get warm enough for an El Nino.
That would be almost a year from now.
That's not a forecast but an educated guess on when the next early stages of a new El Nino are possible.
The Pacific Ocean is also in a -PDO right now, which is a multi decadal oscillator that is considered the "cool phase".
A negative/-PDO causes more La Nina's and is helping here, so having the -PDO makes it harder to have El Nino's.
A +PDO is favorable for more El Nino's.
More maps/graphs coming up.
This product is updated once a month and was Just updated today!!!!
Your question had impeccable timing kris! I wouldn't have looked without it....thanks man.
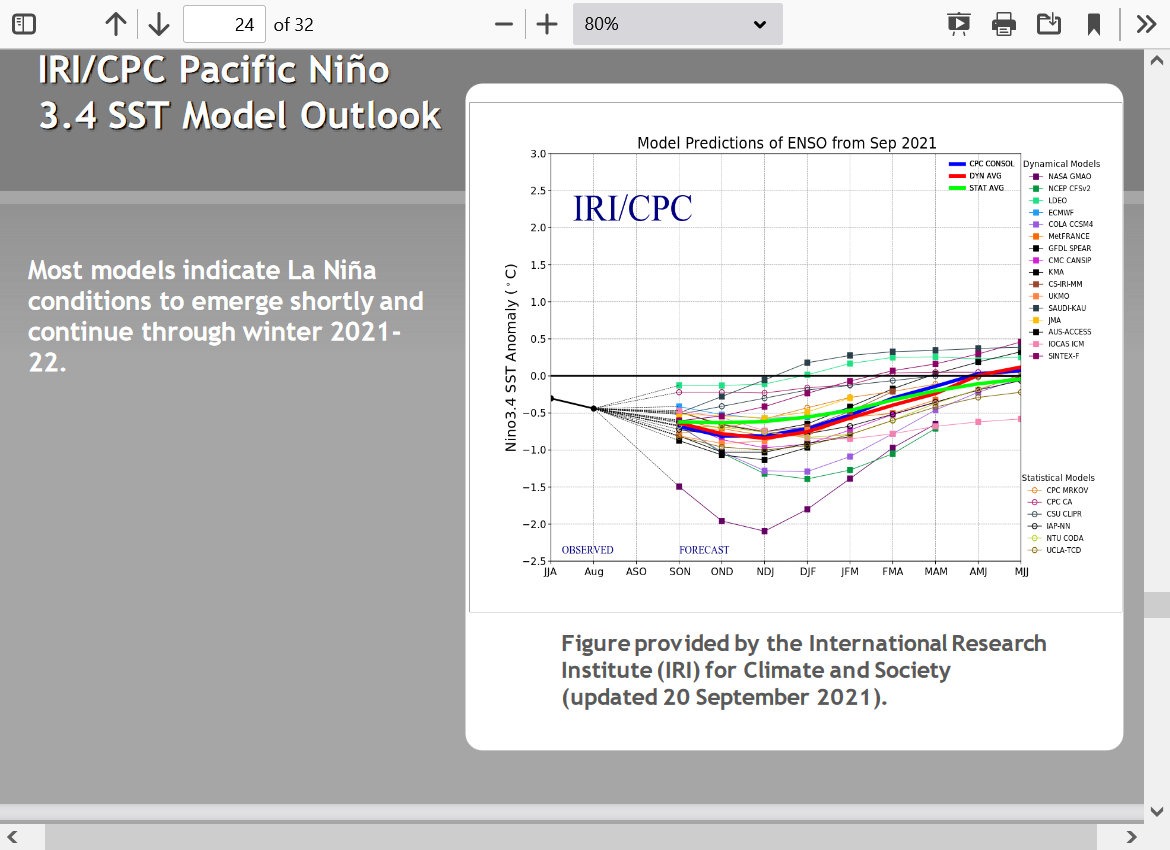
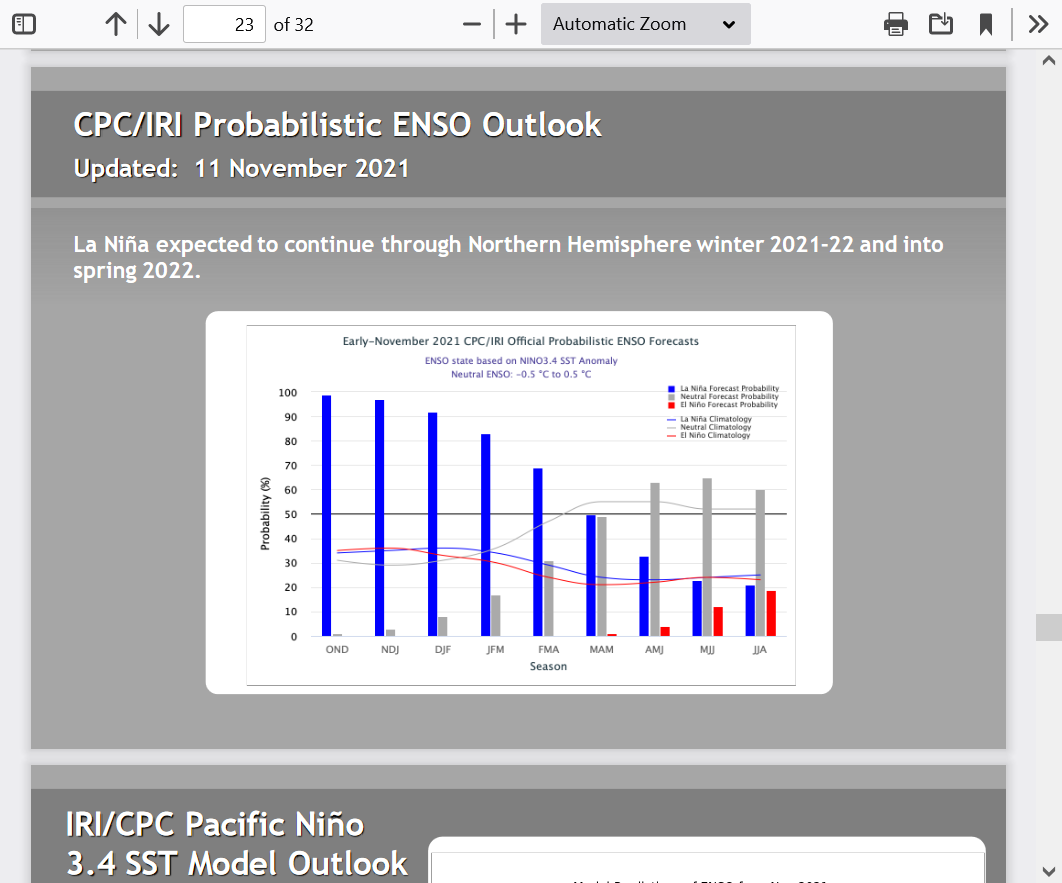
https://iri.columbia.edu/our-expertise/climate/forecasts/enso/current/?enso-iri_plume
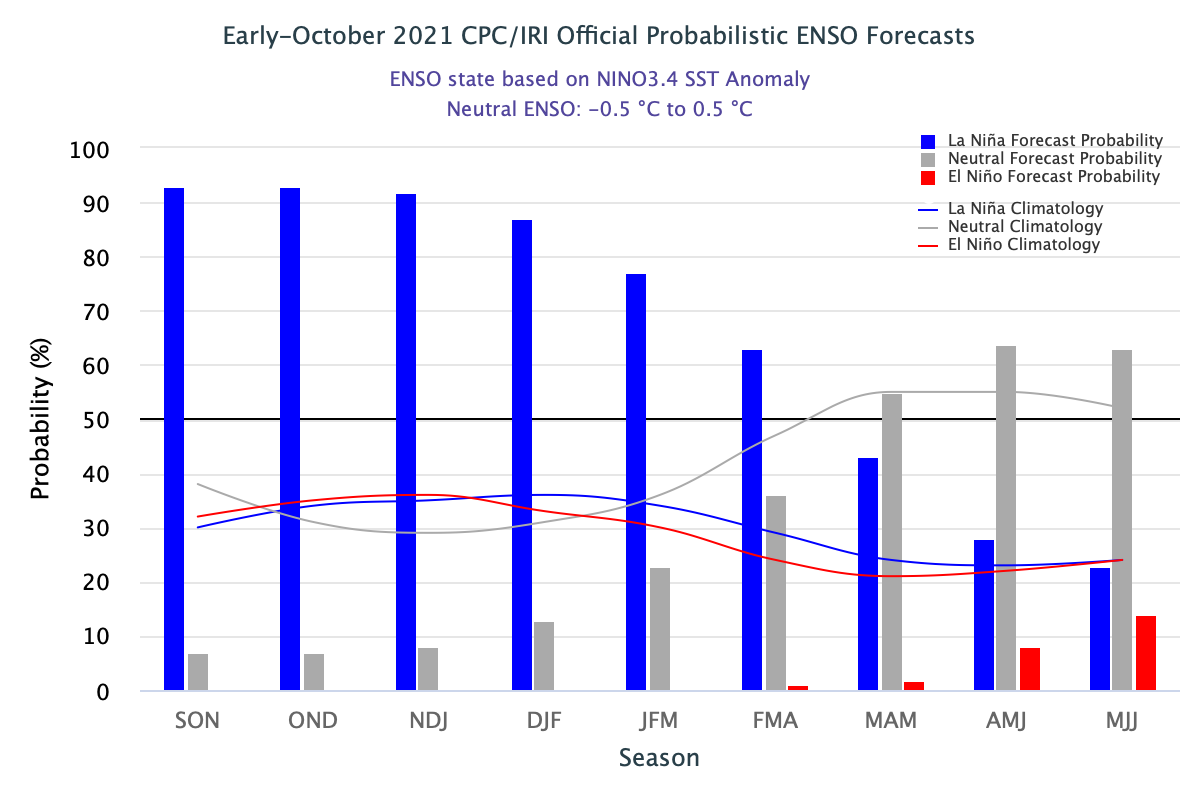
% probability below....note how slow the changes are, with most forecasts probably gravitating towards neutral with time. I don't know for sure but don't think these kind of forecasts have good skill at forecasting at a year or more out.
So it's sort of reversion to the mean when you get beyond that period. You can see that even next Summer, the chances of an El Nino are still pretty low and still less than having a La Nina.
| Season | La Niña | Neutral | El Niño |
|---|---|---|---|
| SON | 93 | 7 | 0 |
| OND | 93 | 7 | 0 |
| NDJ | 92 | 8 | 0 |
| DJF | 87 | 13 | 0 |
| JFM | 77 | 23 | 0 |
| FMA | 63 | 36 | 1 |
| MAM | 43 | 55 | 2 |
| AMJ | 28 | 64 | 8 |
| MJJ | 23 | 63 | 14 |
You're the best Mike, great stuff and very much appreciated !
https://sealevel.jpl.nasa.gov/data/el-nino-la-nina-watch-and-pdo/pacific-decadal-oscillation-pdo/
The Pacific Decadal Oscillation (PDO) is a long-term ocean fluctuation of the Pacific Ocean. The PDO waxes and wanes approximately every 20 to 30 years. From ocean surface topography data, together with other ocean and atmospheric data, scientists can determine whether we are in a ‘cool’ phase or a ‘warm’ phase.
metmike: The image below depicts a typical -PDO and you can see how it resembles the current temp profile of the Pacific in its La Nina. This is why -PDO cause MORE La Nina's and LESS El Nino's. It's the complete opposite with a +PDO. A +PDO and its more El Nino's also help to warm the planet because heat is belching out of the tropical Pacific ocean into the atmosphere. Global temperatures during strong El Nino events are usually several tenths of a degree warmer than La Nina's JUST BECAUSE of the El Nino belching out heat affect by itself.

The 'cool' phase is characterized by a cool wedge of lower than normal sea-surface heights/ocean temperatures in the eastern equatorial Pacific and a warm horseshoe pattern of higher than normal sea-surface heights connecting the north, west and southern Pacific.
In the 'warm' or 'positive' phase, the west Pacific Ocean becomes cool and the wedge in the east warms. A ‘cool’ phase occurred from 1947 to 1976 (29 years), and a ‘warm’ phase from 1977 to 1999 (22 years). However, more recently, the ‘warm’ and ‘cold’ phases have been much shorter.
https://sealevel.jpl.nasa.gov/data/el-nino-la-nina-watch-and-pdo/pacific-decadal-oscillation-pdo/
Here's 2 more images that show the difference between a +PDO on the left and -PDO on the right(similar to what we have now).
The PDO is an active topic of research and satellite data, such as that from Jason-3, helps scientists observe and understand the phenomenon. For further information see our January 2000 press release and articles in the press.
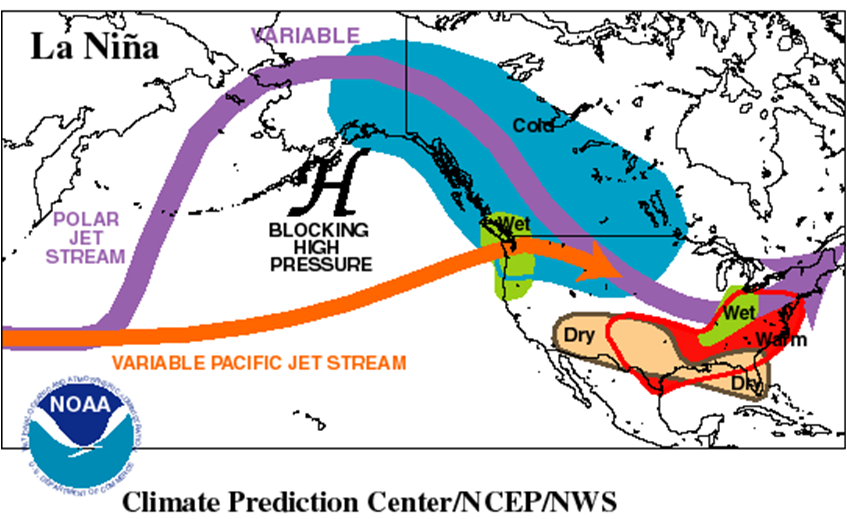
metmike: This is an older article but is still valid and one of the best I've seen for explaining the many elements that go into our Winter patterns.
Big La Nina ridges in Northwest North America can cause some frigid air from high latitudes to dump south into the US, especially when amplified and accompanied by a -NAO and -AO.
https://www.weather.gov/iwx/la_nina
https://www.weather.gov/iwx/la_nina
Get the daily updated forecast for the AO here:
https://www.cpc.ncep.noaa.gov/products/precip/CWlink/daily_ao_index/ao.shtml
Get the daily updated forecast for the NAO here:
https://www.cpc.ncep.noaa.gov/products/precip/CWlink/pna/nao.shtml
These are anolog(similar years) below.
For La Nina Winters below.
Left side shows the anomaly, right side shows the % frequency. At the very bottom, you will see a list of all the anolog years.....those with La Nina's. Last winter actualy is not included because it must not be updated.
https://www.weather.gov/iwx/la_nina
TEMPS
PRECIP
SNOW
YW kris! I edited down my first response page above shortly after typing it because, as you know I get carried away with words and OVER analyzing everything...drives my wife nuts!
Thanks for the great contributions and interest.
https://www.marketforum.com/forum/topic/73659/#76223
Scroll down for more!
I'm going to point out something that is profound and few people know related to climate change and La Nina's/El Nino's and the PDO. It's not exactly a brilliant deduction as much as it is one from a scientist that is actually LOOKING at the empirical data and observations. You can do it to, right now...without a lick of climate expertise!
Just an open mind that can tell the difference between blue and red and can read basic graphs.
See the explanation of the PDO from above here: https://www.marketforum.com/forum/topic/73659/#76226
This information, will make you smarter (about this element) than most brilliant, book educated PhD climate scientists with 8 years of schooling and decades of predicting global temperatures. I am absolutely NOT kidding.
https://www.smhi.se/en/theme/el-ni-o-and-la-ni-a-1.13054
Note on the graph above, the blue "icles" that show cool water anomalies in the east tropical Pacific and La Nina's. Also the red ones that show warm water anomalies and El Nino's.
In the 1950's/60's/70's we had MUCH more blue icicles by a wide margin. Drops to -2 several times and very long duration events. We also had modest global cooling of the planet during those years. La Nina's DOMINATED during those 25-30 years.
Global warming kicked in at the end of the 1970's and accelerated in the 1980's/90's. By no coincidence, El Nino's massively increased and with them additional heat burped out of the east/central tropical Pacific and warmed the entire planet by a couple tenths of a degree when they happened. Look at the red icicles, going above +2 (SUPER El Ninos) and dwarfing the blue by a very wide margin in the 80'/90's!
Global climate models came into existence during that accelerated warming in the 1980's/90's and they were programmed with equations that assumed the increase in CO2 was responsible for ALL the warming. No ENSO signal. No PDO signal. Nothing in there to account for what you and I can see right in front of us on this graph above.
With certainty, the temperature of the Pacific ocean(that has 2/3rd of all the heat stored in the entire ocean/atmosphere of the planet) and how much heat is coming out(or being stored) has a tremendous impact on the rate of global warming. Climate models do NOT know that because climate scientists don't program them with that information.
So climate models ASSUME that we should keep warming indefinitely like we did in the 1980's/90's when El Nino's were causing the planet to warm much faster.
Since the decades of massive El Nino's dominating(80's/90's) shifted to more La Nina's and less El Nino's ...........global warming slowed way down and even paused at times....after the Super El NIno ended in 1999 but climate models think that global warming should continue at the same rate..........because climate scientists program them that way.
Now you know the reason for global climate models to almost ALL be much too warm.
Look at it yourself below!
Congratulations............you're now smarter than a mainstream climate scientist!!!
They still haven't figured it out. At least about this one glaringly obvious flaw in their models that is causing them to bust. There are other, more complicated reasons but this one can be shown to anybody with an open mind.
Why is that?
They are so stuck on their theories and dynamical models of how the atmosphere is supposed to work based on physical laws in their books, using thousands of mathematical equations............that very few of them actually give ENOUGH weighting to the observations of the real world.........which is what meteorologists do for a living.
The proof above is INDISPUTABLE! Almost every global climate model of the main models used to predict temperatures to the year 2100 are too warm. .....and this is the latest and greatest, just updated model above!
They did great during the El Nino regime but have been busting badly since it ended at the end of the 1990's.
Models have been MUCH too warm since then...........and they WON'T correct them.
The smartest guys are not always the most open minded.
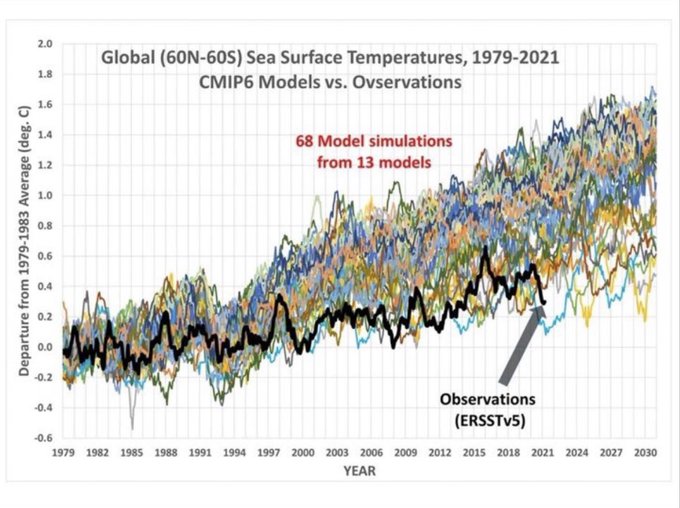
https://www.carbonbrief.org/cmip6-the-next-generation-of-climate-models-explained
Sounds/reads pretty convincing including their doctored graphs to make it look like the warming did not really slow down after the late 1990's. Trust me, it did I watched almost every day.
The graph below is a dishonest depiction of the temperatures and models.
It makes is look like the warming kicked in just after 1960 and has been on a steady, sustained incline with no pauses or slow down.
This Is misleading!

I prefer to use this source below. Note that the current global temperature in 2021 is LOWER than the peak/spike higher in the global temperature from 1999 on the graph below caused by...........THE SUPER EL NINO THAT YEAR and just look at the spike higher! It really happened on graph 2 below. On graph 1 above..........they wiped it out intentionally to mask the affect of the El Nino/La Ninas because they want you to think its entirely, 100% from CO2 increasing.
Their manipulated graph above makes it look like we just keep going higher almost every year and have left those 1999 global temps in the dust. These are the LOWER atmosphere temps below. They are not affected by things like heat islands around cities that alter the accuracy of surface measurements. It doesn't start until 1979 because the data comes from satellites. The technology to accurately measure temperatures and report in this form did not exist before 1979!
https://www.marketforum.com/forum/topic/75694/
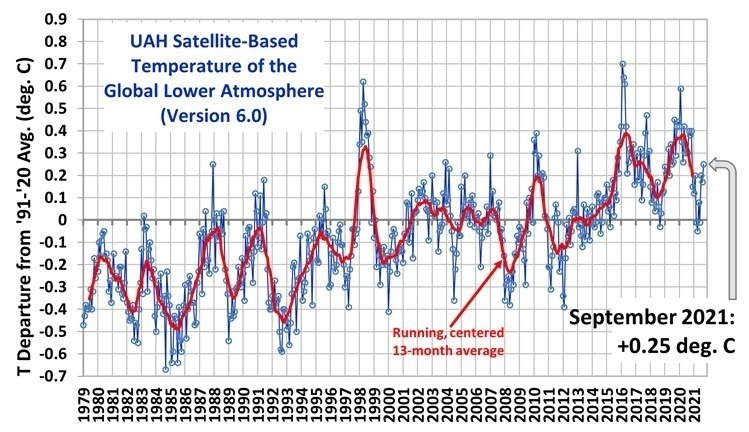
Beside the super El Nino that caused the temp spike in 1998/99, we also had another SUPER EL NINO in 2016. Which of the 2 graphs displayed on this page shows the huge, rapid spike up from those events best?
Wow: informative to say the least, yet simple, concise, and factual.
Thanks again Mike !
YW kris.
I love doing this and you got me started........thanks!
MetMike/Kris
Many thanks for a very interesting read. I would not say it is completely SIMPLE, but I do feel comfortable about politely disagreeing with the 'global warming idiots'.
LA Nina, much below at the Antarctic (they only seem worried about the Artic), and 'mere' weather cycles never seem to be recognized by these 'experts'.
Mike, is it possible to 'speculate' (much like the Farmers Almanac) as to what type of weather to expect from Nov to March in the different regions of the USA?
On a 'crazy', do others notice an abundance of acorns and walnuts this year? Nature providing for a 'bad' winter?
Now, time to reread---thanks again!
Tim
Interesting point tjc!
The oak tree on our front lawn has had more than double the amount of acorns that I can remember in many recent years.
I'll check on this though because it could be related to a natural cycle, as well as the best growing season weather here in southwest IN ever.
8pm: I created a new thread to discuss this topic for you tjc. The amount of extra acorns this year is partly related to the perfect weather with CO2 continuing higher and a natural cycle more than anything. It's called a Mast Year.
Why are there so many acorns this year?
4 responses |
Started by metmike - Oct. 17, 2021, 8:15 p.m.
Scroll down for the latest!
The best technology has already accurately measured how much additional heat that CO2 is capturing.........and its only 50% of what is being programmed into the models.
Here's another piece of authentic science that will make you smarter than a mainstream climate scientist. They don't want to admit their models are too warm. Their projections go out to the year 2100........so they never have to be held accountable for being wrong. ...........like meteorologists do when we bust the weather forecast.........which happens all the time (-:
Climate scientist's are actually extremely intelligent people. And they are highly educated......some based mostly on BOOK knowledge about theories and mathematical equations. However, many of them have a weakness because they don't actually observe the REAL atmosphere every day and apply that knowledge..........they already know what the atmosphere is supposed to be doing............for the next 100 years (-:
Profound: Smoking Guns!! Proof with accurate 2 decade long measurement of the actual amount of radiative forcing caused by CO2 of 1 irrefutable reason for WHY global climate models continue to be too warm. Climate emergency is really about social justice and brainwashing people. Even MORE confirmation that climate models overstate atmospheric warming. Models clearly too warm yet incredibly programmed to get even HOTTER! Now, even more confirmation why the models are too warm. August 2020 https://www.marketforum.com/forum/topic/57636/
I went to school with these people so I know that alot of them are more intelligent than me. They got better grades and went on to get PhD's because they were so brilliant at book smarts.
The lesson here is pretty simple. A closed mind, no matter how intelligent and how educated is often just recirculating what it thinks that it knows and sometimes rejects items that don't match up with its preconceived notions.
An open mind, on the other hand is more sincerely practicing the scientific method which compels the scientist to always be questioning why they might be wrong, instead of looking mainly at reasons for why they are right.
Intelligence/IQ determines the potential rate that a mind can learn at.
Open mindedness and discernment are often the biggest determinants of the REAL RATE of learning.
Here's the latest on the La Nina.
We're exactly on track with the forecast from early this year. La Nina WILL continue this Winter and we knew this with high confidence for the last few months.


For a review of what this means, start up here and scroll down: