The S&P 500 futures has tonight broken down below 4400, below trend line support and below the 50 day average.
Edit sorry I meant to post in trading
Ive been trading alot of the e- micros. I shorted the dow last friday,been holding on$$$
Over the last few months, the SP has shown a 4-5 week cyclical pattern. I had hoped that this moving average line would hold again, as it has done before… but it didn’t
This neat (up-trend) pattern is obviously over.
PS
I have been using the exponential 55-day line (Fibonacci number)…. Check it out and see how well it worked on the S&P during that time
Got it fixed for you cutworm!
Thanks for the great post and comments.
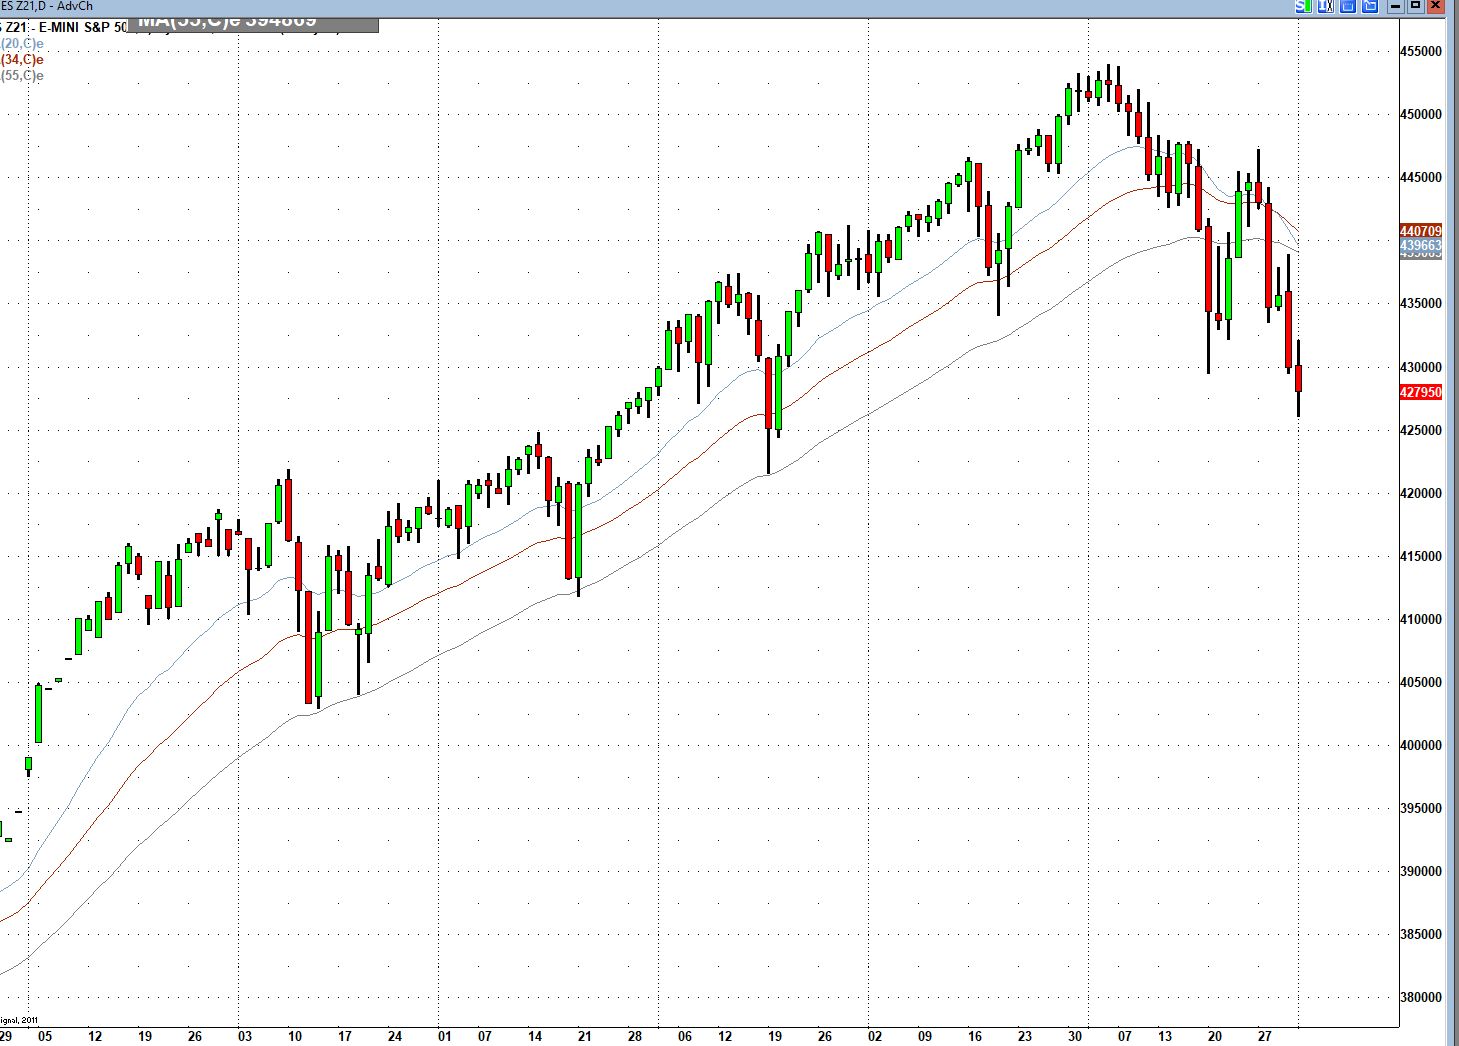
The 4-5 week cycle is still showing up.. It seems to have bottomed Monday, Sep 20, and is now in its “upward phase”
During the time frame shown in the graph below, the first 3 patterns had their peaks shifted to the right of center… which is what cycles do when they ride on top of an uptrend. (“right-translation”, as Jim Hurst used to call it)
If we are indeed at the beginning of a downtrend, it would manifest itself by seeing the top of the current cycle shifted to the left of center (meaning a somewhat shorter run-up, followed by a more prolonged downward phase).
Please remember, that cycles come in a large variety of lengths. Even what we call an “up-trend” is nothing but a section of a large cycle.
Most importantly,the dominance of cycles comes and goes.This current 4-5 week cycle will eventually lose its strength and fade away, making room for other cycles or seeming randomness.
Please don’t consider this post as a trade recommendation
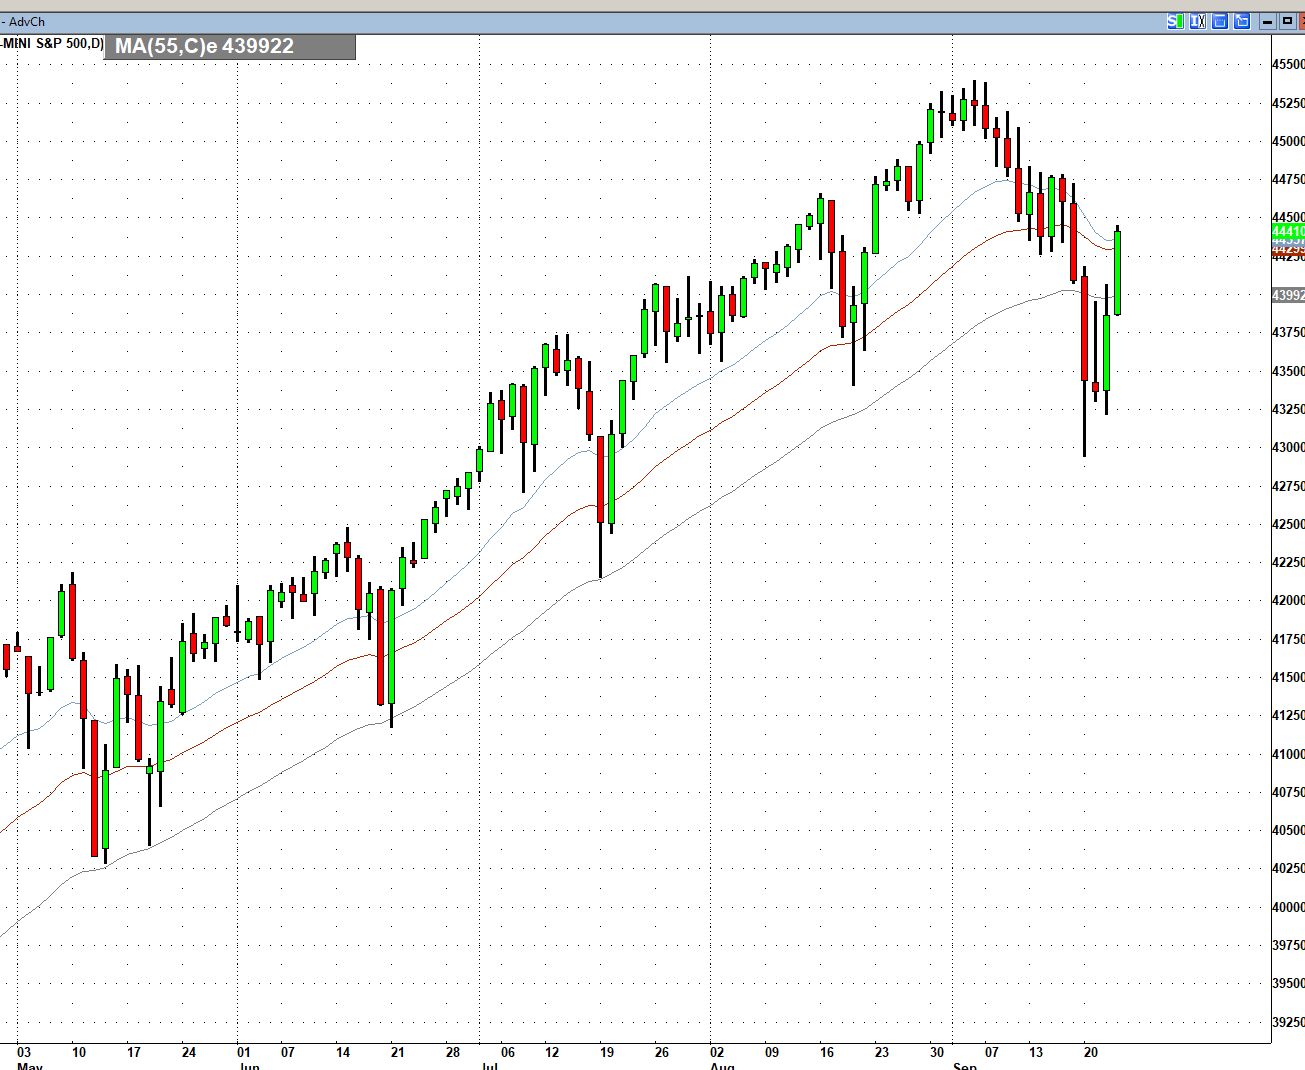
Chart courtesy of Esignal
This is a wonderful contribution Gunter!!
Thanks so much!
update..
the recent low on Sep 30 seems to have been the bottom of the last cycle...
Ideally, we would now see the opposite of the pattern on the way up, with peaks now being shifted to left of center....which is what we are possibly looking at right now..
Warning.... in real life, things don't always work out as you expect them to
Good luck in your trading!
EDITED:
I apologize for the typo… I wrote…
“the recent low on Sep 30 seems to have been the bottom of the last cycle...Ideally, we would now see the opposite of the pattern on the way up, with peaks now being shifted to left of center....which is what we are possibly looking at right now..”
The date should have been Sep 20 (not Sep 30) for the last bottom of this cycle… that’s why I stated that the recent bounce up to Sep 27 could be the mirror image of the “right-shifted” tops on the way up…. with more down action to follow.
https://marketforum.com/forum/topic/75563/
Posted a chart yesterday, it will be interesting to see it all play out .
thanks kris... I didn't see your post until right now. I am also a big fan of retracement calculations. Thanks for the input.
As I am writing this, today's bar on my earlier posted chart has already turned green. lol
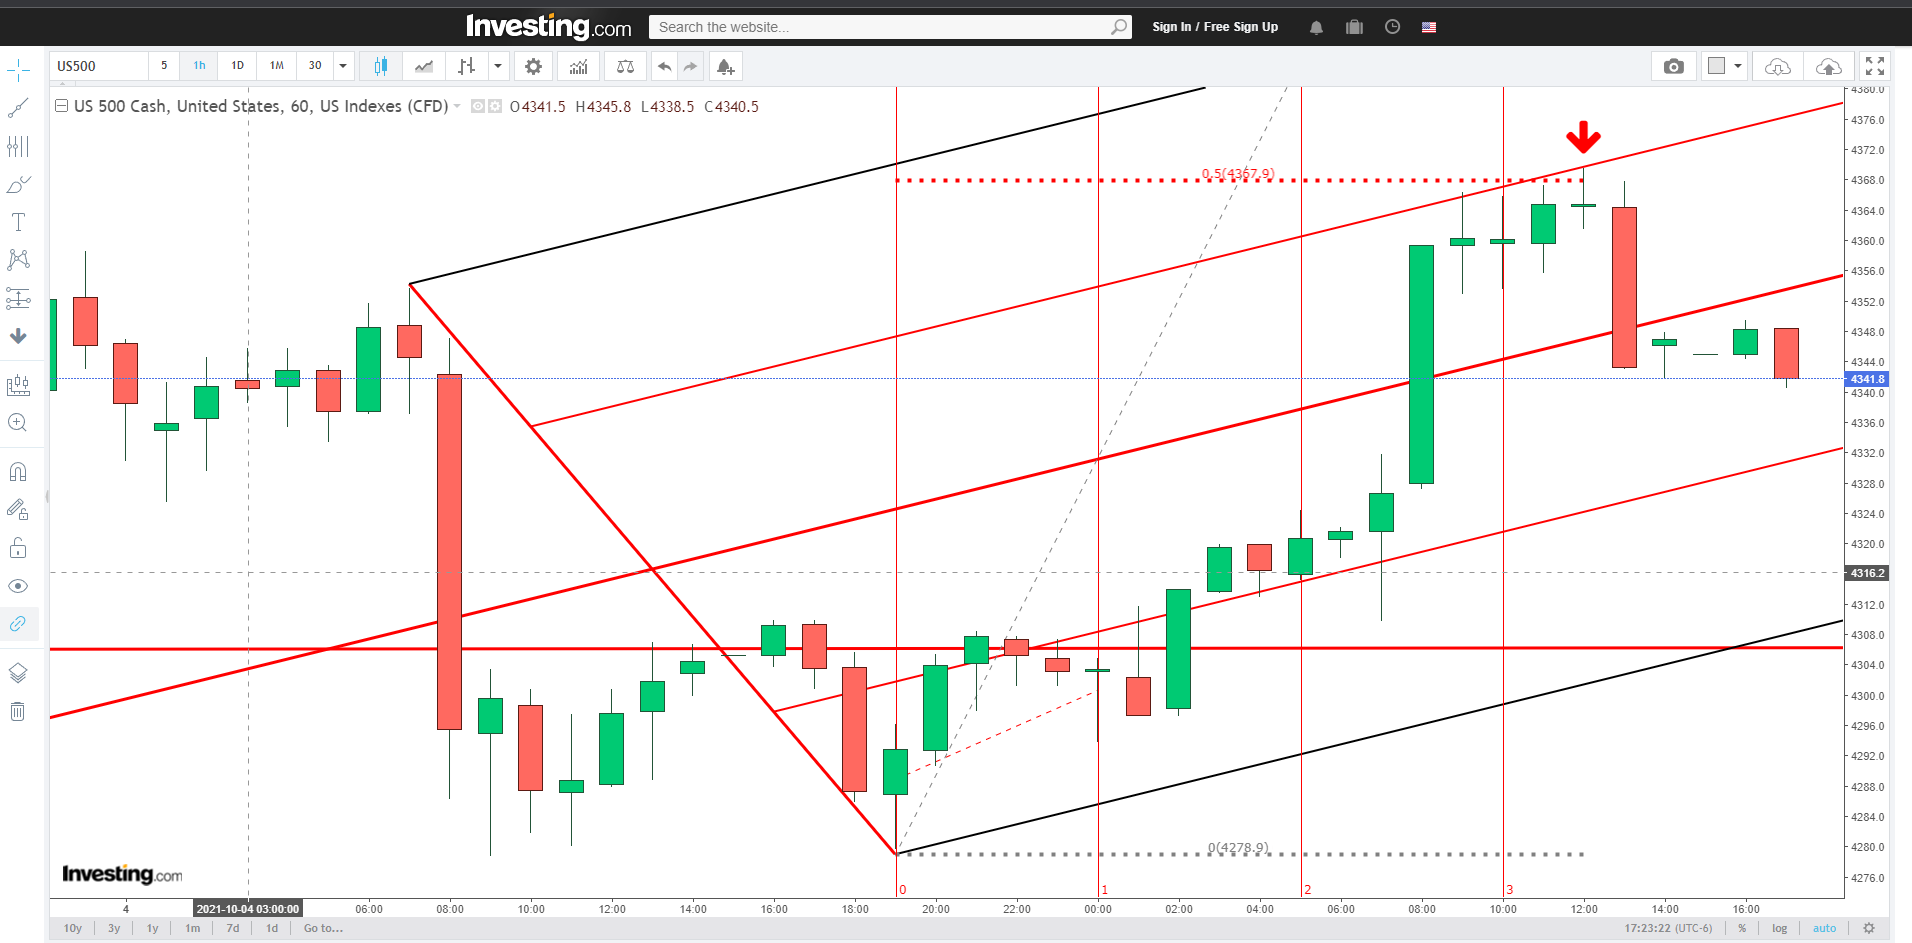
Current situation:
1)after breaching the .50 & 0.786 support
2)the market rallied to another confluence; resistance at the 0.382 & 0.50 from the previous highs (ain't the market nice?)
So now we have two proverbial "lines in the sand", time will tell which one holds and which one folds (re: Kenny Rogers ?!?)
If we get what is called a "second time through" the previous support zone then we will see more downside imho.


"second time through" now in progress ...
The down move terminated (for now?) at the 4.236 extension from the ABC early session top
That extension often marks the end of a move and is a reliable counter trend indicator

Great stuff kris.
Got anything new kris? Gunter? TIA
https://vantagepointtrading.com/stock-market-seasonal-trends-sp-500-seasonal-trends/
The stock market has seasonal tendencies, and we can see them by looking at the following seasonal chart of S&P 500 futures.
S&P 500 Futures Seasonal Chart- 15 and 37 Year

https://www.investopedia.com/articles/financial-theory/09/october-effect.asp
October gets a bad rap in finance, primarily because so many black days fall in this month. This is a psychological effect rather than anything to blame on October. The majority of investors have lived through more bad Septembers than Octobers, but the real point is that financial events don't cluster at any given point.
1) The hourly moved up to a 50% retracement which coincided with 50% line in the pitchfork.
2) We went through the 4304 support zone twice now and just maybe third time will be the charm ?
Here is another example of the 4.236 extension at work.
From the late afternoon ABC the market stopped dead in its' tracks at the extension point.
That level has now turned from support to resistance in the night session

We have a .707 and .786 retracement level coinciding with a 2.618 ABC extension, all within 1 point from one another.
Possible the market may dip down into it and reverse, if we get that low ...

Thanks kris,
That was a treat. Makes me wish that I traded the S&P (-:
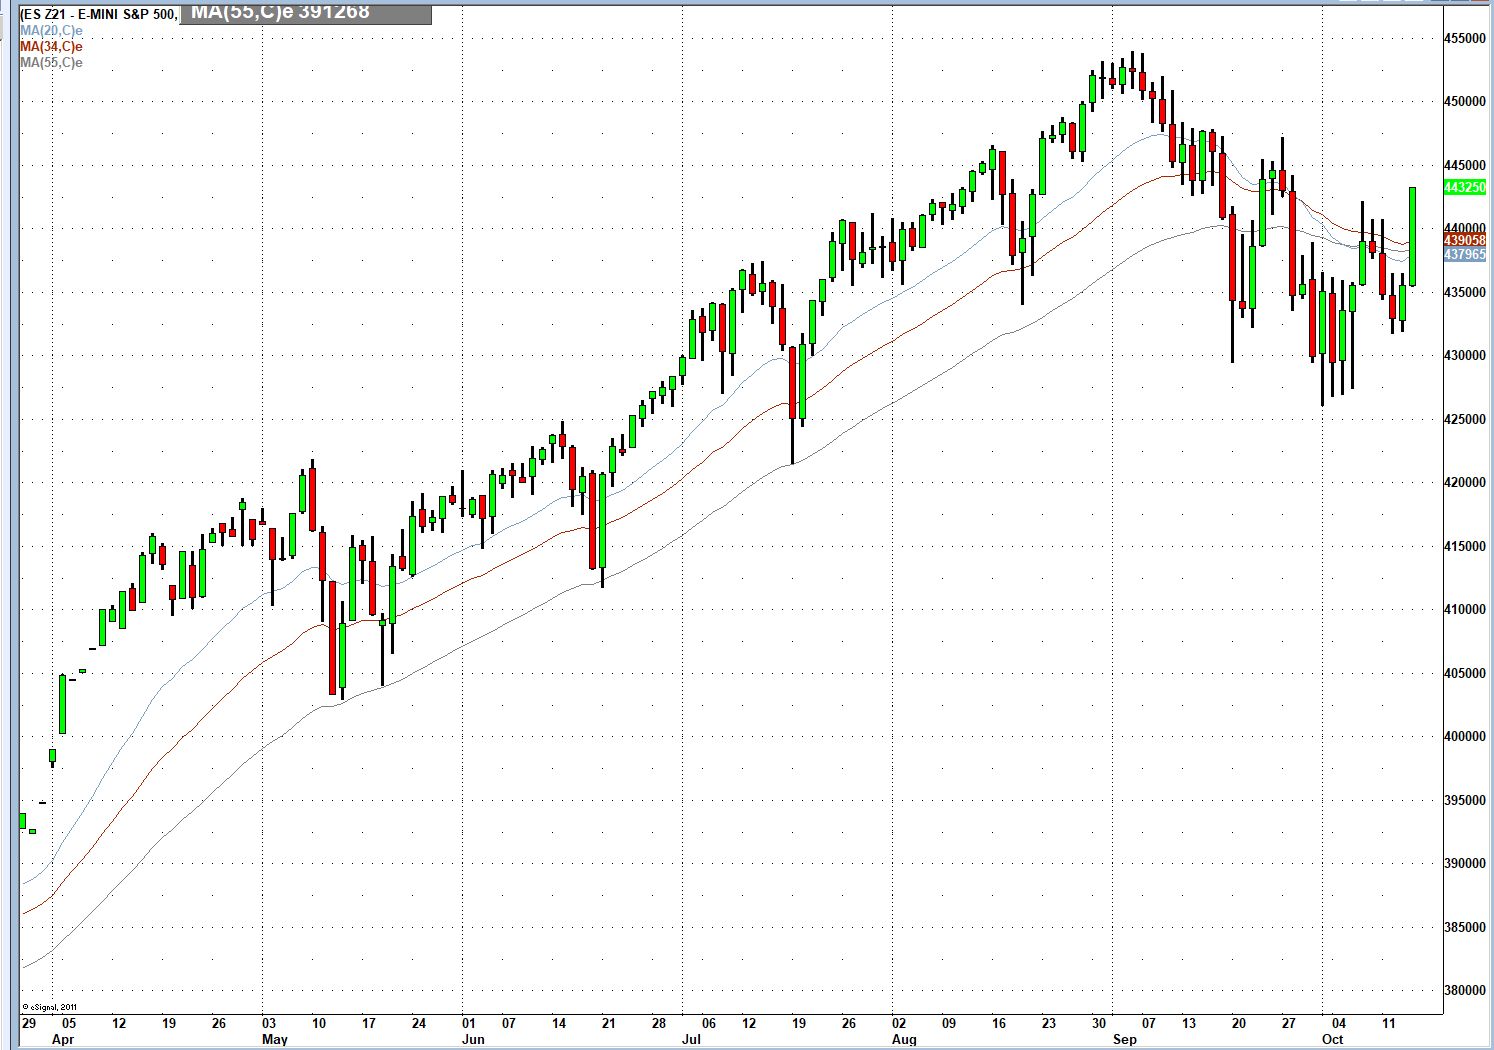
Since I posted some charts on the S&P,I feel compelled to follow up with an update.
Since May, we saw a remarkably repetitive patterns of a 4-5 week cycle on the way up. Three of these patterns also showed a somewhat unusual strong shift of the top to the right of center.
The following cycle, which peaked at the beginning of September, had its peak in the center of this cycle… an indication that the uptrend might be over.. followed by a bottom on September 20, which was below the bottom of the previous 4-5 week cycle.
I then speculated that (under ideal conditions) there might be a mirror image of the uptrend on the way down….with the tops of the cycles shifted to the left of center.
This idea of a mirror image was voided on Oct 7, (5 bars to the left of today's chart), when a remarkable rebound occurred, that took prices above the moving average lines. Even though this run-up was lower than the first top of this cycle, (still pointing at a possible downtrend), it was now clear that we would not have a mirror image of the move to the upside.
Yesterday, a solid green bar developed. In addition, on the equivalent chart of the Dec Dow, futures, a 12-day cycle bottomed…. all this led to the strong move today.
At this point, it is quite clear that this 4-5 week cycle has lost its dominance, and we are dealing with another set of cycles.
At the moment, it looks like we are going into a trading range, rather than a downtrend…..which, IMHO, is not bearish.
HEY, WHO SAID YOU COULD POST HERE(-:
Totally kidding, Gunter. Glad to see you and thanks for the great chart/analysis.
I'm ok also with you posting again in the NTR forum too, instead of waiting until the end of October.......if that's what you want to do.......up to you.
You can make what you want of it.
The points have been made to death in the last several days and I assume you either understand them or don't and another 2 weeks won't make any difference.
Appreciate this great positive contribution which you have always been more than capable of focusing on.
Agree Gunter, unless it starts raining ordinance on Taiwan we won't see a downtrend developing (even then: wars tend to be bullish for the markets)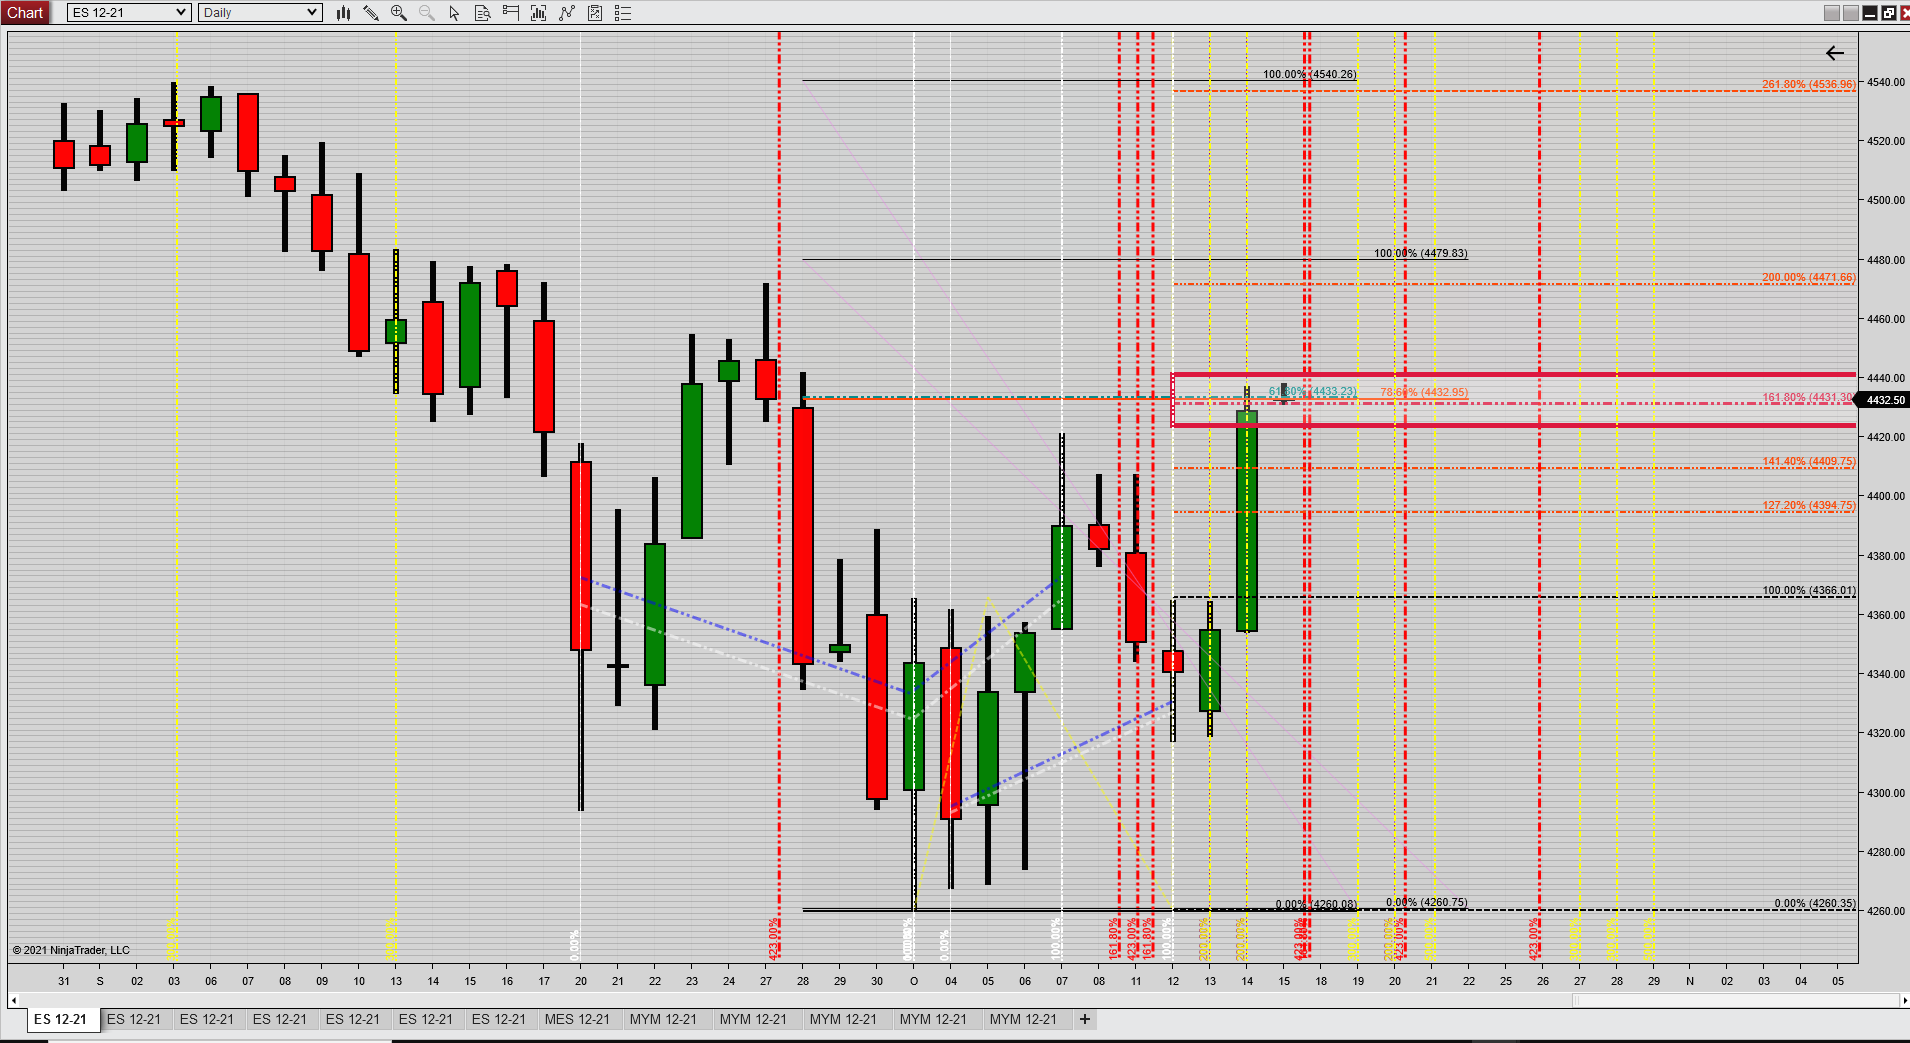
The first week of October was "base building", today's up thrust was/is something to behold, we stopped a few points above an ABC 1.618 extension from the low and a 786 and 618 retracement level from above, unable to close above it during the day session and the after hours market is taking a breather below those levels.
If tomorrow is a high then I can see Monday as a low and vice versa.
Within that window identified on the daily chart posted above and going to a five minute chart we can identify several levels where a trade could present a profitable possibility :
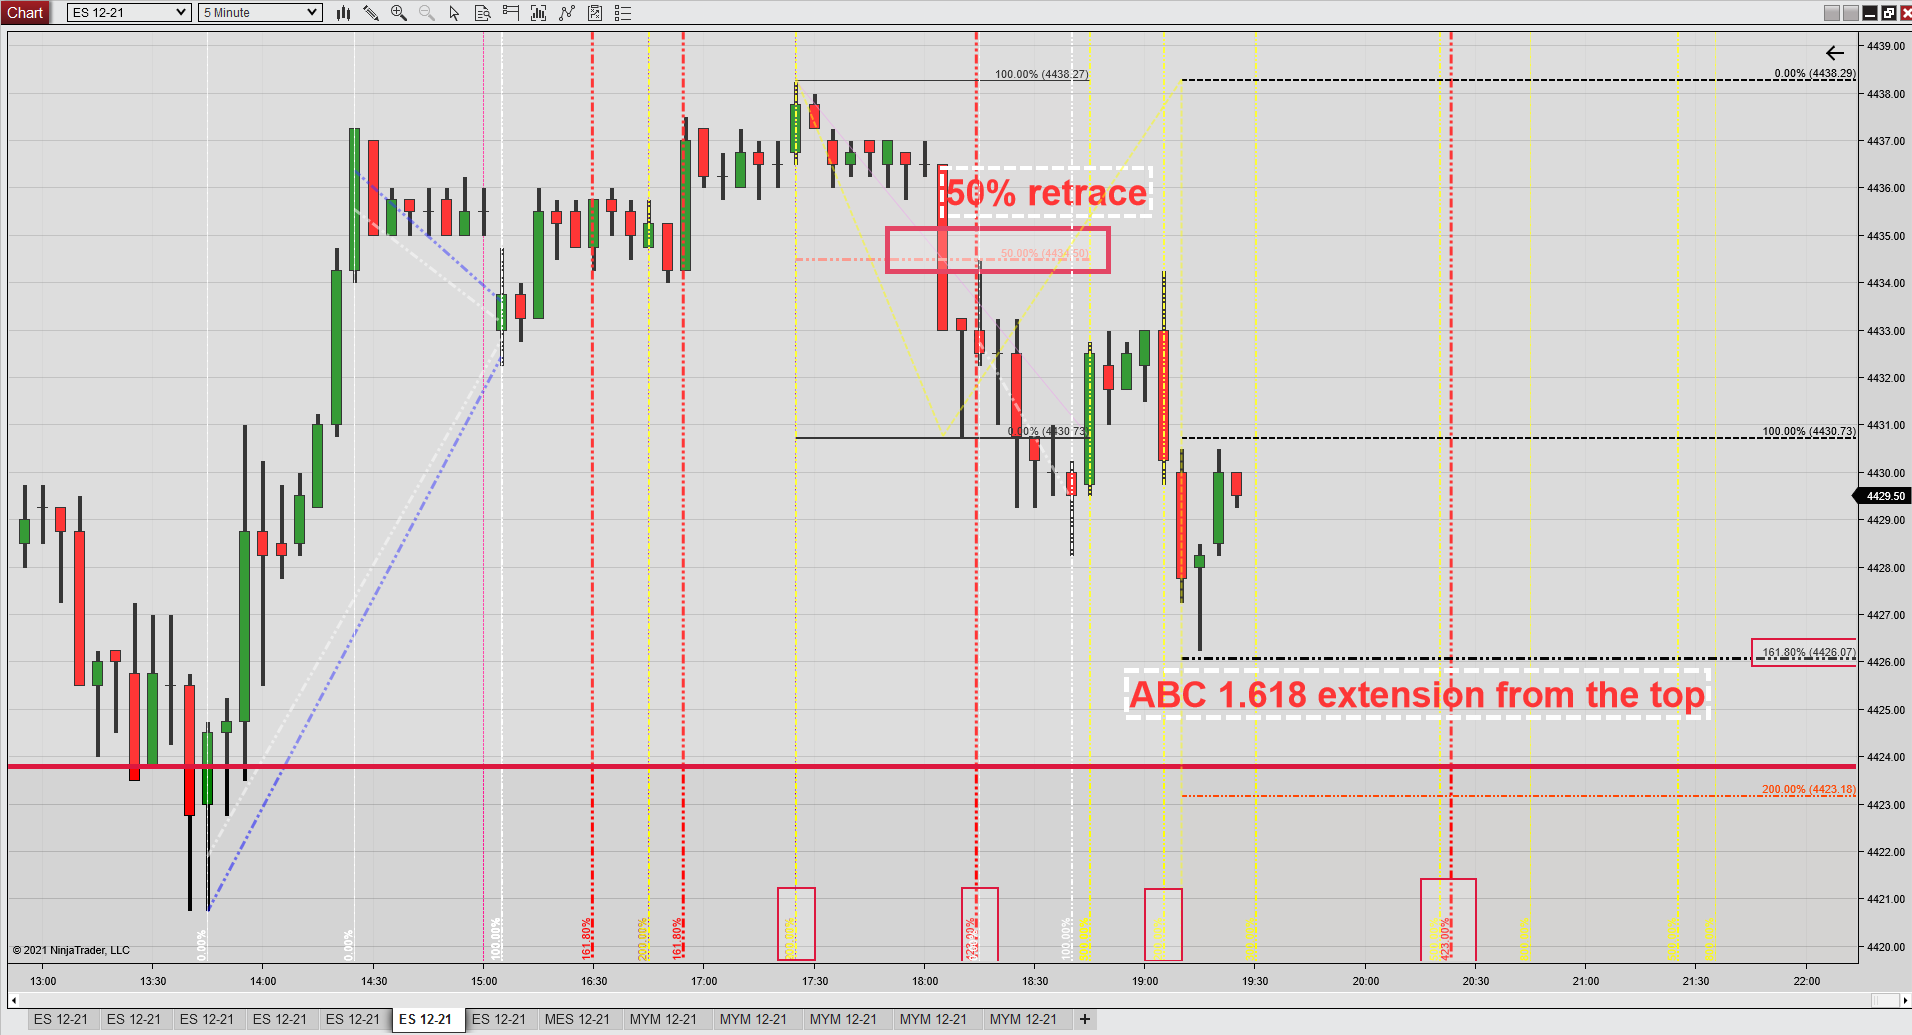
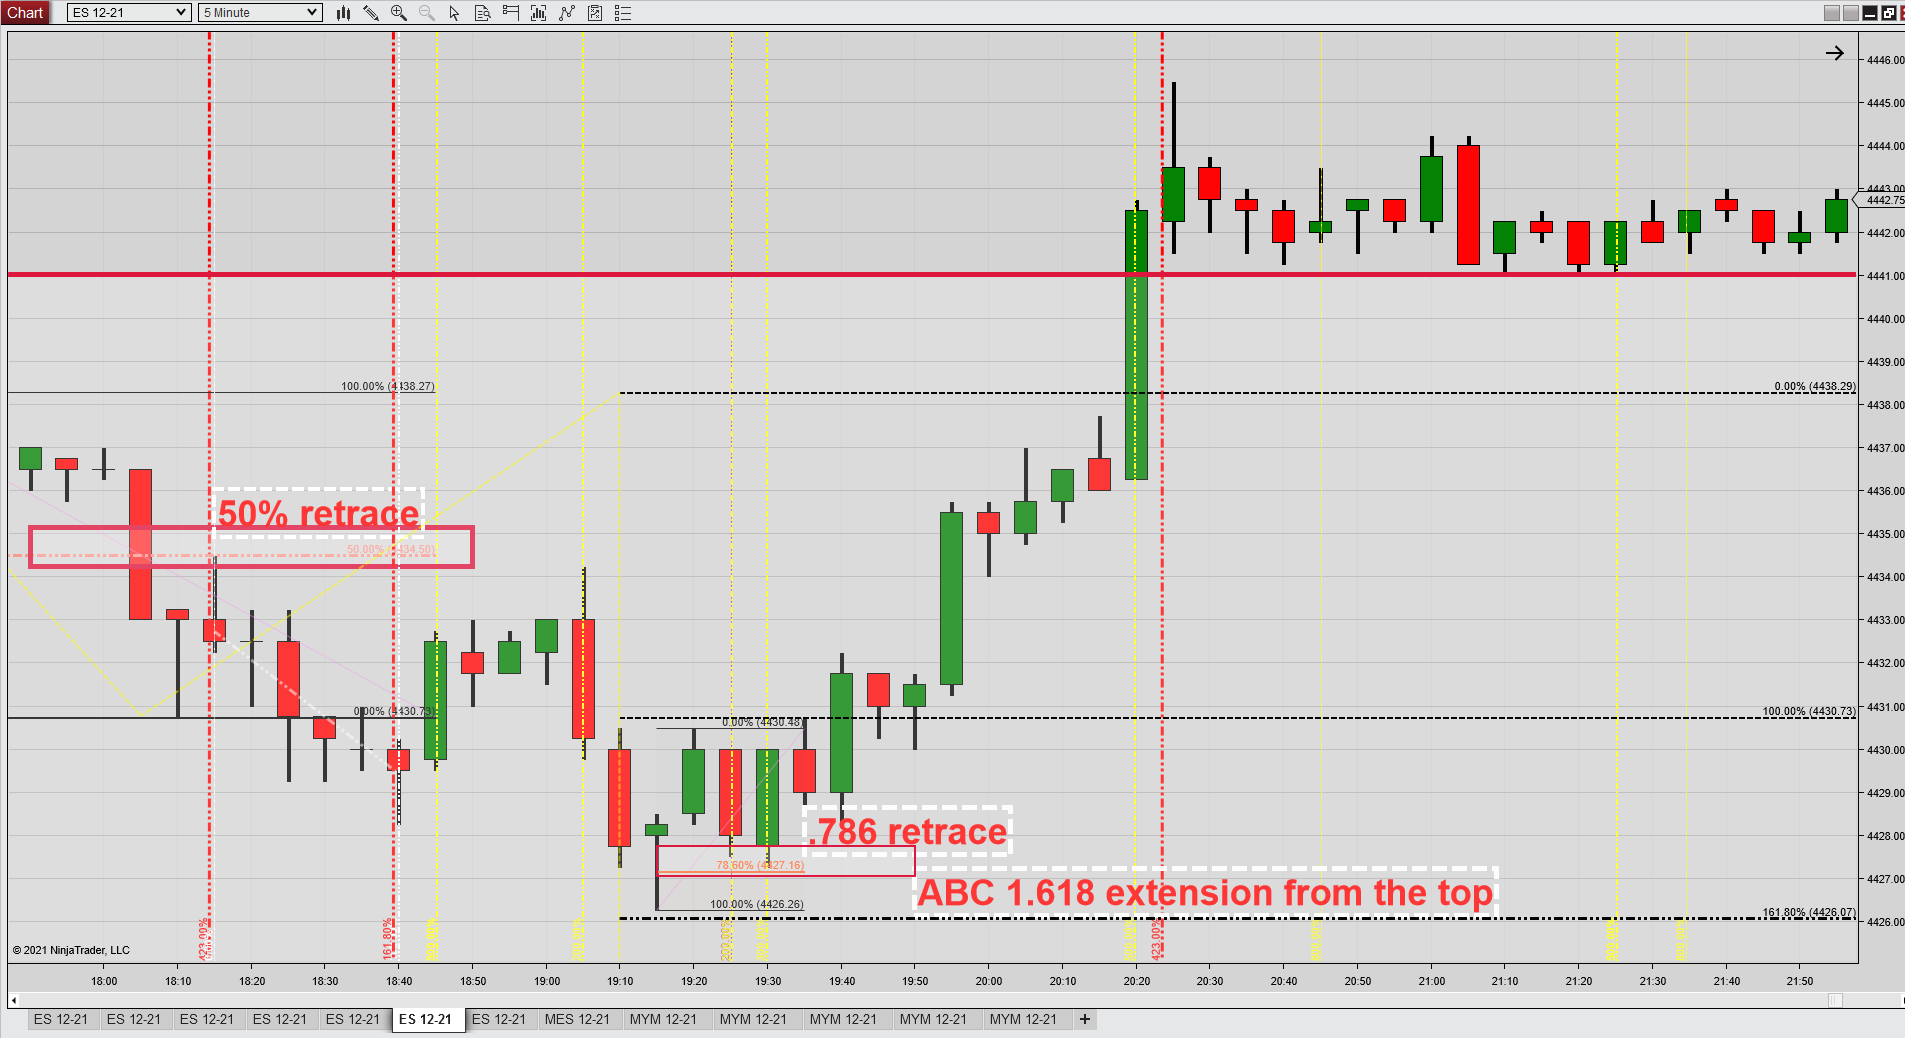
That 1.618 dip in the early night session I mentioned yesterday (previous post) held up, it was followed by a .786 retrace and we were off to the races afterwards:
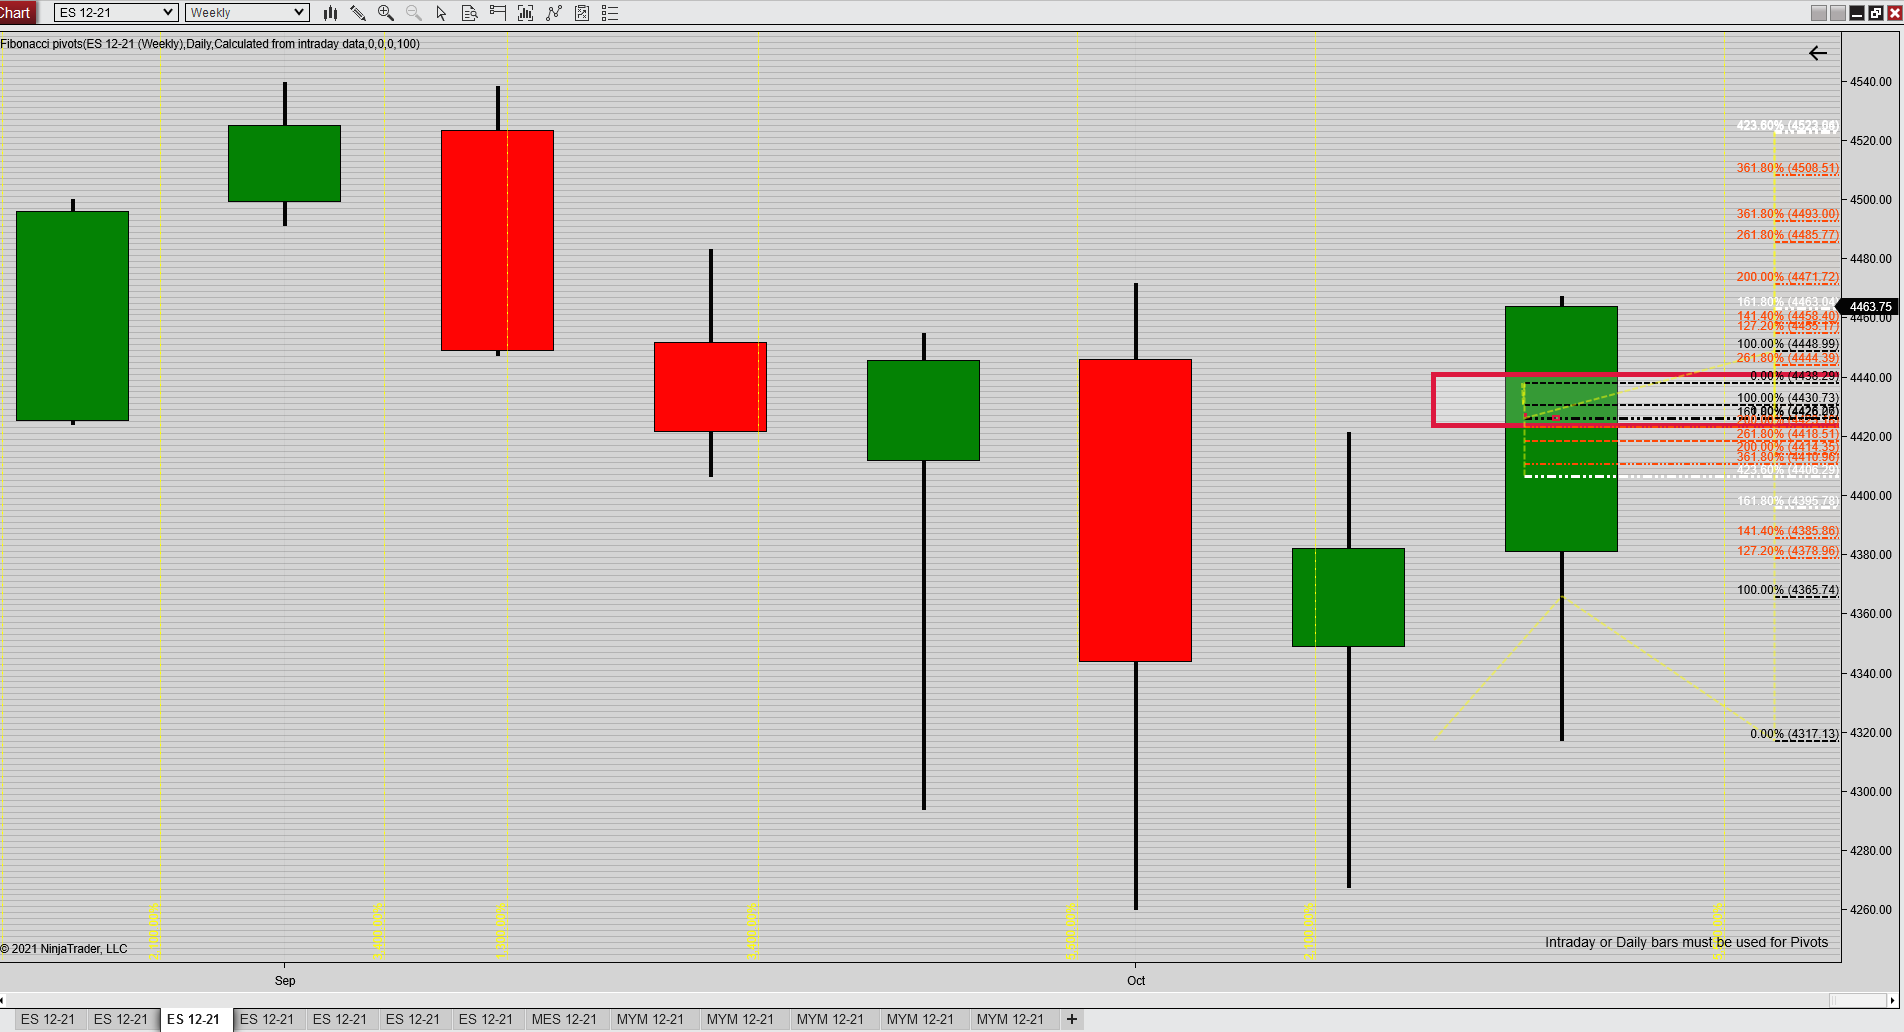
The weekly shows a solid green candle, I show major resistance at 4480 and again at 4523 (close to a potential double top)
The market may retreat first either Monday or Tuesday, just my take.
Meanwhile, in the night session the ABC extension @ 423.6 put another stop to the decline, plus some other interesting levels :

Wonderful stuff.......thanks kris!
We actually have quite a few "lurkers" that read here but choose to be observers rather than participants that comment. Which is great too, even if comments are the best.
Happy to share some material Mike, hope it inspires some folks.
As for today: we reached the resistance at 4480 which I mentioned in a previous post (786 retracement from the all time high).
Aside from that resistance point I had today pegged as a turning point from a time standpoint, I have a 423 and a 1.618 extension sandwiched around the 10/18 candle as per the chart below.
We'll see how it all plays out. Night session slightly lower (so far)

Speaking of the 4480 resistance level, the final leg up on the 5 minute chart today pointed at the same price point with a 1.618 ABC extension :

https://www.marketforum.com/forum/topic/75137/#76360
Looks like our old friend the hammer candle and in this case a hanging man formation.
Like you said, we'll see what happens kris. Thanks much!
https://ninjatrader.com/blog/what-is-a-hammer-candlestick-chart-pattern/

After the night session opened the market quickly exceeded the last high of the day session and put in a double bottom ABC, from there we paused briefly at the 141.4 extension as Europe opened up.
From there we went to a 261.8 extension prior to the day session open, we declined to the 50% retracement of the overall session in combination with another 261.8 extension (down) from that ABC.
The morning ABC got us just shy of the 1.618 extension and we are currently working on a possible bear flag which may bring some additional decline:

The potential bear flag I mentioned in the previous post was a bust.
We did go up to the afore mentioned 1.618 ABC extension level and declined for about six points from there.
We then went up to the 200.00 extension from the same ABC and retreated.
Market stalled at a confluence of 50 & 38 retracement levels coinciding with a 423 time extension.
Time will tell if we started a wave 4 down or do we have to go higher first, prior to starting wave 4 ?

Thanks again kris,
Since your charts continue to use Fibonacci and E-waves analysis/levels, can you please explain it and why you think that it works so that readers will understand what you are doing and the projections?
Rather than me, somebody that does not actually use these indicators and who doesn't trade the financials, copy stuff about it, readers may be better served to find out what your views are because you use it.
I believe that some of the affect from this and other technical trading is a self fulfilling prophesy in the minds of many thousands of traders at the same time.
When enough people using the same system believe a level is good support/resistance or a key buying/selling level that results in enough of them acting on it at the same time and it causes that level to act exactly like they expected.
Traders using similar systems/indicators can drive technical reactions.
Do you agree with that?
Thanks Kris you say it so well that i can't find much to add
Thank you gentlemen, I'll start a new topic on this fibonacci stuff and explain my use and way of thinking.
This last session still in progress:

A serious dip this morning, just a dip or the start of something bigger ? Hmmm ....

Thanks kris!

Day of the 786es:
1) soon after the open we had a 786 retrace propelling the market up, the shallow extension didn't last long ....
2) the ensuing down move morphed into a 5 wave decline terminating at the 786 retrace from 10/20 low and today's high
3) we went higher throughout the morning to once again hit a 786 h/l retrace from the entire session
4) we went lower from there hitting another 786 on the way down
5) I have seen this movie before where low of day is a 786 then retraces to the high of day 786 and settles somewhere in the middle
6) more often than not: when either level is breached there is usually a swift and sharp follow through ....

Hi kris and everyone.
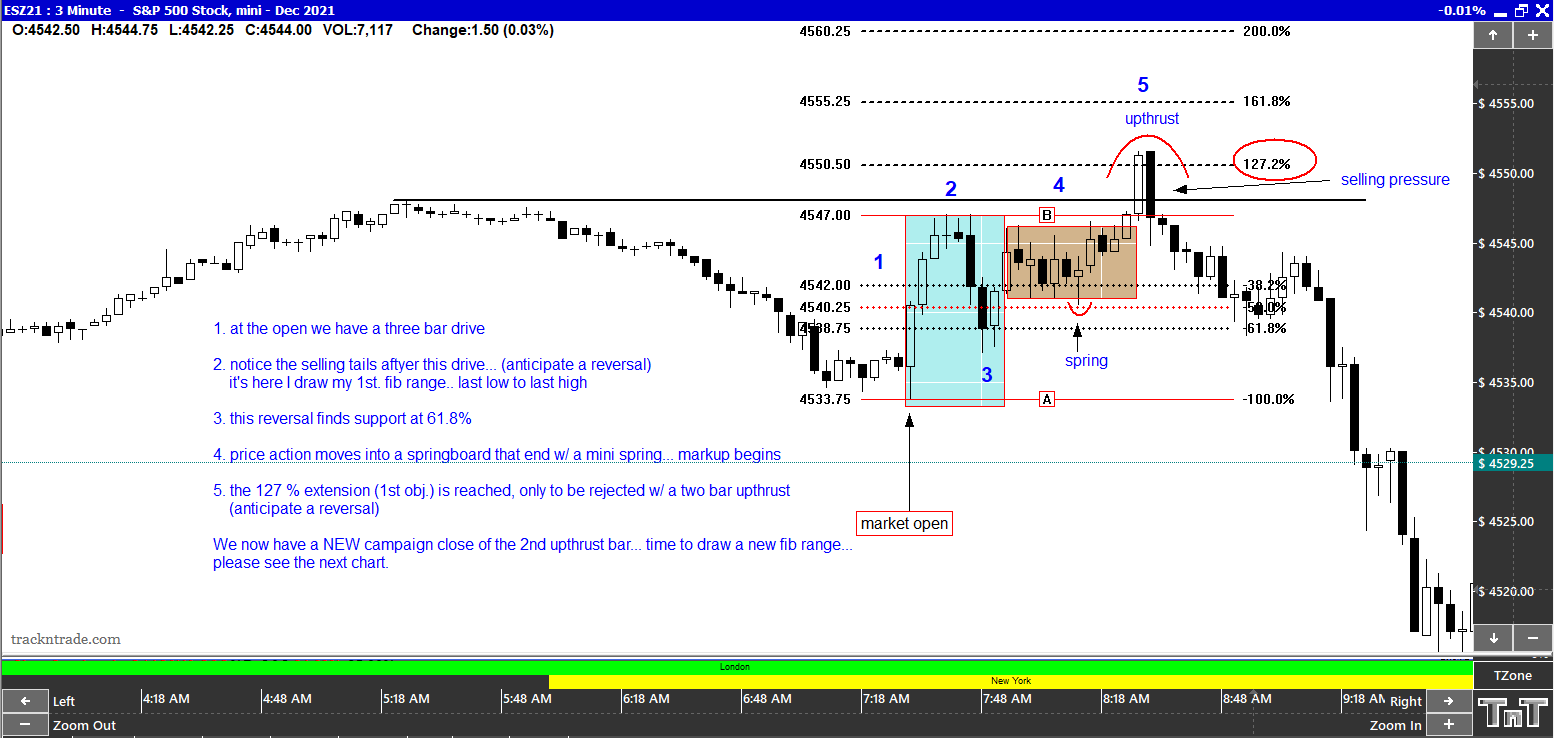
I'd like to share with you guys how I use fibonacci. I read price action in combination w/ fibonacci. In my opinion one can't use fib. as a stand alone tool without first understanding price action. Fib. retracements & extensions (in my view) are areas of future support & resistance areas. Nothing more. I believe the smart money guys use them to control price action, so I must attempt to follow there campaign - manipulation.
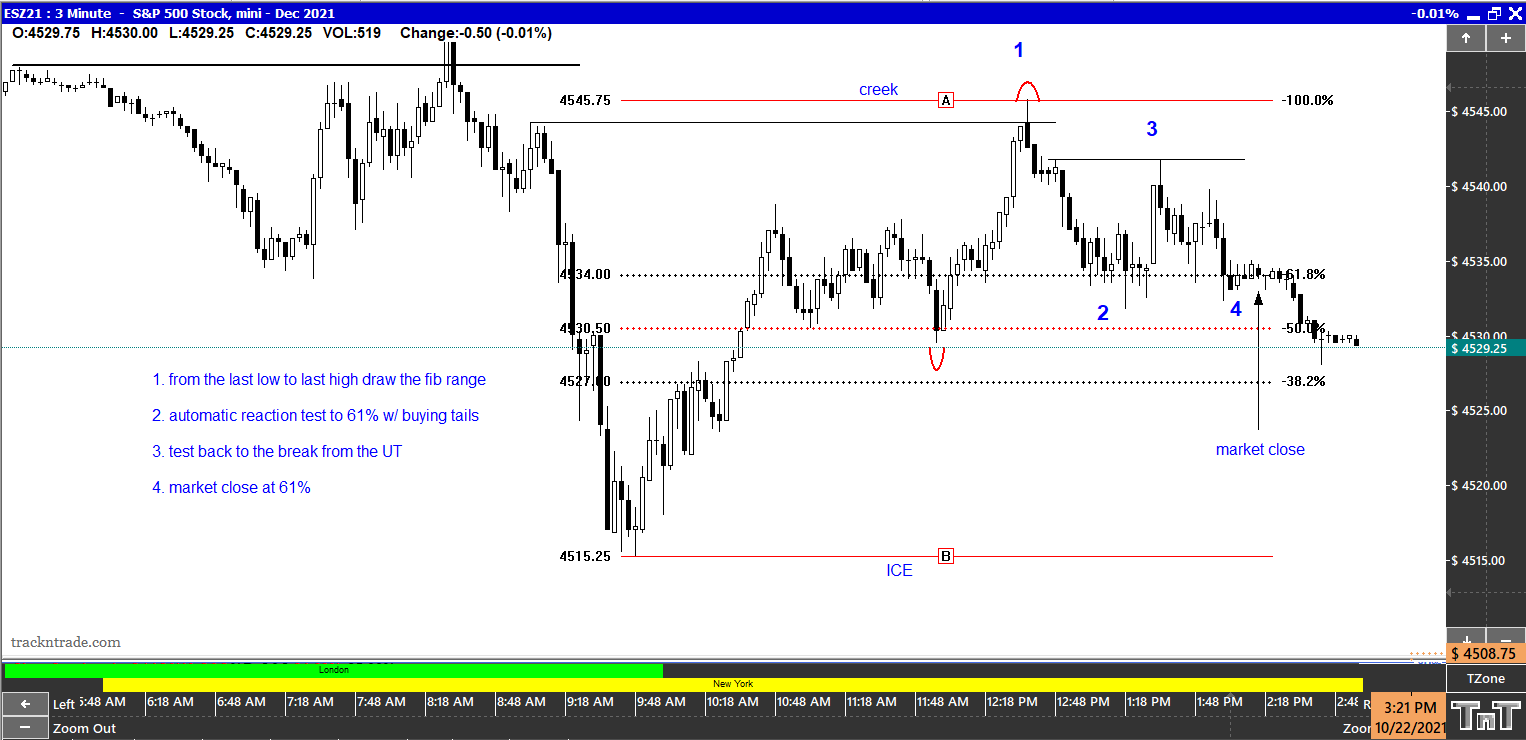
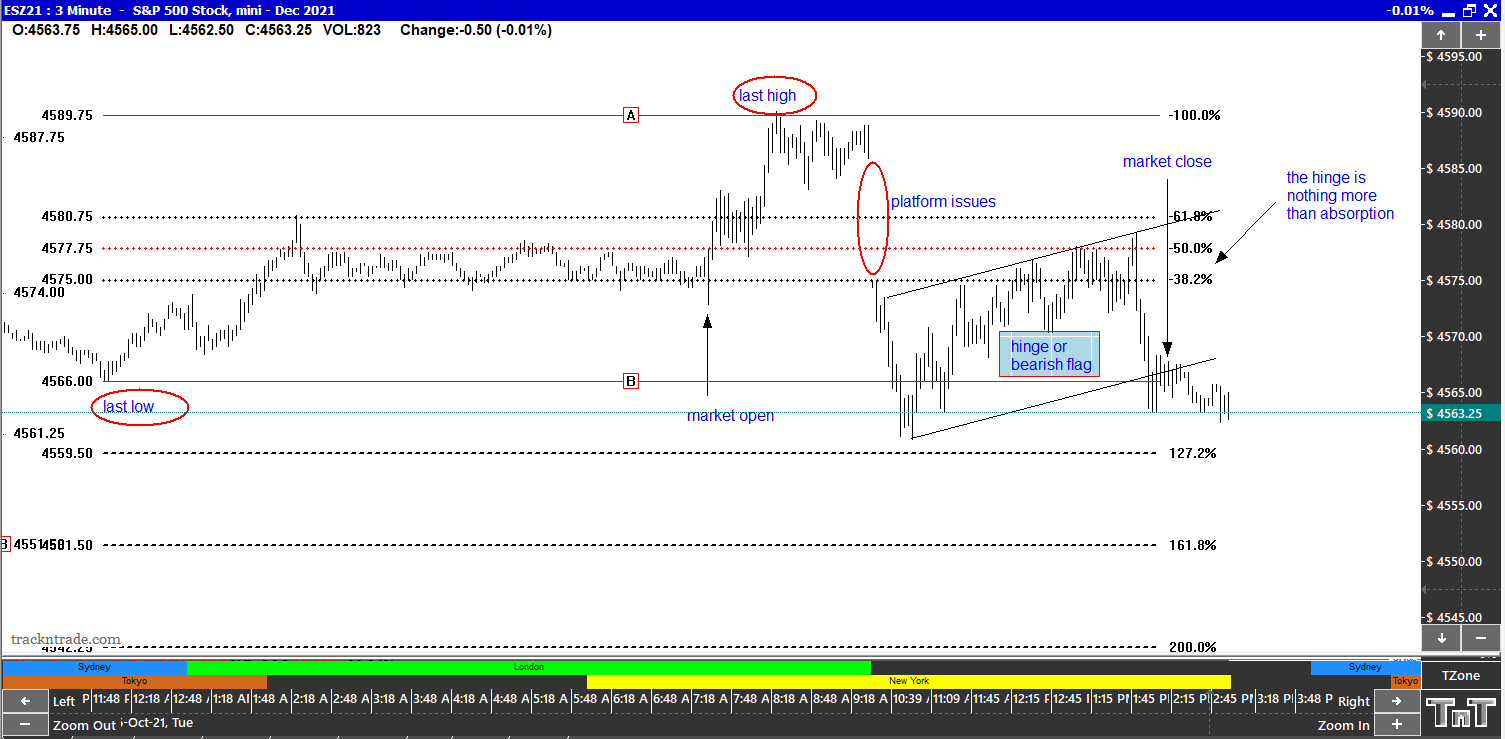
Below the 1st. chart - Friday's market open. The next 3 charts. I hope to explain, to some degree, how I follow there manipulation.
Second chart.

Third chart.

Last one will be at the market close.
A small peak into what I do each and every day.
Great to read you gedigen!
And especially for providing some profound analysis/explanations to open more eyes to what your trained eyes can see. This is what the trading forum is all about!
Thanks for sharing Gedigan. Observations:
I'd like to share with you guys how I use fibonacci.
I read price action in combination w/ fibonacci. In my opinion one can't use fib. as a stand alone tool without first understanding price action.
100% agree
Fib. retracements & extensions (in my view) are areas of future support & resistance areas. Nothing more.
100% agree, I just call those "confluences" or "inflection points" when two or more come together, ideally with a time extension as well
I believe the smart money guys use them to control price action, so I must attempt to follow there campaign - manipulation.
Frankly: I don't worry about those guys, or anyone else for that matter; the PPT, A.I., the "Bots", the "big guys", if they're all conspiring to make our lives difficult I don't see it.
Thanks again for sharing and may your trades be profitable Gedigan !
The overnight session once again went down to a 786 retrace level, this time combined with a 1.618 ABC extension, new highs a possibility? Wait and see ...
Kris,
I find it interesting we both use fibonacci.
I too had support in the overnight as noted by the arrow on a 2 hr. chart.
The 200% is fast approaching - 4584.75.
Best of trades to you as well!!

Interesting indeed Gedigan;
4583 bagged and tagged,
After the open there is currently a disconnect between the ES and YM, standing aside till they get back in sync ....
Trading is only as difficult as you make it. Forget bias & follow price action. My best advice.
Today's high given on the chart below.
The reaction chart I'll show next.
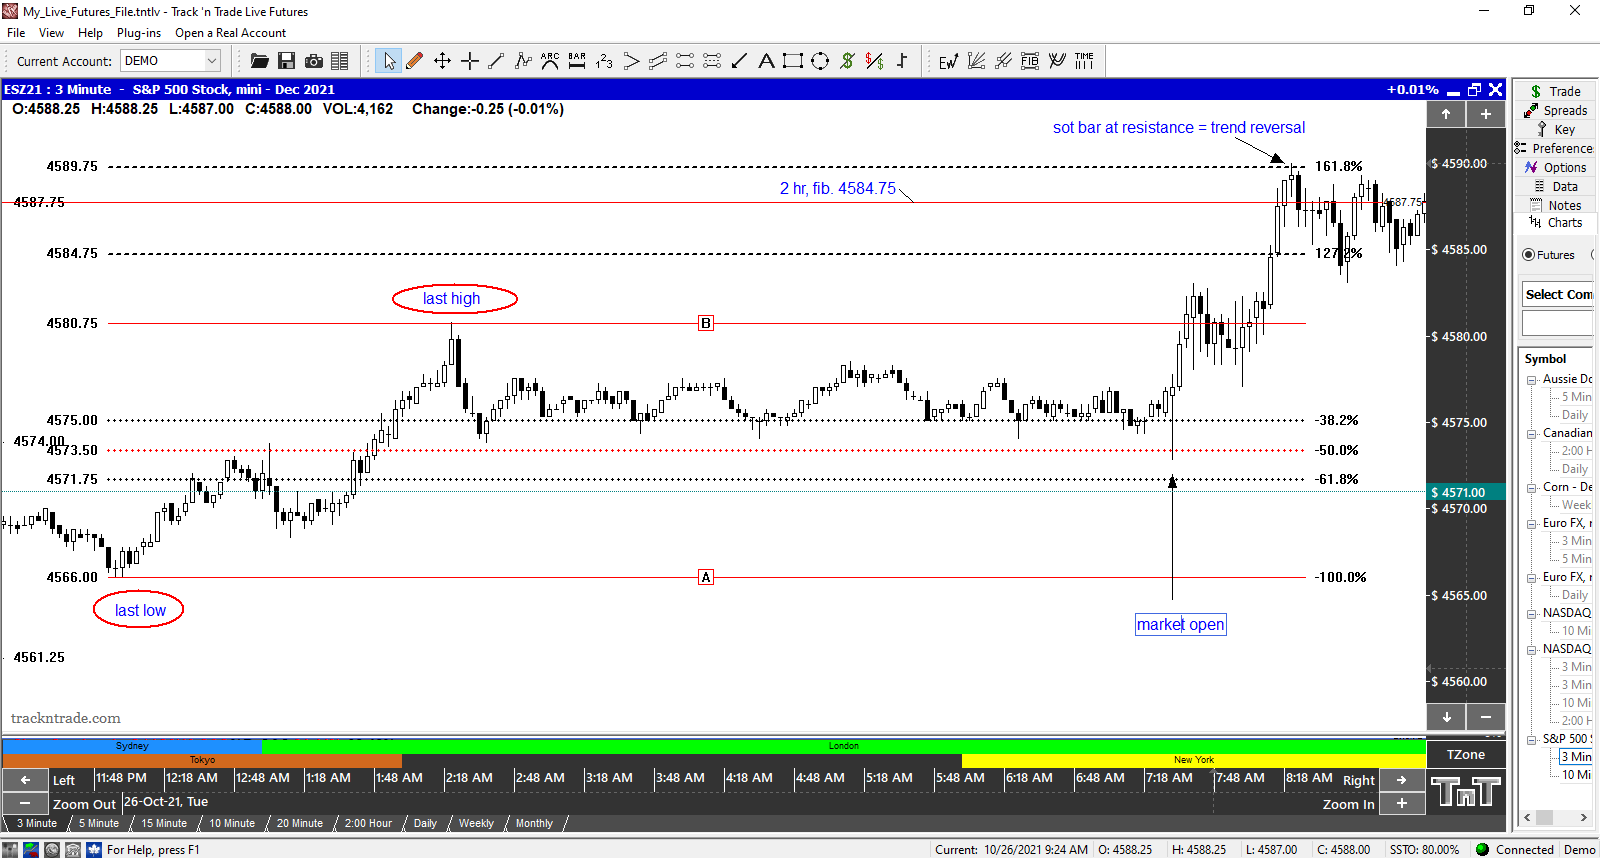
Let's see where the CM's objective is for this current one.


This has been fun. A tad out of my comfort zone. I'm a trader not a bloger.
I simply wanted to show what I do with fib's. Again it's been fun!
This will be my last post. Wish everyone all the best!!
Always remember.... Everyone you meet is fighting a battle you know nothing about. Be kind always.
The big picture on the daily, we may have started a possible wave 4 here:
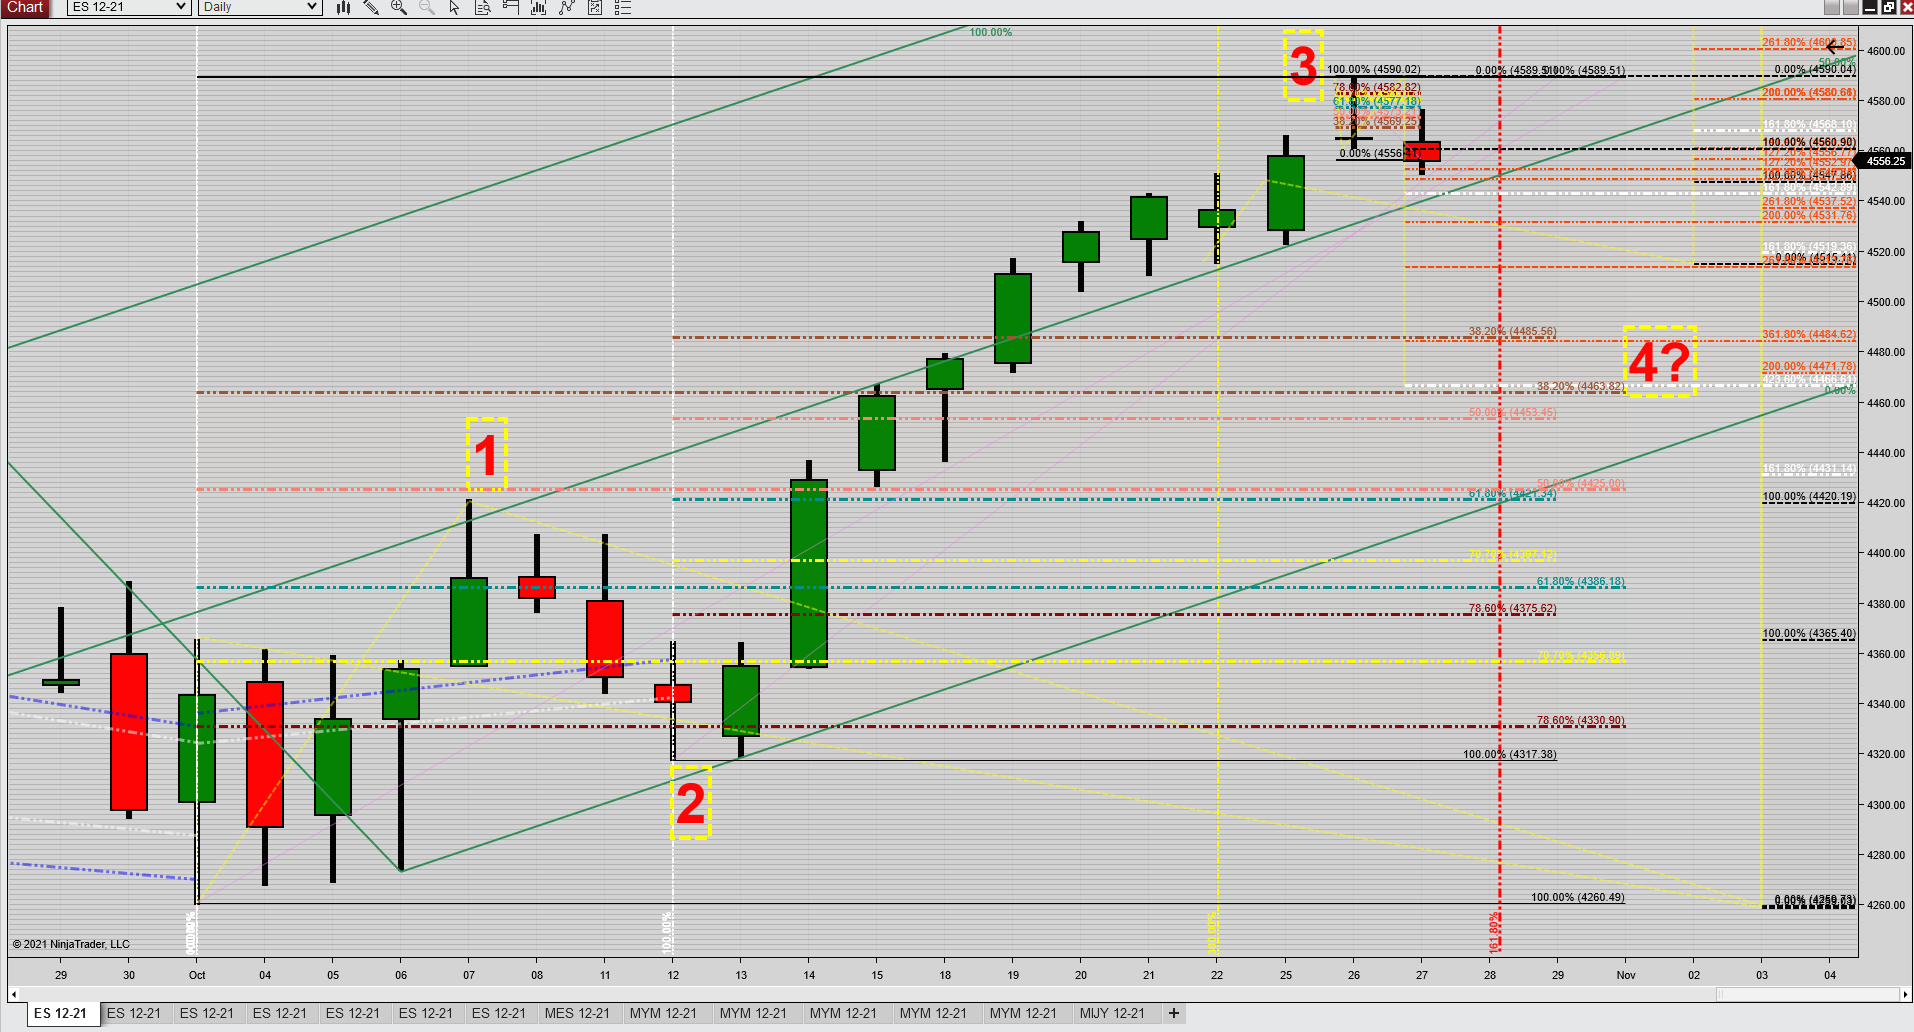
IF that "little dip" was a wave 4 it sure was pretty shallow, we'll see what the open brings later today:
