The United States is the fifth largest producer although production is estimated to drop 13 percent in line with a long-term decline. Citrus greening has been a key factor in this decline with production less than one-third of what it was 20 years ago. In addition, citrus area is down by nearly 40 percent. U.S. production is estimated to drop to 4.2 million tons. Production has been trending lower for years due to citrus greening. Consumption, exports, and fruit for processing are all lower with the drop in supplies.
According to Zansler, after March 2020, demand for OJ at retail surged at the onset of the COVID-19 pandemic, relieving excess inventories. There was a significant increase in OJ sales at retail for the rest of 2020. Sales have continued to exceed 2019 levels in 2021, she reported.
There were two distinctly divergent trends for citrus juice sales during the 2019-20 Florida citrus season, Florida Department of Citrus economist Marisa Zansler reported recently. The divergent trends were linked to the COVID-19 pandemic, which became a major issue in the United States in March 2020.
Prior to March 2020, there were orange juice (OJ) and grapefruit juice surpluses, Zansler said. The surpluses were due to excess imports that suppressed Florida grower prices, as well as to consumption declines of about 5.5% per year, on average.
A slide Zansler showed described the “OJ Path to Purchase in 2021.” That slide indicated that increased OJ sales are associated with:
Zansler added that there are indications consumers are still shopping with COVID-19 in mind. On average, 28% of survey respondents indicated they purchased more OJ due to concerns about COVID-19 over the past 16 months. And since April 2020, an increasing share of consumers who reported buying more OJ say they are doing that to support a healthy immune system.
https://citrusindustry.net/2021/10/12/orange-forecast-florida-down-11-percent-last-year/
ORANGES
The Florida orange forecast, at 47 million boxes, is down 11% from last season’s final utilization.
In Florida, early, mid-season and navel varieties (non-Valencias) are forecast at 19 million boxes, down 16% from last season’s final utilization. The Florida Valencia orange forecast, at 28 million boxes, is down 7% from last season’s final utilization.
According to Curtis, the fruit per tree is the lowest on record for both Florida non-Valencias and Valencias. The records date back to the 1964-65 crop. In addition, he said that both types of orange trees this season have smaller fruit size than average.
The California orange forecast is 43.5 million boxes, down from last season’s 50.1 million boxes. The California navel orange forecast is 35 million boxes, down 14% from last season. The California Valencia orange forecast is 8.5 million boxes, a decrease of 11% from last season.
The Texas orange forecast, at 550,000 boxes, is down 48%.
The total U.S. orange forecast for the 2021-22 season is 3.88 million tons, down 12% from the 2020-21.
https://citrusindustry.net/2021/10/13/u-s-citrus-processing-report/
In 2020-21, 57% of U.S. citrus was used for processing, and most of the processed fruit was oranges, the U.S. Department of Agriculture’s Economic Research Service reported in September. Florida produced 81% of all U.S. oranges for processing, while California and Texas produced the remainder.
Florida and Texas had smaller orange crops for the processed market in 2020-21 compared with 2019-20. Florida’s production was 22% below last season, while Texas’s production was down 26%. California orange production for the processing market was up 8%, with an increase over last season of 44,000 tons of navel and early/mid-season oranges going to processing.
A total of 329 million gallons of orange juice were produced domestically in the United States in 2020-21, 27% below production from last season. This marks the lowest production volume of orange juice in over 50 years, excluding 2017-18 when Hurricane Irma reduced the Florida Valencia crop by up to 30%.
The 45 cent rally reaching $1.50 took almost half a year, from May to September. And in typical hungry ravaging bear fashion, was ripped in half, with razor Fibonacci precision scalpel in just a couple of brutal months decline. Besides fulfilling Fib objective, an Andrews Fork may be drawn that appears to capture the low made Monday, cradling the price like a baby in Mother's loving arms. Yeah, she's oversold to beat the band and with a hard winter plagued with Covid concerns... OJ has in the past and may well now, go wildly vertical. Beam me up, Scotty! By the way, this is a Weekly Nearby chart from the Barchart site. Purchased a solitary (one) Jan OJ on Monday morning. Quickly showing profit in excess of $500, that impulse has bled down, again in Fibonacci fashion, by 50 to 60 percent, Profit only about $100 now, looking to add on verifiable strength from here.
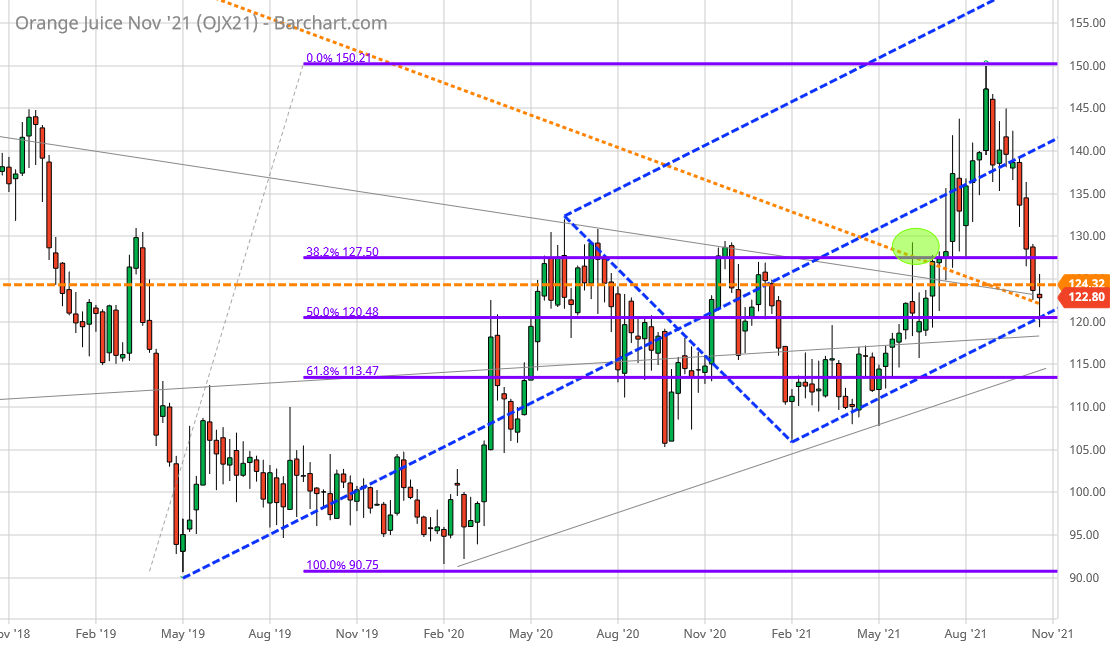
My old Orange Juice chart, monthly. Just click on arrow on the right to update. Seems that we have a launch and subsequent pullback is now complete. Ready for another leg raise, perhaps.
https://www.tradingview.com/chart/OJ1!/mSxVBAp7-long-Orange-Juice/
https://citrusindustry.net/2021/10/20/fresh-citrus-production-imports-and-exports/
U.S. citrus production for the fresh market was estimated at 3.45 million tons in 2020-21, down 6% from the previous season, with smaller fresh-market crops of oranges (down 11%), grapefruit (down 15%) and lemons (down 6%). The U.S. Department of Agriculture’s Economic Research Service reported the production levels in September.
ORANGES
DOWN
Representing just under half of all U.S. citrus production for the fresh market, oranges decreased from the previous season to 1.68 million tons due to smaller crops in California, Florida and Texas.
With a supply contraction and robust demand, prices increased. Overall, the average equivalent-on-tree price for a box of fresh oranges increased from $16.57 in 2019-20 to $21.43 in 2020-21 due to higher prices in September through May.
Lower exports this season (a decrease of 8%) are indicative of higher domestic demand. Exports to South Korea, Canada and Hong Kong (the top three export markets for U.S. oranges) decreased by 12%, 15% and 20%, respectively.
U.S. imports of fresh oranges in 2020-21 (November through July) were down 6% from the same period last year. Although fresh orange imports from Mexico were up 8%, there were marked decreases in imports from Chile and South Africa, the second- and third-largest suppliers of fresh oranges to the United States.
TANGERINES
UP
Production of U.S. tangerines, mandarins and tangelos (collectively referred to as tangerines) for the fresh market bucked the production downturn of oranges, grapefruit and lemons. Tangerine production reached its second highest level in 50 years at 788,000 tons this season due to a larger crop in California.
Imports of tangerines were down 3% in the 2020-21 season, compared to last season’s record high, with 835 million pounds imported primarily from Chile, Peru and Morocco.
Exports of tangerines were up this year, with a 9% (10 million pounds) increase from 2019-20. Canada, Japan and Mexico remained the three largest export markets for U.S.-grown tangerines.
Near-record high domestic production this season led to the highest per-capita availability of tangerines on record of 6.95 pounds.
https://www.ers.usda.gov/webdocs/outlooks/102267/fts-373.pdf?v=1443.3
WOW Hayman, this is great stuff! Thanks
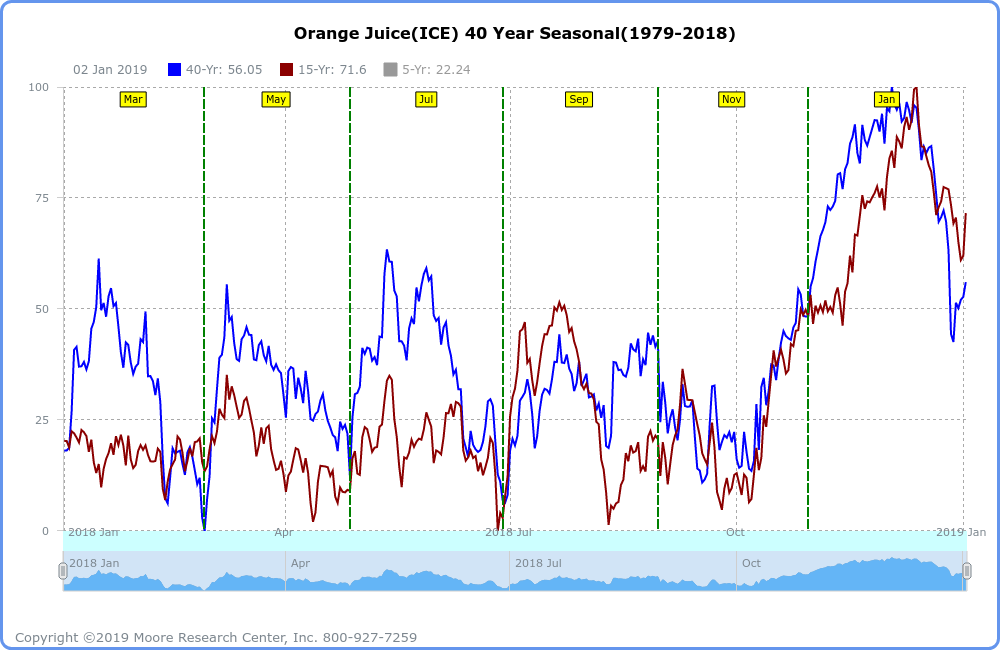
OJ seasonals are strongest in Oct/Nov to the start of Dec....right now!
Used to be called freeze premium ahead of the Winter in Florida but one of the many global warming benefits, includes much less freeze damage risk to crops in Florida during our Winter.
 Seasonal Chart")
Here's another seasonal chart that uses data slightly differently.
OJ prices, historically have had a strong tendency to go up in the late Fall, very start of WInter, then drop after that.
https://commodityseasonality.com/softs/
https://www.mrci.com/client/spmarket/jod.php
Here's where they grow the orange crop in Florida:
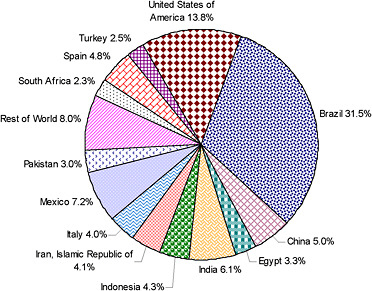
But the US has not been the #1 producing country in the world for oranges for a long time. Brazil has that distinction(mostly Sao Paolo).
Orange production in Sao Paulo Brazil.
Red is highest, then orange, then yellow.

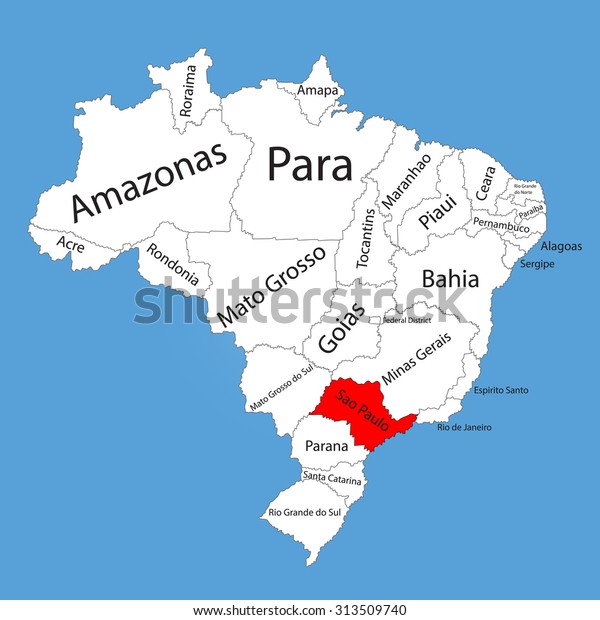
They grow most of the oranges in Brazil in Sao Paolo(more than double US production), shaded red on the map below:

How Brazil stole the production of orange juice from Florida
https://www.cnbc.com/2018/08/23/brazil-florida-orange-juice-tariff-trade-war.html
Abandoned Baby is a tiny doji star, separated from prior day by a gap. Here we have such a potential in orange juice intraday. It may mark the conclusion of the recent fade back and fill. A gap back up would be telltale with resumption of uptrend. Importance of this week being the conclusion of the month of October is monumental. Powerful moves may happen in the next 3 days to fulfill the end of the month technical and fundamental "requirements".
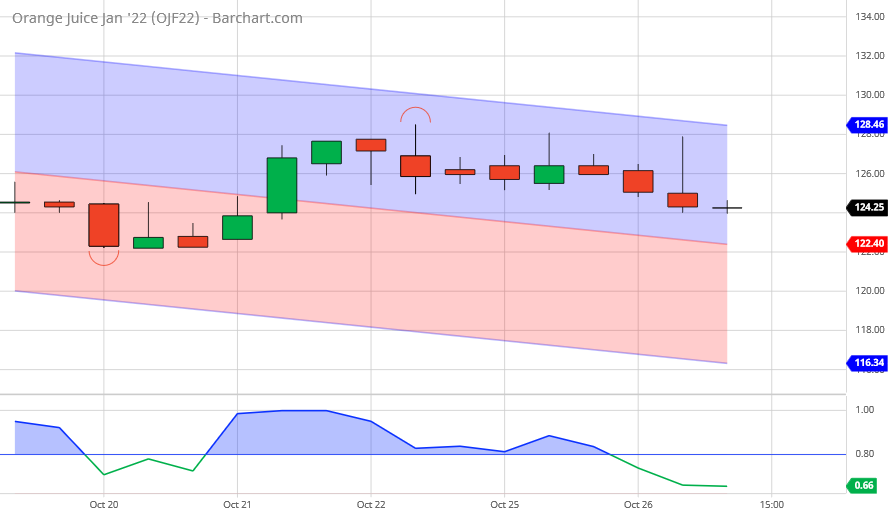
Thanks hayman, I’m not seeing any gaps like you mentioned except like, on the 1 minute chart yesterday just before and after 10am but mainly just part of the thin volume of oj trading.