Corn and Bean crop ratings may fall a bit again on Monday but there could be a stark contrast, depending on location.
Several places got no rain but temps were COOL that helps minimize stress. The places that got rain should hold up well/even do better. On the other hand some of them got too much rain, especially beans and actually want dry weather and could deteriorate on Monday from TOO MUCH rain in a few spots
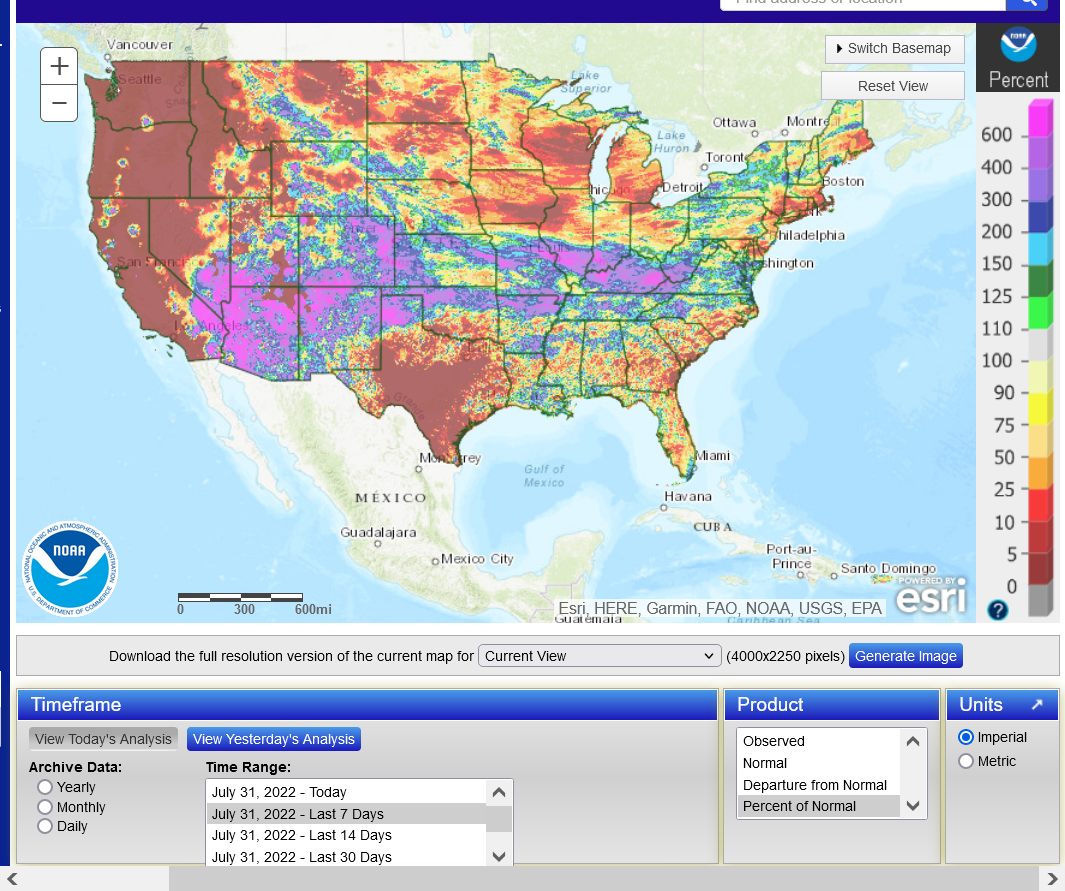
The almost no rain for 30 days map will tell us where the P/VP category increases. Most of that is not on key C and S producing ground.
https://flowingdata.com/2021/11/29/map-made-of-candy-corn-to-show-corn-production/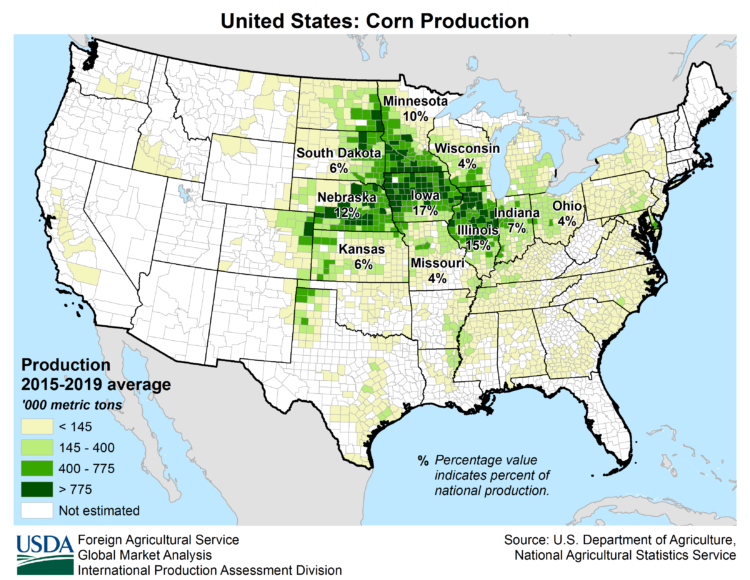
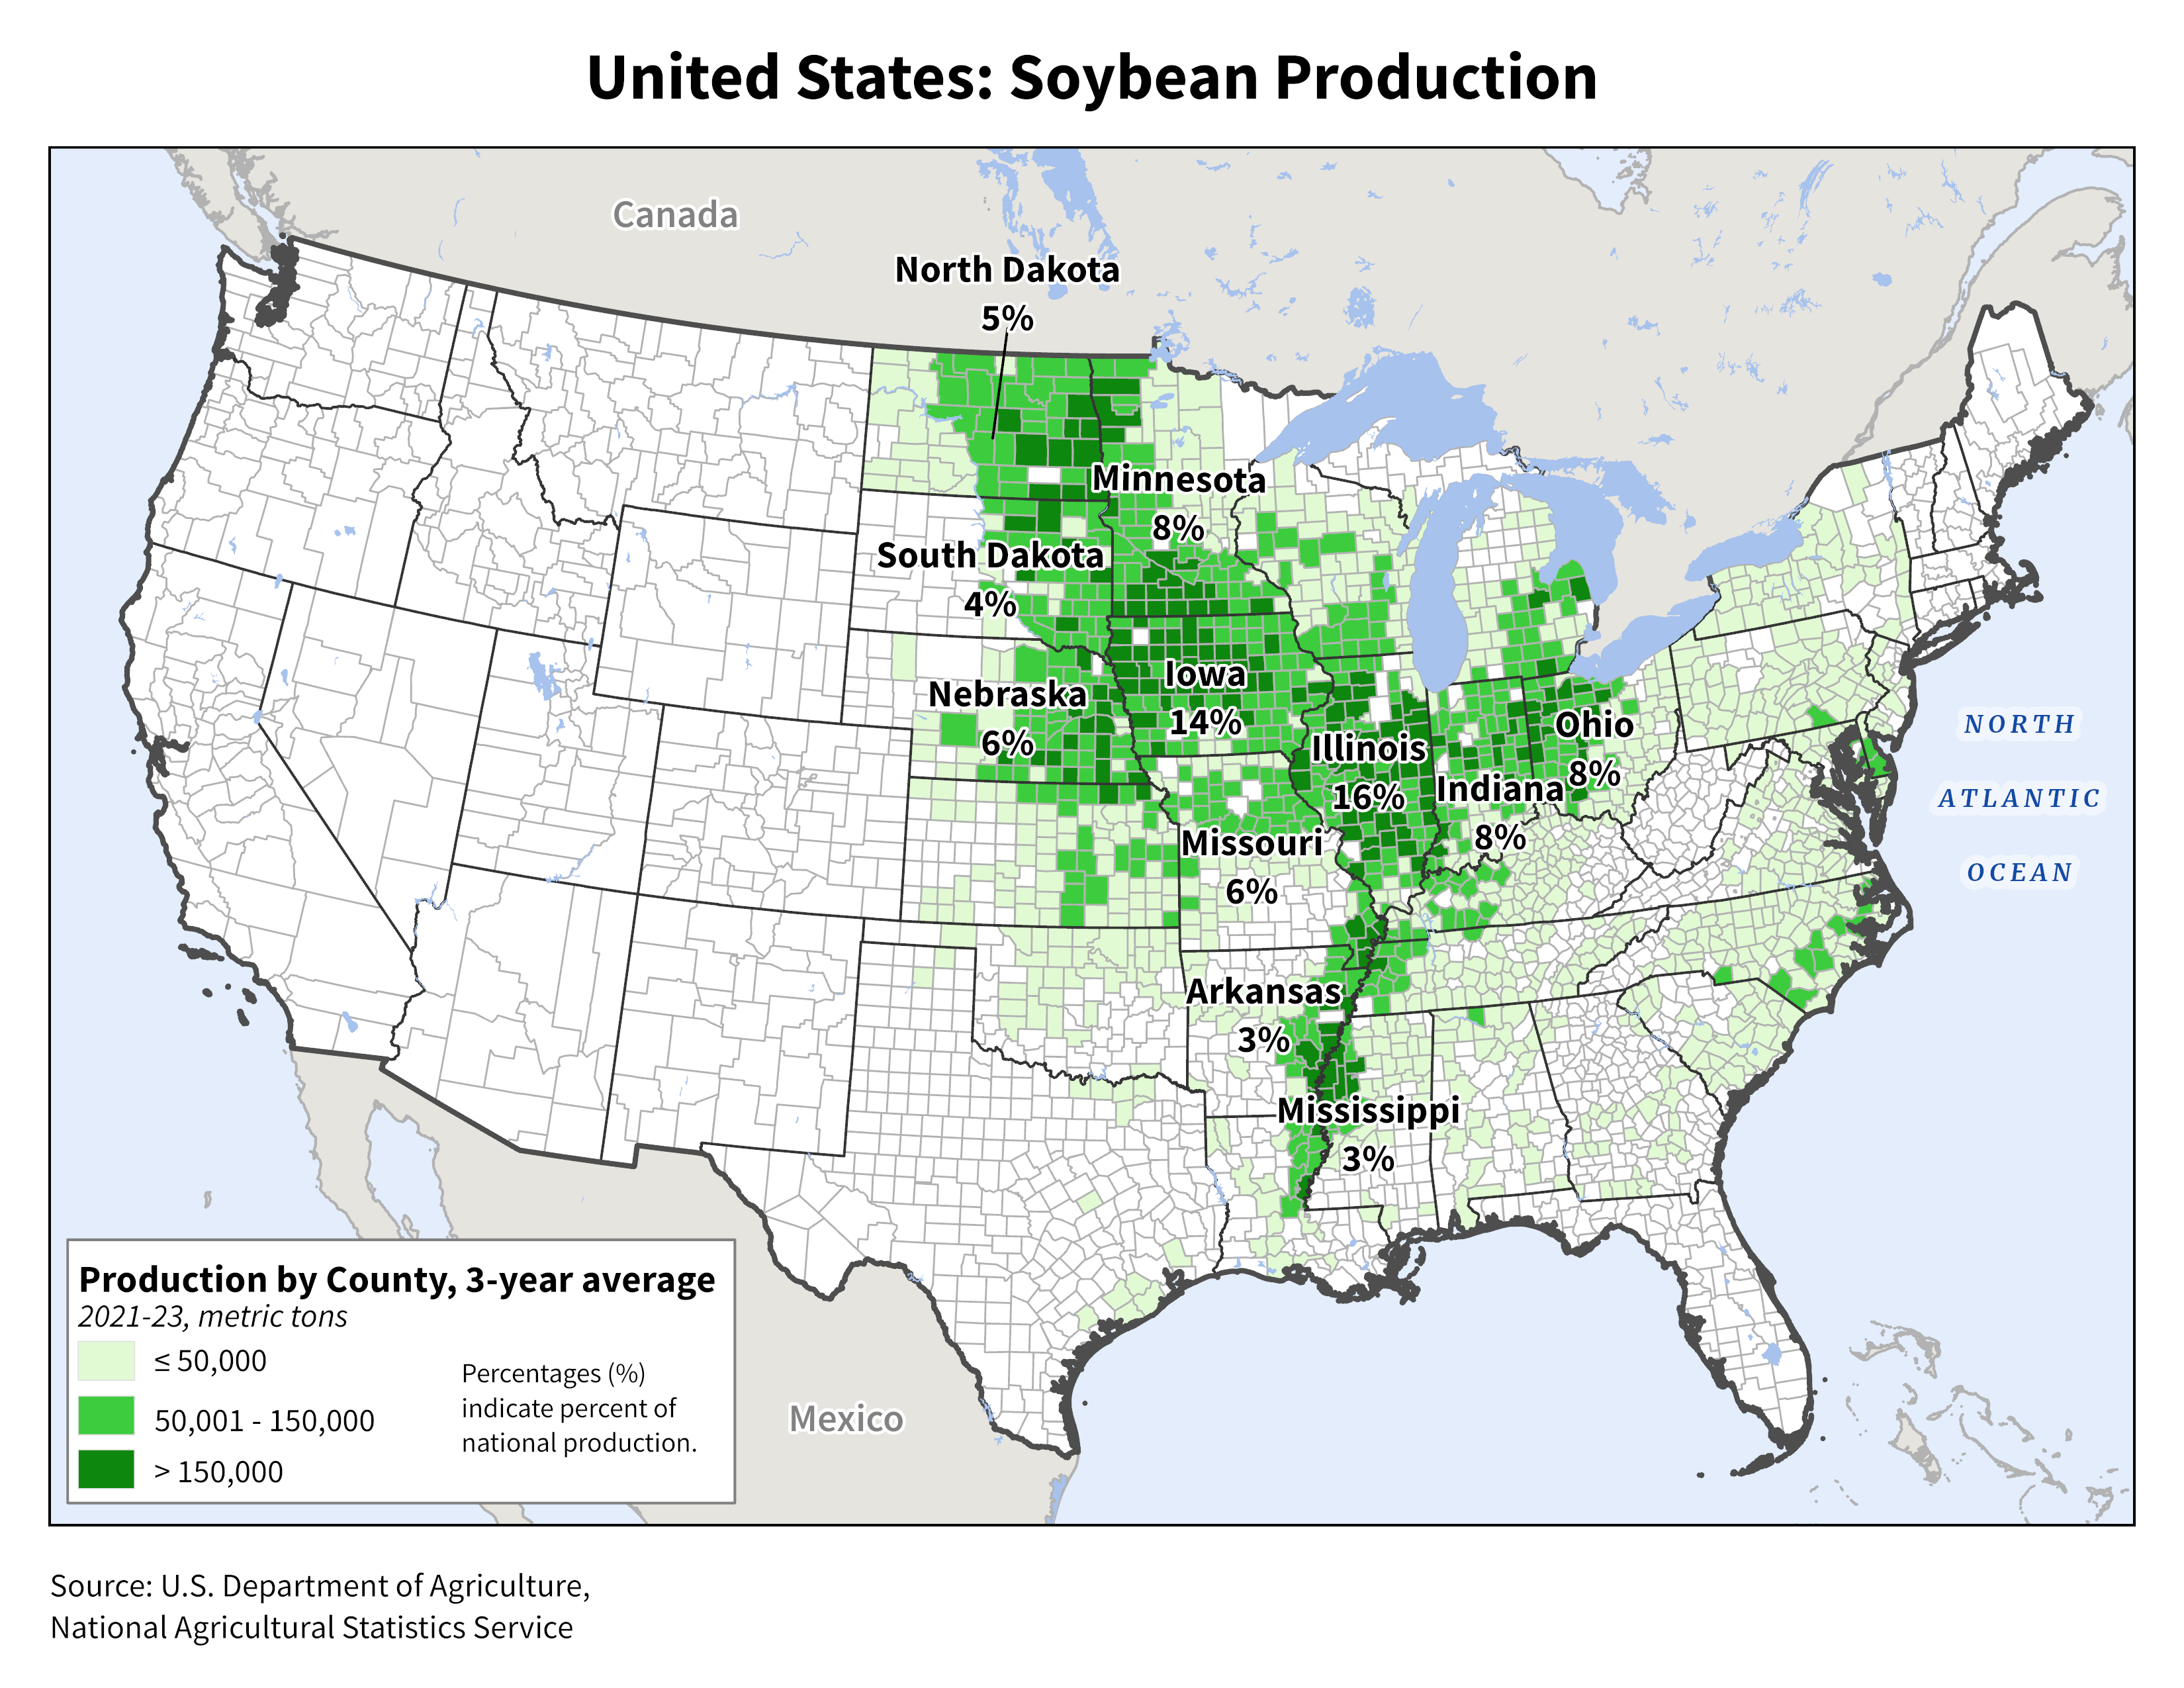
https://ipad.fas.usda.gov/rssiws/al/crop_production_maps/US/USA_Soybean.png
https://water.weather.gov/precip/
7 day rains below:
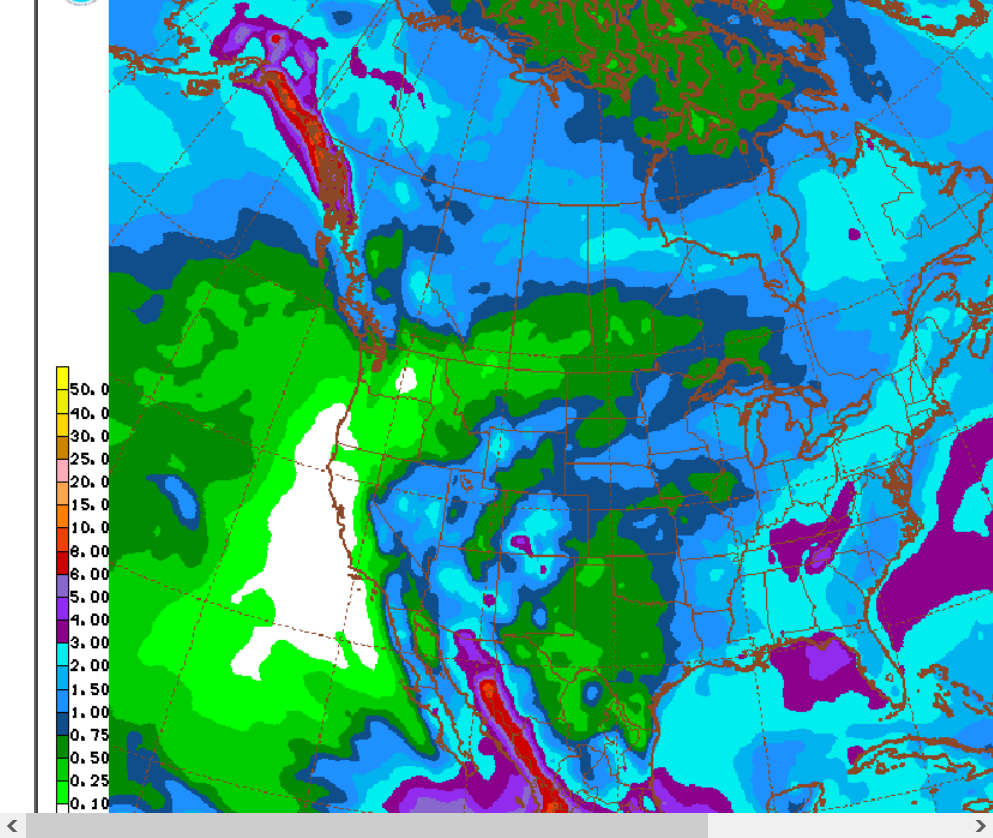
14 day rains:

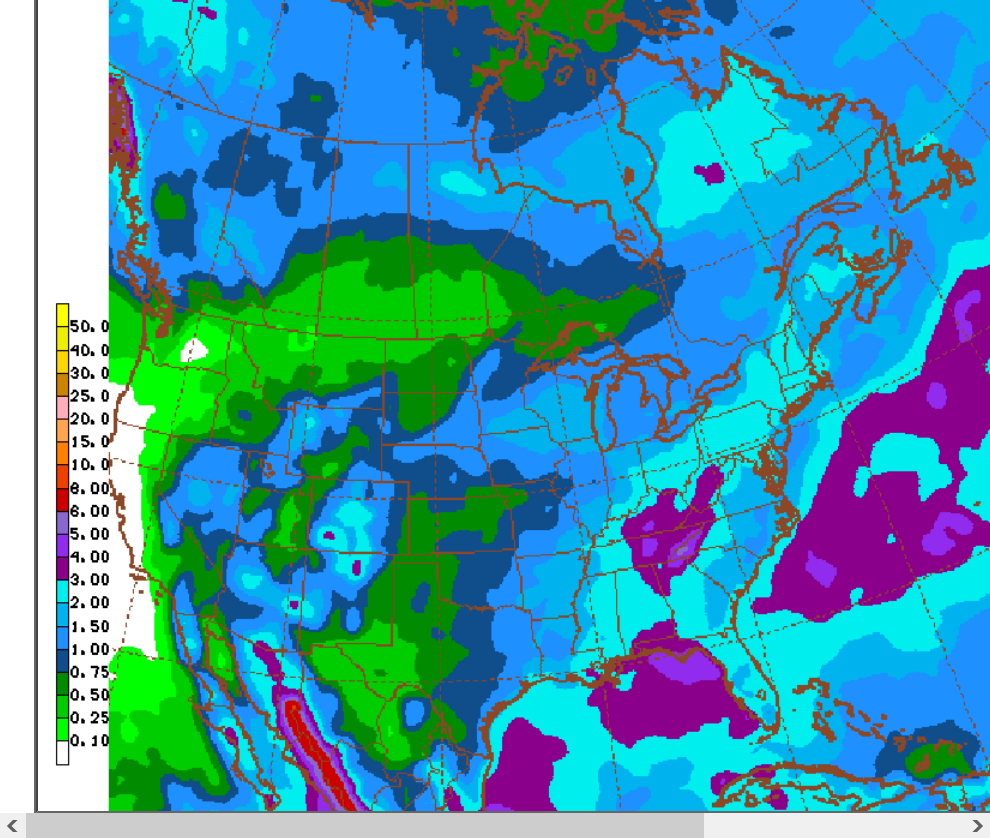
30 days rain below
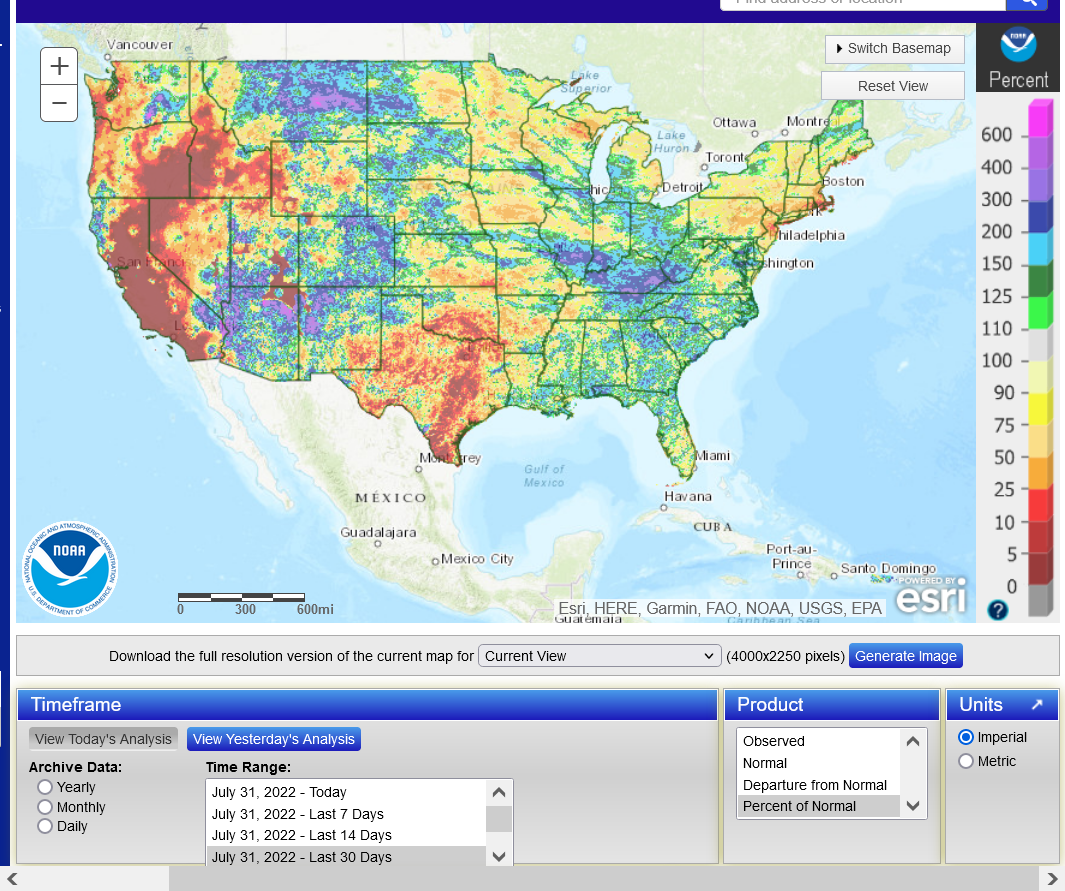
Rains the last 72 hours:
https://www.iweathernet.com/total-rainfall-map-24-hours-to-72-hours
Radar images:
https://www.marketforum.com/forum/topic/83844/
+++++++++++++++++++++++++++++++++++
Soil moisture anomalies:
Look how ideal the temperatures were in the Midwest last week. That lessens alot of the stress in the dry areas compared to it being hot and dry.
Where temps were above average and it didn't rain, crop ratings WILL drop and P/VP will increase because some of those areas have been dry for a long time.
https://www.cpc.ncep.noaa.gov/products/tanal/temp_analyses.php
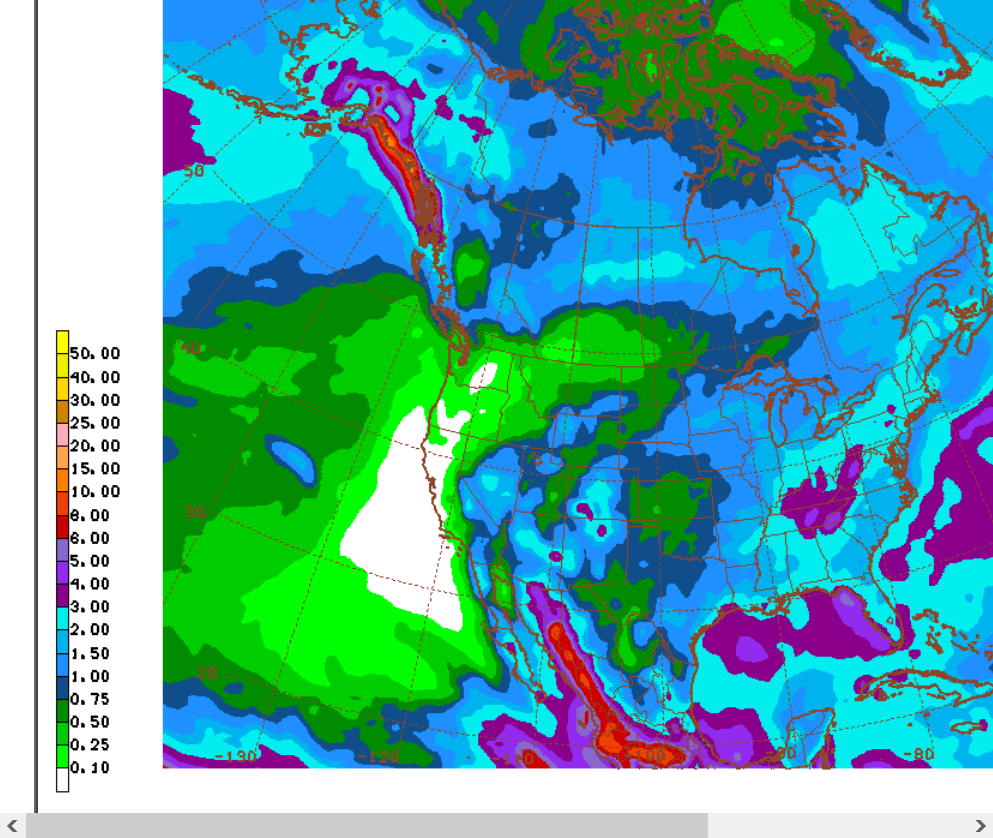
Rainfall forecast:
More rain the next 7 days than what was expected in the Central and especially the Eastern Cornbelt.
WCB will see conditions deteriorate this week as expected but even there, temps are not as hot as expected. So the weather is NOT NEARLY AS bullish as last Friday.
The latest 7 day precip forecasts are below.
Day 1 below:
http://www.wpc.ncep.noaa.gov/qpf/fill_94qwbg.gif?1526306199054

Day 2 below:
http://www.wpc.ncep.noaa.gov/qpf/fill_98qwbg.gif?1528293750112

Day 3 below:
http://www.wpc.ncep.noaa.gov/qpf/fill_99qwbg.gif?1528293842764

Days 4-5 below:
http://www.wpc.ncep.noaa.gov/qpf/95ep48iwbg_fill.gif?1526306162

Days 6-7 below:
http://www.wpc.ncep.noaa.gov/qpf/97ep48iwbg_fill.gif?1526306162

7 Day Total precipitation below:
http://www.wpc.ncep.noaa.govcdx /qpf/p168i.gif?1530796126

Extended forecasts:
These automated maps don't show it but the heat ridge shifts west in week 2. Rains should pick up in the ECB, probably the CCB and at least a chance in the WCB that looked extremely unlikely late last week.
Temps are clearly NOT AS hot!
Higher open which surprised me but I guess the market was thinking today's bullish, NWS automated extended forecast is valid.
It still has hot and dry for most of the Cornbelt.
I think this is TOO hot and TOO dry and tomorrow, we should see hot temp probabilities drop lower(but still above average, especially WCB) and have some rains added to the 6-10/8-14 day outlooks, especially in the ECB.
This would likely be bullish compared to average temps/rain.
But the market has been trading near record heat and no rain for that period, so on a relative scale......LESS bullish!
When does non-automatic data come out?
Hi tjc,
The meteorologist drawn/produced extended forecasts come out every afternoon not long after 2pm Mon-Fri.
Same thing on weekends but its automated/computer generated.
The models that go into it are coming out round the clock.
The GFS/Ensembles, every 6 hours. The European, Canadian and CMC models, along with Ensembles every 12 hours.
The European model gets the most weight by the market, then the GFS.
https://www.cpc.ncep.noaa.gov/products/predictions/610day/
Here's the GFS model page:
https://mag.ncep.noaa.gov/model-guidance-model-area.php
Canadian ensemble model page:
https://weather.gc.ca/ensemble/index_e.html
European model is only available with a paid service from what I understand.
Stopped out 40 cents S, 20 cents c, and 15 cents W ago.. Huge winner S, flat C, 1000 loss W.
My work suggested one more day up===so , failed to sell higher open---sad.
MetMike--did you sell your forecast? Prob more down Tuesday.
Congrats on the S tjc!
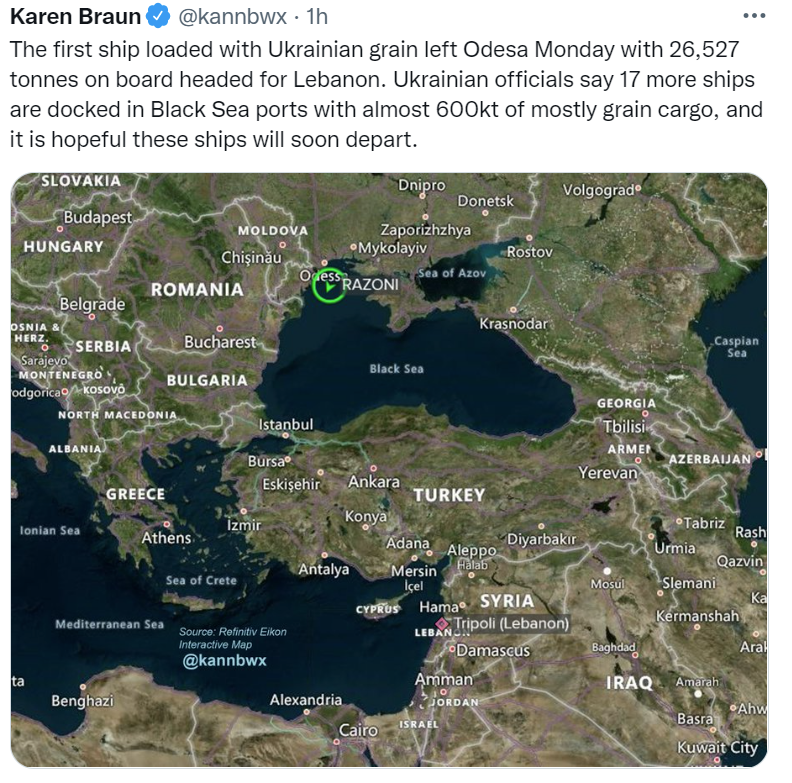
I wouldn't get too excited about much more downside. Yes, with a nod to Mike, the weather shifted and it's slightly cooler. But it's still hot and it's still dry. And some of this downside could be attributed to the fact that a cargo ship full of grain finally left a Ukraine port.
With seemingly all commodities down today, I would bet they are all influenced by that slight bit of good news.
The weather looks pretty bearish compared to Fri, Jim!
Bearish compared to Friday, does not mean bearish. Bearish compared to Friday does not mean that I would short this market with your money.
The US has gotten just enough rain to keep plants alive. But there is no way they are thriving. It will be very interesting to see how productive they are.
One trip to NC and one trip east of Toledo, last week, for parts
East of Toledo on our route was a disaster
Not sure if planted wet or lack of drainage
Beans looked better so would bet on later planting resulted in better/drier soil planting conditions
They can't all be poor farmers
We have some pollination problems which do not show up at a wind shield 70 MPH trip
I think part of dry land KS is chopping low yield corn
Pasture and hay crop is short
Will eastern corn belt, have higher yields as low yields come out of natn'l yield. It is all about total production IDK
NC showed some more green lawns and road side but on our trip to NC, grow almost zero row crops as it is all mountains were we travelled, plus poor crop east of Toledo
Over all I was not impressed with crops
Kansas can not keep fields cooled down with irrigation but will have a good crop with water, just not bin buster
On the flip side my son came home from Calgary, Canada though MN and IA
Did not see a single bad field the whole trip through those two states until hit 1-94 east, but his route is not all of the acres. Just his route
Some of high yield ILL has too much water
It is a case of have and have not's
Too soon to tell how bad our pollination issues may be, on our farm
I doubt we lose many bu even though we are really dry
Grain fill is our biggest unknown factor as of now, which could be our biggest yield loss
Our beans look decent so far but pods could really start to abort, as they will, with extremely dry
2.25" since early June [think mostly1st week]
Not close to enough water during pollination and start of grain fill
I cut weeds on our lawn
Watering young trees but think it is a waste of good water
Spraying sweet corn every day for bugs and worms
Sweet corn for corn on cob sales in super markets has started a week ago. Yields are decent but got irrigation water. Pollination is good on sweet corn with water and cool down water at nite
So far harvesting 9 plus reefers/day of sorted sweet corn. Will continue until end of Aug or a week later
A disaster on corners were end gun could not reach
3 ponds for 800 acres Two are fed by creeks, via a pipe approx a foot above low water line. Other pond can not re-charge and is dry
Thanks for that extensive view, Wayne.
Man, you sure get around for an older gent!
This surely had a downward effect on grain prices today. Tomorrow? We will see.
Thanks Jim,
I'm sure this and crude being down $4+ is adding to the pressure but the weather turning much less bullish(actually bearish for the ECB and nuetral CCB) is the main factor by a very wide margin.
Especially since, last week the market dialed in VERY bullish across the entire belt during this same period.
It's possible that the models shift the dome farther east again.....in fact, the latest 12z Canadian model does that but we'll see on the other models.
The NWS reduced their above temp probabilities and shifted them west slightly but I'm shocked that they continue with below rain in areas where the models have increased rains-ECB and call their confidence 4 out of 5(but mention the weak precip indicators).
OK, never mind, the new map had not updated. They have, in fact boosted rains in the ECB, which previously had Below everywhere.
The WCB still looks like it's in trouble.

7 Day Total precipitation below:
http://www.wpc.ncep.noaa.govcdx /qpf/p168i.gif?1530796126
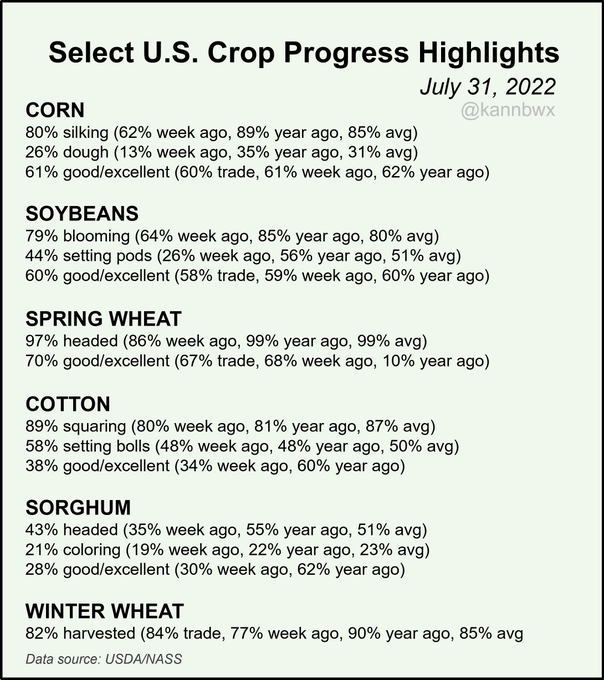
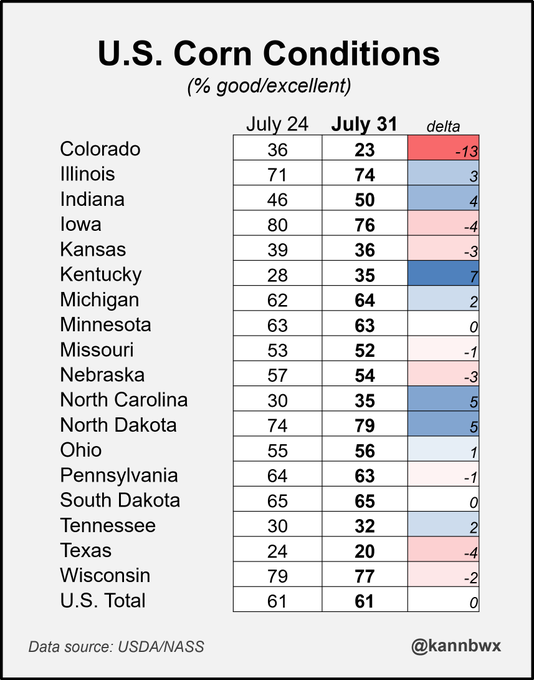
Crop ratings were unch for C and +1 for beans.
https://release.nass.usda.gov/reports/prog3222.txt
A tad better than I expected.
Cool weather in the dry spots helped a great deal.
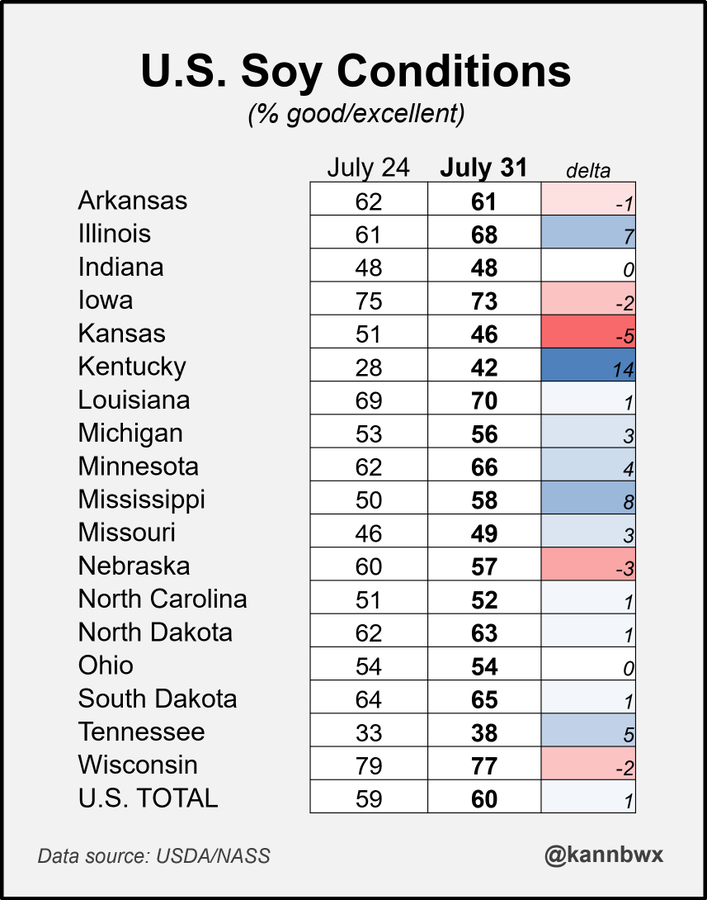
#Soybeans at 60% good/exc (up 1 pt on the week) follow the same trend as in corn: similar to the same weeks in 2021 & 2017, better than 2019 but worse than 2018 & 2020. Beans were 72% g/e at this point in 2016, still the best U.S. yield on record.
#Corn in Colorado took a turn for the worse last week, but that was offset as rain in southern parts of Illinois & Indiana plus Kentucky improved crops there. 61% good/exc is 1 pt lower than last year, equal to the same week in 2017, better than 2019 but well below 2018 & 2020.
Small summary of recent years:
2016- record July/Aug rain
2017- low conditions but record corn yield
2018- hot/dry finish maybe prevented the whispered 180 corn yield
2019- late planting/high prevent plant/wet start
2020- Aug flash drought/derecho
2021- Dakotas drought; 177 corn
Mike. Was the big drop in soybeans due to the weather forecast ? I was afraid over the weekend that the forecast would turn cooler/wetter so I bought a Nov bean put on friday. Woke up last night to thunder and lightning which was a shocker since the last I checked there was no rain in forecast. 8/10" in gauge this morning !
Mostly from the weather bowler!
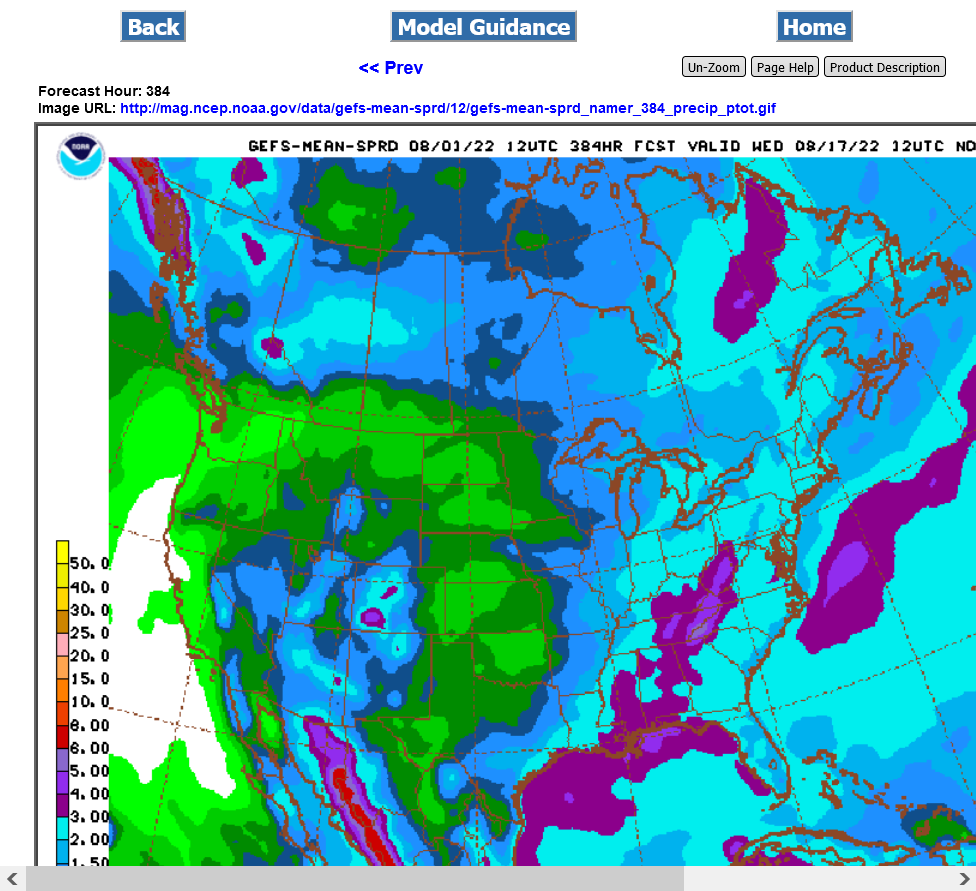
The forecast was supposed to be dry everywhere the next 2 weeks and look at the 2 week rain forecast that we've had the last day on the GFS. This is the latest 12z model:
Beans spiked to -25c shortly after the open but managed to come all the way back and trade a couple c higher for awhile.
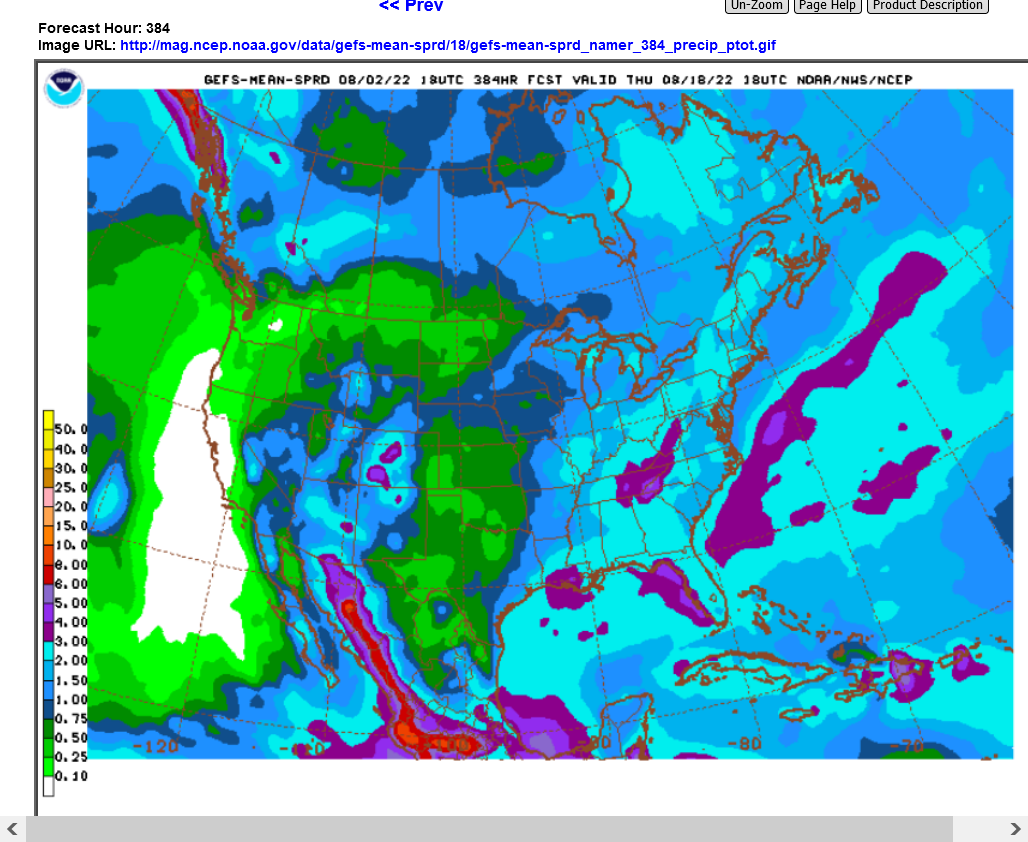
18z GFS tries to shift the heat ridge back eastward a bit during week 2.
Potentially more bullish IF the rest of the guidance continues this trend.
Regardless, the WCB is going to see ratings crop in August unless the pattern changes a great deal from what the models show now............which is hot and low rain amounts thru the next 2 weeks.
This was the last 18z rain total for the next 2 weeks:
80% of the corn crop had pollinated as of this last Sunday, so that crop is now filling kernels.
..HIGH heat will kill yields because it causes maturity at such a rapid pace that it lessens the time for the plant to fill the kernels with all the energy that we grow/use corn for(to feed animals for instance)
Cool weather = plump kernels
Hot weather = small kernels
Ideal filling is:
1. COOL with ample rains
2. After that, COOL and dry.
3. After that HOT (heat fill) and wet.......which is not ideal at all, even with good rains.
4. The worst is HOT and dry.
Heat fill is always bad news, especially if some areas are dry.
Heat fill with good rains will feature a green, good looking plant from the window observation and good ratings. But hidden inside of the husk, (until harvest) are rapidly filling kernels that are SMALL compared the exact same stage of the corn plant with COOL temperatures, along with GDD's and heat units accumulating at a slower pace.
Here are some links to past posts about heat fill. I added the best info below that so you don't have to go searching thru all that.
https://www.marketforum.com/forum/topic/86953/#87109
https://www.pioneer.com/us/agronomy/high-night-temps-yield.html

Figure 1. Daily minimum temperatures (7-day moving average) for Des Moines, IA, in 2009 and 2010, and 30-yr average minimum daily temperatures (1981-2010). Approximate dates of 10%, 50%, and 90% silking in Iowa in 2009 and 2010 based on USDA crop progress reports.
 in Iowa, Illinois, Missouri, Kansas and Nebraska.")
 in Iowa, Illinois, Missouri, Kansas and Nebraska.")
Figure 2. Average minimum temperatures experienced in July-August of 2009 (top) and 2010 (above) and average yields (bu/acre) in Iowa, Illinois, Missouri, Kansas and Nebraska. Data from NCEI NOAA, USDA NASS.
+++++++++++++++++++++++++++++++++++++++++++ICM News
by Roger Elmore, Department of Agronomy
"October corn yield forecast for Iowa dropped to 169 bushels per acre, a significant reduction from the August and September forecasts of 179 bushels per acre (see October USDA-NASS forecast). If realized, 2010 yields will rank sixth among the last seven years, higher only than the yields of 2006 (166 bushels per acre). Numerous published and anecdotal yield reports substantiate lower than expected yields this year.
In previous 2010 Integrated Crop Management News articles, we've addressed 2010 conditions and the possibility of reduced yields resulting from rapid crop development following silking (see September 28 article). Statewide Growing Degree Day accumulations were 116 percent of normal during most of the seed fill period — silk to dent — this year."
Table 2. Effect of temperature on grain fill duration, grain weight per plant and kernel number (Badu-Apraku et al., 1983).

Rains with the current system have been DISAPPOINTING!
https://www.iweathernet.com/total-rainfall-map-24-hours-to-72-hours
I guess the market wants to react to the bullish weather after these rains that was there the last 2 days....today.
Just out 12z GFS ensemble (noon maps) rain for 2 weeks
Will be in Detroit with my 97 year old Dad the next week but try to continue to post.
The NWS has had below rain in every extended, week 2 forecast the last week but keep INCREASING the week 1 rains from what they were expected to be when they were week 2 rains.
Here's the 2 week forecast from the last 18z GFS ensemble for instance. The forecast a week ago from the NWS told us that most of the Midwest would not see much rain during the next 2 weeks.
The ECB and Upper Midwest are close to average(above in OH), other areas on the dry side
A Canadian reported on crops [C & S] for 1200 klicks [720 miles] just recently, on another forum, and reported all was g/E
I call bs on his observations
If he had travelled a couple - 3 weeks earlier he would have seen every field was extremely uneven before pollination The later 2 weeks with wide spread 2 " plus rains allowed the corn crop to get evened up before tassel
That is why a 70 MPH wind shield tour can be so deceiving All he saw was mostly even corn and good growth on beans.
I don't know what crops looked like where he lives, but starting about 50 miles east, from Detroit, [his approx. location] is just east if Detroit. Golly had he made the same trip 2 weeks earlier, crops would have looked different
Dry soils had every corn crop so uneven he simply could have not missed the uneven crop [S and C]
So now we know why one person will report a different crop than a 2nd person, in the same area, simply because of rain amounts and time of rain, before, or after, a rain event
I am like Jim. I pay attention to lawns etc. for an idea of rain amounts.
Listened to a presentation by a self described commodity guru
He was bullish all grains although cotton was not on his list. He was bullish due to the European heat wave, plus russia will not export as much as recent expectations.
SA exports was not known nor did he say any thing about Australia. Ukraine exports, from the Black Sea. was seen as mildly bullish.
His thought was the price would bounce around current levels, until Jan/Feb when the southern feed lots want corn and protein in the feed lot ration
His thought was we are not very far from new crop supplies, which usually kills the basis.
Our basis is plus 2.00 for old and new crop out until June/July/ August. Remember this is in CAD
We had some 10.00 plus cash bids, during the summer months. We sold in increments from 6.50 to 10.00 plus CAD. All the old crop I have left is what is on the floor of the bins. A monitor is usually accurate, and tells me my totals but buying high priced corn can be expensive if you have a shortage on contracts, that need to be filled..
Thanks Wayne,
Do you have names or links to these sources?