KEY EVENTS TO WATCH FOR:
Thursday, August 18, 2022
8:30 AM ET. August Philadelphia Fed Business Outlook Survey
Business Activity (previous -12.3)
Prices Paid (previous 52.2)
Employment (previous 19.4)
New Orders (previous -24.8)
Prices Received (previous 30.3)
Delivery Times (previous -10.2)
Inventories (previous -9.3)
Shipments (previous 14.8)
8:30 AM ET. Unemployment Insurance Weekly Claims Report - Initial Claims
Jobless Claims (previous 262K)
Jobless Claims, Net Chg (previous +14K)
Continuing Claims (previous 1428000)
Continuing Claims, Net Chg (previous +8K)
8:30 AM ET. U.S. Weekly Export Sales
Corn (Metric Tons) (previous 383.1K)
Soybeans (Metric Tons) (previous 410.5K)
Wheat (Metric Tons) (previous 359.2K)
10:00 AM ET. July Existing Home Sales
Existing Sales (previous 5.12M)
Existing Sales, M/M% (previous -5.4%)
Unsold Homes Month's Supply (previous 3.0)
Median Price (USD) (previous 416000)
Median Home Price, Y/Y% (previous +13.4%)
10:00 AM ET. July Leading Indicators
Leading Index, M/M% (previous -0.8%)
Leading Index
Coincident Index, M/M% (previous +0.2%)
Lagging Index, M/M% (previous +0.8%)
10:30 AM ET. EIA Weekly Natural Gas Storage Report
Working Gas In Storage (Cbf) (previous 2501B)
Working Gas In Storage, Net Chg (Cbf) (previous +44B)
4:30 PM ET. Federal Discount Window Borrowings
4:30 PM ET. Foreign Central Bank Holdings
Friday, August 19, 2022
10:00 AM ET. 2nd Quarter Quarterly Retail E-Commerce Sales
10:00 AM ET. 2nd Quarter Advance Quarterly Services
10:00 AM ET. July State Employment and Unemployment
N/A U.S: Hawaii Statehood Day
The STOCK INDEXES? http://quotes.ino.com/ex?changes/?c=indexes
The Dow gap closed lower on Wednesday as it consolidated some of the rally off July's low. The is challenging key resistance marked by the 62% retracement level of January-June decline crossing at 34,179.81. The mid-range close sets the stage for a steady to lower opening when Thursday's night session begins trading. Stochastics and the RSI are overbought but remain neutral to bullish signaling that sideways to higher prices are possible near-term. If the Dow extends the rally off June's low, the 75% retracement level of the January-June decline crossing at 35,160.79 is the next upside target. Closes below the 20-day moving average crossing at 32,849.10 would signal that a short-term top has been posted. First resistance is the 62% retracement level of the January-June decline crossing at 34,179.81. Second resistance is the 75% retracement level of the January-June decline crossing at 35,160.79. First support is the 10-day moving average crossing at 33,371.48. Second support is the 20-day moving average crossing at 32,849.35.
The September NASDAQ 100 closed lower on Wednesday as it consolidates some of the rally off June's low. Today's low-range close sets the stage for a steady to lower opening when Thursday's night session begins trading. Stochastics and the RSI are overbought but remain neutral to bullish signaling sideways to higher prices are possible. If September extends the rally off June's low, the 50% retracement level of the 2021-2022 decline crossing at 13,812.10 is the next upside target. Closes below the 20-day moving average crossing at 13,048.98 would signal that a short-term top has been posted while opening the door for additional weakness near-term. First resistance is Tuesday's high crossing at 13,740.75. Second resistance is the 50% retracement level of the 2021-2022 decline crossing at 13,812.10. First support is is the 20-day moving average crossing at 13,048.98. Second support is the 50-day moving average crossing at 12,334.51.
The September S&P 500 closed lower on Wednesday as it consolidated some of the rally off July's low. The low-range close sets the stage for a steady to lower opening when Thursday's night session begins trading. Stochastics and the RSI are overbought but remain neutral to bullish signaling that sideways to higher prices are possible near-term. If September extends the rally off June's low, the 62% retracement level of the January-June decline crossing at 4352.80 is the next upside target. Closes below the 20-day moving average crossing at 4131.43 would confirm that a short-term top has been posted. First resistance is Tuesday's high crossing at 4327.50. Second resistance is the 62% retracement level of the January-June decline crossing at 4352.80. First support is the 20-day moving average crossing at 4131.43. Second support is the 50-day moving average crossing at 3964.70.
INTEREST RATES? http://quotes.ino.com/ex?changes/?c=interest ""
September T-bonds closed down 31-pts. at 140-08.
September T-bonds closed lower on Wednesday. The low-range close sets the stage for a steady to lower opening when Thursday's night session begins trading. Stochastics and the RSI are turning neutral signaling that sideways trading is possible near-term. If September renews the rally off June's low, the 50% retracement level of the 2021-2022 decline crossing at 147-27 is the next upside target. If September extends the decline off the August 2nd high, the 50-day moving average crossing at 139-01 is the next downside target. First resistance is the August 2nd high crossing at 145-31. Second resistance is the 50% retracement level of the 2021-2022 decline crossing at 147-27. First support is the 50-day moving average crossing at 139-01. Second support is the July 11th low crossing at 136-24.
September T-notes closed down 195-pts. at 118.250.
September T-notes closed lower on Wednesday as it extends the decline off the August 2nd high. The mid-range close sets the stage for a steady to lower opening when Thursday's night session begins trading. Stochastics and the RSI are oversold but remain neutral to bearish signaling sideways to lower prices are possible near-term. If September extends the decline off the August 2nd high, the July 21st low crossing at 117.145 is the next downside target. If September renews the rally off June's low, the 50% retracement level of the December-June decline crossing at 122.204 is the next upside target. First resistance is the August 2nd high crossing at 122.020. Second resistance is the 50% retracement level of the December-June decline crossing at 122.204. First support is the 50-day moving average crossing at 118.063. Second support is the July 21st low crossing at 117.145.
ENERGY MARKETS? http://quotes.ino.com/ex?changes/?c=energy ""
September crude oil posted an inside day with a higher close on Wednesday as it consolidates some of the decline off June's high. The mid-range close sets the stage for a steady to higher opening when Thursday's night session begins. Stochastics and the RSI are oversold but remain neutral to bearish signaling that sideways to lower prices are possible near-term. If September extends the decline off June's high, the February 18th low crossing at $80.66 is the next downside target. Closes above last-Thursday's high crossing at $95.05 would confirm that a short-term low has been posted. First resistance is last-Thursday's high crossing at $95.05. Second resistance is the 50-day moving average crossing at $99.85. First support is the 38% retracement level of the 2021-2022 rallycrossing at $86.43. Second support is the February 18th lowcrossing at $80.66.
September heating oil closed higher on Wednesday as it extends the rally off the August 8th low crossing at 3.1424. The high-range close sets the stage for a steady to higher opening when Thursday's night trading session begins. Stochastics and the RSI are neutral to bullish signaling that sideways to higher prices are possible near-term. If September extends the rally off the August 8th low, the 50-day moving average crossing at 3.7108 is the next upside target. If September renews the decline off June's high, the 50% retracement level of the 2021-2022 rally crossing at 2.8185 is the next downside target. First resistance is today's high crossing at 3.6213. Second resistance is the 50-day moving average crossing at $3.7109. First support is the 38% retracement level of the 2021-2022 rally crossing at 3.1874. Second support is the 50% retracement level of the 2021-2022 rally crossing at 2.8185.
September unleaded gas closed higher on Wednesday. The high-range close sets the stage for a steady to higher opening when Thursday's night session begins trading. Stochastics and the RSI are neutral to bearish signaling that sideways to lower prices are possible near-term. If September renews the decline off June's high, the 50% retracement level of the 2021-2022 rally crossing at 2.4586 is the next downside target. Closes above last-Thursday's high crossing at $3.1199 would signal that a short-term low has been posted while opening the door for additional gains near-term. First resistance is last-Thursday's high crossing at $3.1199. Second resistance is the July 29th high crossing at $3.2492. First support is the 38% retracement level of the 2021-2022 rally crossing at 2.8073. Second support is the 50% retracement level of the 2021-2022 rally crossing at 2.4586.
September Henry natural gas closed lower on Wednesday due to profit taking but not before spiking above June's high crossing at 9.598. The low-range close sets the stage for a steady to lower opening when Thursday's night session begins trading. Stochastics and the RSI are overbought but remain neutral to bullish signaling that sideways to higher prices are possible near-term. If September extends the rally off the August 8th low, weekly resistance crossing at 9.752 is the next upside target. Closes below the 20-day moving average crossing at 8.364 would signal that a short-term top has been posted.First resistance is today's high crossing at 9.677. Second resistance is weekly resistance crossing at 9.752. First support is the 20-day moving average crossing at 8.364. Second support is the 50-day moving average crossing at 7.503.
CURRENCIES? http://quotes.ino.com/ex?changes/?c=currencies ""
The September Dollar closed slightly higher on Wednesday as it the rally off last-Wednesday's low. The mid-range close sets the stage for a steady to higher opening when Thursday's nights session begins trading. Stochastics and the RSI are neutral to bullish signaling sideways to higher prices are possible near-term. If September extends the rally off last-Wednesday's low, the July 27th high crossing at $107.300 is the next upside target. If September renews the decline off July's high, the 38% retracement level of the 2021-2022 rally crossing at $102.753 is the next downside target. First resistance is the July 27th high crossing at $107.300. Second resistance is July's high crossing at $109.140. First support is last-Wednesday's slow crossing at $104.515. Second support is the 38% retracement level of the 2021-2022 rally crossing at $102.753.
The September Euro closed slightly higher on Wednesday as it consolidated some of the decline off last-Wednesday's high. The high-range close sets the stage for a steady to higher opening when Thursday's night session begins trading. Stochastics and the RSI remain neutral to bearish signaling that sideways to lower prices are possible near-term. Closes below the July 27th low crossing at $1.01345 would mark a downside breakout of the July-August trading range while opening the door for a possible test of July's low crossing at 1.00000. Closes above the 50-day moving average crossing at $1.03524 would confirm that a low has been posted while opening the door for additional gains near-term. First resistance is the 50-day moving average crossing at $1.03524. Second resistance is the June 27th high crossing at 1.06785. First support is the July 27th low crossing at $1.01345. Second support is July's low crossing at $1.00000.
The September British Pound closed lower on Wednesday as it extends the trading range of the past three-weeks. The mid-range close sets the stage for a steady to lower opening when Thursday's night session begins trading. Stochastics and the RSI are neutral to bearish signaling sideways to lower prices are possible near-term. Closes below the August 5th low crossing at 1.2012 would mark a possible downside breakout of the aforementioned trading range while opening the door for additional weakness near-term. If September renews the rally off July's low, the 25% retracement level of the 2021-2022 decline crossing at 1.2385 is the next upside target. First resistance is the 25% retracement level of the 2021-2022 decline crossing at 1.2385. Second resistance is the May high crossing at 1.2677. First support is the August 5th low crossing at 1.2012. Second support is July's low crossing at 1.1778.
The September Swiss Franc closed lower for the third day in a row on Wednesday as it consolidates some of the rally off June's low. The mid-range close sets the stage for a steady to lower opening when Thursday's night session begins trading. Stochastics and the RSI have turned neutral to bearish signaling that sideways to lower prices are possible near-term. Closes below the 20-day moving average crossing at 1.05089 would signal that a short-term top has been posted. If September renews the rally off July's low, the 50% retracement level of the 2021-2022 decline crossing at 1.08120 is the next upside target. First resistance is last-Thursday's high crossing at 1.07010. Second resistance is the 50% retracement level of the 2021-2022 decline crossing at 1.08120. First support is the 20-day moving average crossing at 1.05089. Second support is the 50-day moving average crossing at 1.04052.
The September Canadian Dollar closed lower on Wednesday. The low-range close sets the stage for a steady to lower opening when Thursday's night session begins trading. Stochastics and the RSI are neutral to bearish signaling that sideways to lower prices are possible near-term. Closes below the August 5th low crossing at 76.99 would confirm that a short-term top has been posted. If September renews the rally off July's low, the 62% retracement level of the April-July decline crossing at 78.67 is the next upside target. First resistance is last-Thursday's high crossing at 78.55. Second resistance is the 62% retracement level of the April-July decline crossing at 78.67. First support is the August 5th low crossing at 76.99. Second support is the July 5th low crossing at 76.43.
The September Japanese Yen closed lower on Wednesday as it extends this month's trading range. The low-range close sets the stage for a steady to lower opening when Thursday’s night session begins trading. Stochastics and the RSI have turned neutral to bearish signaling that sideways to lower prices are possible near-term. Closes below the August 8th low crossing at 0.073975 would mark a downside breakout of the aforementioned trading range while opening the door for a possible test of July's low crossing at 0.072085. If September renews the rally off July's low, the 38% retracement level of this year's decline crossing at 0.078281 is the next upside target. First resistance is the August 2nd high crossing at 0.076960. Second resistance is the 38% retracement level of the crossing at 0.078281. First support is the August 8th low crossing at 0.073975. Second support is July's low crossing at 0.072085.
PRECIOUS METALS? http://quotes.ino.com/ex?changes/?c=metals ""
December gold closed lower on Wednesday as it consolidates some of the rally off July's low. The low-range close sets the stage for a steady to lower opening when Thursday's night session begins trading. Stochastics and the RSI have turned neutral to bearish signaling that sideways to lower prices are possible near-term. Closes below the 20-day moving average crossing at $1780.70 would signal that a short-term top has been posted. If December renews the rally off July's low, the 38% retracement level of the March-July decline crossing at $1846.60 is the next upside target. First resistance is the 38% retracement level of the March-July decline crossing at $1846.60. Second resistance is the 50% retracement level of the March-July decline crossing at $1894.90. First support is the 20-day moving average crossing at $1780.70. Second resistance is the July 27th low crossing at $1727.00.
September silver closed lower on Wednesday as it extends the decline off Monday's high. The low-range close sets the stage for a steady to lower opening when Thursday's night session begins trading. Stochastics and the RSI have turned neutral to bearish signaling that sideways to lower prices are possible near-term. Closes below the 20-day moving average crossing at 19.814 would signal that a short-term top has been posted. If September renews the rally off July's low, the 38% retracement level of the March-July decline crossing at 21.575. First resistance is Monday's high crossing at 20.870. Second resistance is the 38% retracement level of the March-July decline crossing at 21.575. First support is the 20-day moving average crossing at 19.814. Second support is the July 14th low crossing at 18.010.
September copper closed lower on Wednesday. The low-range close sets the stage for a steady to lower opening when Thursday's night session begins trading. Stochastics and the RSI have turned bearish signaling that sideways to lower prices are possible near-term. Closes below the 20-day moving average crossing at 3.5227 would signal that a short-term top has been posted. Closes above the 50-day moving average crossing at 3.6661 would open the door for additional gains near-term. First resistance is the 50-day moving average crossing at 3.6661. Second resistance is the 38% retracement level of the March-July decline crossing at 3.8395. First support is the 20-day moving average crossing at 3.5227. Second support is the August 4th low crossing at 3.4160.
GRAINS? http://quotes.ino.com/ex?changes/?c=grains "
December Corn closed up $0.01 3/4-cents at $6.12.
December corn closed closed higher on Wednesday as it consolidated some of the decline off last-Friday's high. The high-range close sets the stage for a steady to higher opening when Thursday's night session begins trading. Stochastics and the RSI have turned neutral to bearish signaling that sideways to lower prices are possible near-term. Closes below the 20-day moving average crossing at $6.07 would signal that a short-term top has been posted. Closes above last-Friday's high crossing at $6.42 3/4 would open the door for a possible test of the 50% retracement level of the May-July decline crossing at $6.64. First resistance is last-Friday's high crossing at $6.42 3/4. Second resistance is the 50% retracement level of the May-July decline crossing at $6.64. First support the 20-day moving average crossing at $6.07. Second support is the July 26th gap crossing at $5.84 1/4.
September wheat closed down $0.22 3/4-cents at $7.63 1/4.
September wheat closed sharply lower on Wednesday on news of Russian expectations of a larger crop while extending the July-August trading range. The low-range close sets the stage for a steady to lower opening when Thursday's night session begins trading. Stochastics and the RSI have turned bearish signaling that sideways to lower prices are possible near-term. If September renews the decline off May's high, the 75% retracement level of the January-May rally crossing at $7.23 is the next downside target. Closes above the July 29th high crossing at $8.45 3/4 would signal that a short-term low has been posted while marking a potential upside breakout of the aforementioned trading range. First resistance is the July 29th high crossing at $8.45 3/4. Second resistance is the 50-day moving average crossing at $8.73 1/2. First support is the August 3rd low crossing at $7.52. Second support is the 75% retracement level of the January-May's rally crossing at $7.23.
September Kansas City Wheat closed down $0.20 3/4-cents at $8.51.
September Kansas City wheat closed lower on Wednesday as it extends the July-August trading range. The low-range close sets the stage for a steady to lower opening when Thursday's night session begins trading. Stochastics and the RSI have turned bearish signaling that sideways to lower prices are possible near-term. If September renews the decline off May's high, February's low crossing at $7.64 1/2 is the next downside target. Closes above the July 29th high crossing at $9.15 1/4 would signal that a short-term low has been posted. First resistance is the July 29th high crossing at $9.15 1/4. Second resistance is the 50-day moving average crossing at $9.40 1/2. First support is July's low crossing at $8.14 1/2. Second support is February's low crossing at $7.64 1/2.
September Minneapolis wheat closed down $0.19 1/4-cents at $8.83 1/2.
September Minneapolis wheat closed lower on Wednesday as it extends the July-August trading range. The low-range close sets the stage for a steady to lower opening when Thursday's night session begins trading. Stochastics and the RSI have turned bearish signaling that sideways to lower prices are possible near-term. If September resumes the decline off May's high, the 75% retracement level of the January-May rally crossing at $8.12 3/4 is the next downside target. Closes above the July 20th high crossing at $9.56 would signal that a short-term low has been posted. First resistance is the July 20th high crossing at $9.56. Second resistance is the 50-day moving average crossing at $9.88 1/2. First support is the August 3rd low crossing at $8.64 3/4. Second support is the 75% retracement level of the January-May rally crossing at $8.12 3/4.
SOYBEAN COMPLEX? http://quotes.ino.com/ex?changes/?c=grains "
November soybeans closed up $0.09-cents at $13.90.
November soybeans closed higher on Wednesday as it consolidated some of this week's decline but remains below the 20-day moving average crossing at $13.99 3/4 confirming that a short-term top has been posted. The mid-range close sets the stage for a steady to higher opening when Thursday's night session begins trading. Stochastics and the RSI are neutral to bearish signaling that sideways to lower prices are possible near-term. If November extends this week's decline, the July 26th gap crossing at $13.49 1/4 is the next downside target. If November renews the rally off July's low, the June 30th high crossing at $15.07 3/4 is the next upside target. First resistance is last-Friday's high crossing at $14.64 3/4. Second resistance is the July 29th high crossing at $14.89. Third resistance is the June 30th high crossing at $15.07 3/4. First support is the August 3rd low crossing at $13.56. Second support is the bottom of the July 26th gap crossing at $13.49 1/4. Third support is July's low crossing at $12.88 1/2.
December soybean meal closed up $4.50 at $400.60.
December soybean meal posted an inside day with a higher close on Wednesday. The high-range close sets the stage for a steady to higher opening when Thursday's night session begins trading. Stochastics and the RSI are oversold but remain neutral to bearish signaling that sideways to lower prices are possible near-term. Multiple closes below the August 3rd low crossing at $395.50 would confirm a downside breakout of August's trading range while opening the door for additional weakness near-term. Closes above the 10-day moving average crossing at $407.50 would temper the near-term bearish outlook. First resistance is the August 10th high crossing at $424.00. Second resistance is the July 29th high crossing at $431.70. First support is the August 3rd low crossing at $395.50. Second support is the July 22nd low crossing at $380.80.
December soybean oil closed down 46-pts. at 65.60.
December soybean oil closed lower on Wednesday as it consolidates some of the rally off July's low. The low-range close sets the stage for a steady to lower opening when Thursday's night session begins trading. Stochastics and the RSI are turning neutral to bearish signaling that sideways to lower prices are possible near-term. Closes below the 20-day moving average crossing at 62.88 would signal that a short-term top has been posted. If December extends the rally off July's low, the 62% retracement level of the June-July decline crossing at 69.82 is the next upside target. First resistance is the August 12th high crossing at 68.16. Second resistance is the 62% retracement level of the June-July decline crossing at 69.82. First support is the 20-day moving average crossing at 62.88. Second support is the August 4th low crossing at 60.20.
LIVESTOCKhttp://quotes.ino.com/exchanges/?c=livestock
October hogs closed up $1.68 at $98.25.
October hogs closed higher on Wednesday as it consolidates some of the decline off last-Thursday's high. The high-range close sets the stage for a steady to higher opening when Thursday's session begins trading. Stochastics and the RSI have turned neutral to bearish signaling that sideways to lower prices are possible near-term. If October extends the aforementioned decline, the 50-day moving average crossing at $94.51 is the next downside target. If October renews the rally off July's low, weekly resistance crossing at $103.72 is the next upside target. First resistance is last-Thursday's high crossing at $101.65. Second resistance is weekly resistance crossing at $103.72. First support is the 50-day moving average crossing at $94.51. Second support is the July 26th low crossing at $92.43.
October cattle closed up $0.18 at $145.85
October cattle closed higher on Wednesday as it extended the rally off May's low. The high-range close sets the stage for a steady to higher opening on Thursday. Stochastics and the RSI are overbought but remain neutral to bullish signaling that sideways to higher prices are possible near-term. If October extends the rally off June's low, the April 22nd high crossing at $147.50 is the next upside target. Closes below the 20-day moving average crossing at $143.46 would confirm that a short-term top has been posted. First resistance is the April 25th gap crossing at $145.98. Second resistance is April's high crossing at $147.50. First support is the 20-day moving average crossing at $143.46. Second support is the 50-day moving average crossing at $141.73.
October Feeder cattle closed up $1.53 at $189.55.
October Feeder cattle closed higher on Wednesday as it extends the rally off May's low. The high-range close sets the stage for a steady to higher opening when Thursday's session begins trading. Stochastics and the RSI are neutral to bullish signaling that sideways to higher prices are possible near-term. If October extends the rally off May's low, the 62% retracement level of the 2014-2020 decline on the monthly continuation chart crossing at $191.56 is the next upside target. Close below the 20-day moving average crossing at $185.69 would confirm that a short-term top has been posted while opening the door for additional weakness near-term. First resistance is today's high crossing at $190.20. Second resistance is the 62% retracement level of the 2014-2020 decline on the monthly continuation chart crossing at $191.56. First support is the 20-day moving average crossing at $185.69. Second support is the 50-day moving average crossing at $181.81.
FOOD & FIBERhttp://quotes.ino.com/ex changes/?c=food
December coffee closed lower on Wednesday as it consolidates some of the rally off July's low. The low-range close sets the stage for a steady to lower opening on Thursday. Stochastics and the RSI are turning neutral to bearish signaling that sideways to lower prices are possible near-term. If December extends the rally off July's low, July's high crossing at $23.23 is the next upside target. Closes below the 20-day moving average crossing at $21.26 would signal that a short-term top has been posted. First resistance is last-Friday's high crossing at $22.34. Second resistance is July's high crossing at $23.23. First support is the 20-day moving average crossing at $21.26. Second support is the August 2nd low crossing at $20.28.
December cocoa closed higher on Wednesday and above the 50-day moving average crossing at 24.05 signaling that a short-term low has been posted. The high-range close sets the stage for a steady to lower opening on Thursday. Stochastics and the RSI are turning neutral to bullish signaling sideways to higher prices are possible near-term. If September extends the rally off August's low, the June 21st high crossing at 25.07 is the next upside target.
October sugar closed lower on Wednesday as it consolidates some of the rally off August's low. The low-range close sets the stage for a steady to lower opening on Thursday. Stochastics and the RSI are overbought and are turning neutral to bearish signaling that sideways to lower prices are possible near-term. Closes below the 20-day moving average crossing at 17.94 would signal that a short-term top has been posted. If October extends the rally off August's low, July's high crossing at 19.69 is the next upside target.
December cotton closed lower on Wednesday as it consolidates some of the rally off July's low. The low-range close sets the stage for a steady to lower opening on Thursday. Stochastics and the RSI are overbought but remain neutral to bullish signaling that sideways to higher prices are possible near-term. If December extends the rally off July's low, the 75% retracement level of the May-July decline crossing at 121.11 is the next upside target. Closes below Monday's gap crossing at 108.59 would signal that a short-term top has been posted.
Thanks tallpine!!
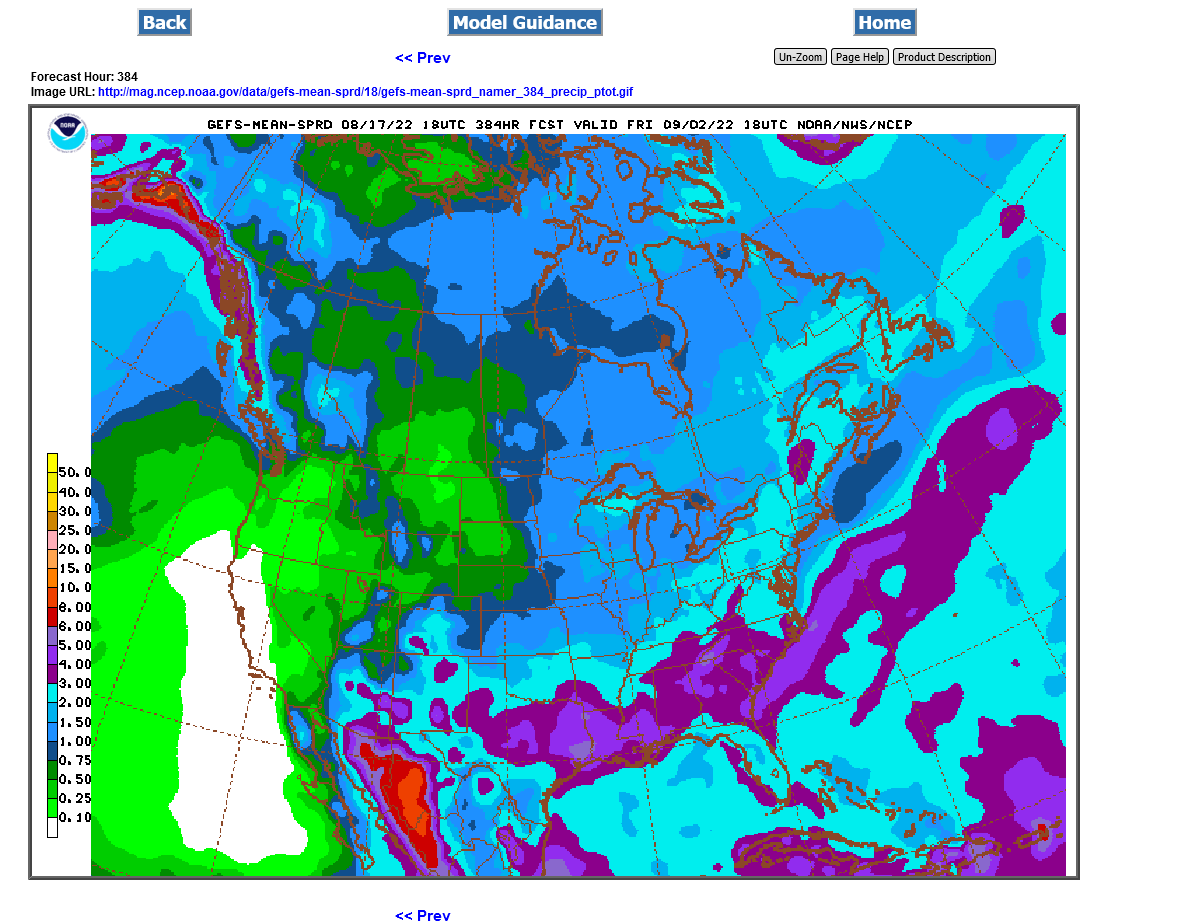
Latest weather. Probably more neutral than anything for grains and natural gas and its late in the Summer too.
Weather page:
https://www.marketforum.com/forum/topic/83844/
2 week rains below from the last 18z GFS: